Watch how to download trading robots for free
Find us on Facebook!
Join our fan page
Join our fan page
You liked the script? Try it in the MetaTrader 5 terminal
- Views:
- 8050
- Rating:
- Published:
- Updated:
-
Need a robot or indicator based on this code? Order it on Freelance Go to Freelance
Real author:
Pedro Puado
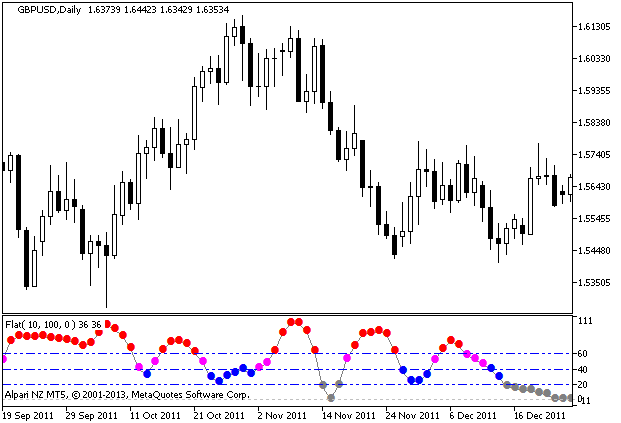
The indicator for measuring market volatility.
During strong trends colored dots of the indicator turn red, during weak trends dots are gray. Moderate trends are shown in blue.
Indicator input parameters:
//+----------------------------------------------+
//| Indicator input parameters                   |
//+----------------------------------------------+
input uint Smooth=10;                                // Smoothing period
input ENUM_MA_METHOD      ma_method=MODE_SMA;        // Type of smoothing
input ENUM_APPLIED_PRICE  applied_price=PRICE_CLOSE; // Price type
input uint HLRef=100;
input int Shift=0;                                   // Horizontal shift of the indicator in bars
input uint ExtraHighLevel=60;                        // The level of the strongest trend
input uint HighLevel=40;                             // The level of a strong trend
input uint LowLevel=20;                              // The level of a weak trend
input ENUM_LINE_STYLE LevelStyle=STYLE_DASHDOTDOT;   // Style of level lines
input color LevelColor=clrBlue;                      // Color of the levels
input ENUM_WIDTH LevelWidth=w_1;                     // Width of the levels
Originally this indicator has been written in MQL4 and was first published in the Code Base at mql4.com on 01.11.2007.

Figure 1. The Flat indicator
Translated from Russian by MetaQuotes Ltd.
Original code: https://www.mql5.com/ru/code/2060
 WPR_3HTF
Three Larry Williams' Percent Range indicators from three different timeframes displayed on the same chart.
 Fisher_mbk_HTF
The Fisher_mbk indicator with the timeframe selection option available in input parameters.