Join our fan page
- Views:
- 9322
- Rating:
- Published:
- Updated:
-
Need a robot or indicator based on this code? Order it on Freelance Go to Freelance
Real author:
TOPpoint
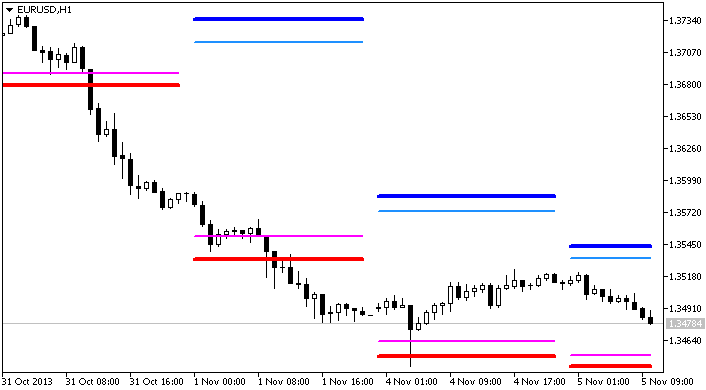
Two pairs of support and resistance levels based on the candlesticks of the timeframe specified in the input parameters.
The formula for the calculation of the levels:
Res2 = ( Low + High + Close ) / 3 + ( High - Low ) * 0.618
Res1 = ( Low + High + Close ) / 3 + ( High - Low ) * 0.5
Sup1 = ( Low + High + Close ) / 3 - ( High - Low ) * 0.5
Sup2 = ( Low + High + Close ) / 3 - ( High - Low ) * 0.618
This indicator was first implemented in MQL4 and published in the Code Base at mql4.com on 30.01.2008.

The RES-SUP indicator
Translated from Russian by MetaQuotes Ltd.
Original code: https://www.mql5.com/ru/code/1956
 NR4ID-ATR
The indicator fixes the moments when the volatility of the financial asset takes to a minimum value and puts colored dots on the chart in the middle of the range of the candlestick movement.
 Exp_BlauCSI
Trading system using the BlauCSI indicator.
 BlauErgodicMDI
The Ergodic MDI Oscillator from the book "Momentum, direction and divergence" by William Blau, implemented in the form of a color histogram with a signal line implemented as a colored cloud.
 CCI_3HTF
Three Commodity Channel Index indicators from three different timeframes displayed on the same chart.