Join our fan page
- Views:
- 11362
- Rating:
- Published:
- Updated:
-
Need a robot or indicator based on this code? Order it on Freelance Go to Freelance
The idea:
Every flat has its time. The indicator measures the flat, and such concept as "trend" is not applied.
When flat time is executed, the moment of result fixation or new position opening comes. Double time approach can be applied to any fluctuations whether it pertains to weather, balance chart, or a quote. The primary thing is that something small is fluctuating against something big. Time of flat execution is calculated in bars as the difference between the 1st and the 2nd points of the line added to the 2nd point. Inactive days are not taken into account.
Working with lines:

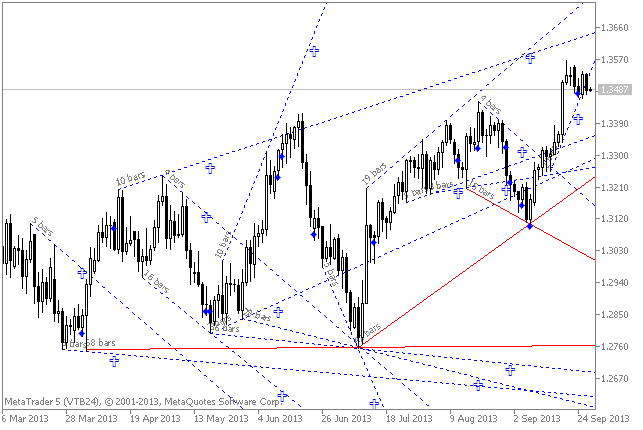
Lines are drawn manually. The indicator takes line data. Lines should be drawn according to flats. To that end, we need to take fractals and use the following principle: draw a line from every fractal to all subsequent ones involving upper fractals for the upper one and lower fractals for the lower one. Lines touched by the price can be removed. Accordingly, if the line can technically be touched in the process of drawing, it don't have to be drawn. If the line "highlights" an aggregate of flats (seizes more than one flat), this flat is considered as a separate one.
Trade analysis:


One should wait until one flat or a group of flat is executed and enter. One piece of news or a group of pieces of news and one or several executions can be used. For example, there is a piece of news concerning the USA employment. We should wait until the flat or a group of flats is executed in one direction and enter. Or for example, some reduction of QE or interest rate rise is expected in the next session of the Federal Reserve System. So, we should wait until the most global flat or a group of flats is executed and enter, and as the piece of news is received we hold the position and exit. The principle is that a published piece of news or expectation of a piece of news leads the flat to execution, and an entry is performed not in response of a recently published piece of news.
Stop loss can be moved along the line. If the price touches the line before execution, the open position should be closed. The flat is not always executed before the price touches the line. There are such lines where stop loss passes the second point. If so, the stop can be placed beyond the 2nd point (in order a loss-making stop loss does not increase).
Economical statistics analysis:
The method can be applied for analysis of any fluctuating economical data for a period. If there is an opportunity to gather data history in a subwindow of a chart, the data analysis can be made right in the terminal via the indicator.
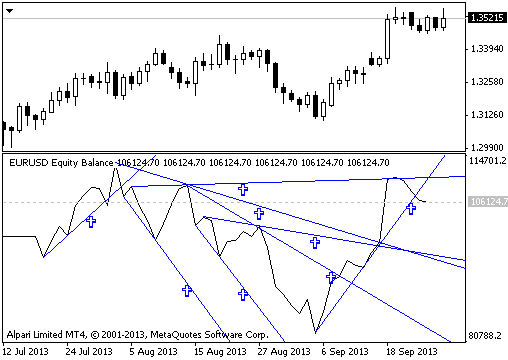
Example: the figure shows when the period of low interest rates is executed. Such moment has come for Dollar, and rate increase step will soon be started in one of the following sessions. For Euro such moment will come in two years. It turns out that Euro can fall against Dollar during 2 years.
Trade results analysis:

Technically, Forex works against any strategy ensuring its own liquidity. We can only observe the strategy producing a stable profit for some time, but there comes a time when the profit does not exceed a reached supreme point and resets to zero in future. The market is changing, so strategies have to be changed according to the market. And if we know time of changing, we can know when to stop (or start) using some strategy whether it pertains to discretionary management, signals, automated advisor, or manual trading. This analysis does not differ from currency pairs analysis.
Information display:
Execution sign appears ex post, signal sign appears upon zero bar opening, and visual sign (a cross) appears on the line. When the flat is executed, lines are dotted, and signs and lines turn blue (on default).
The line is red (on default) if it is not executed. You can see how much time you have before execution starting from the second point of the line (excluding signal bar) in the description and on the line (if the description is included into the chart's features).
Variables:
- Accuracy. You can set accuracy (for instance per minute or per second). It is necessary for down-to-the-minute accuracy (for example, during the day timeframe). If minute accuracy is set, we can be sure that every minute is downloaded, and the line is drawn in necessary points, otherwise execution time can be incorrect. Accuracy of a current timeframe is applied on default.
- Colors of execution and non-execution. Colors of lines and signs can be selected.
- Chart's subwindow. If you need indicator measurements (for instance, made by stochastics or balance indicator), you should specify the chart's subwindow. On default, 0 is the main window, and further in the order 1, 2, etc. (from up to down). If you need signals from all windows, you should set -1.
Translated from Russian by MetaQuotes Ltd.
Original code: https://www.mql5.com/ru/code/1851
 FractalsTrendLines
The indicator draws bull and bear lines of a trend on the basis of iFractals indicator's data from the nearest extremum to the last fractal broken down.
 Flight smiles
Flight smiles.
 Mass_Index_HTF
The Mass_Index indicator with the timeframe selection option available in input parameters.
 SMTP Mail Library
Library for sending mail messages.