Join our fan page
- Views:
- 11951
- Rating:
- Published:
-
Need a robot or indicator based on this code? Order it on Freelance Go to Freelance
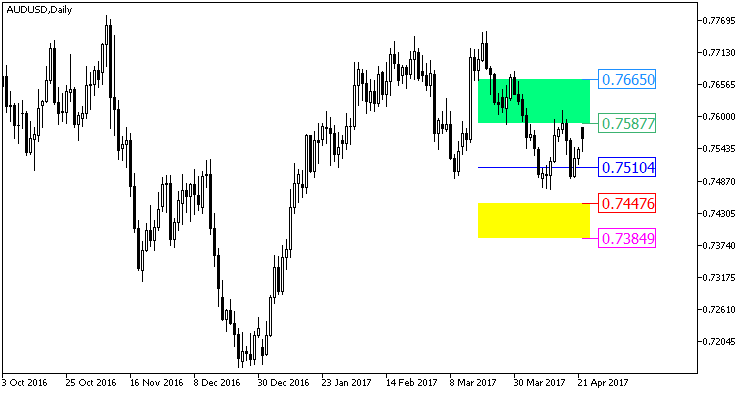
Two colored filled rectangles with the display of channel levels. The rectangles are drawn between the values of two channels on one bar of any timeframe of the GRFLeadingEdge indicator.
Indicator input parameters:
//+--------------------------------------------+
//|  Indicator input parameters                |
//+--------------------------------------------+
input ENUM_TIMEFRAMES TimeFrame=PERIOD_H4;              // Chart period
input string Symbols_Sirname="GRFLeadingEdger_Pivot_";  // Name for the indicator labels
input uint Samples=60;
input int  LookAhead=0;
input double StdLevel1=2.0;
input double  StdLevel2=4.0;
input color Up_Color=clrSpringGreen;                    // The color of the upper band of the indicator
input color Dn_Color=clrYellow;                         // The color of the lower band of the indicator
input uint SignalBar=0;                                 // Bar index to get the indicator values
input uint SignalLen=40;                                // The length of the indicator bands
//---- Colors of price labels
input color  Middle_color=clrBlue;
input color  Upper_color1=clrMediumSeaGreen;
input color  Lower_color1=clrRed;
input color  Upper_color2=clrDodgerBlue;
input color  Lower_color2=clrMagenta;
The indicator requires GRFLeadingEdge.mq5 indicator file. Save it to <terminal_data_folder>\MQL5\Indicators.

Fig1. GRFLeadingEdger_Pivot_HTF
Translated from Russian by MetaQuotes Ltd.
Original code: https://www.mql5.com/ru/code/18196
 PercentageCrossoverChannel_System
The indicator implements a breakthrough system using the PercentageCrossoverChannel channel.
 PercentageCrossover
A Moving indicator that does not use averaging in its code.
 PercentageCrossoverChannel_Cloud
The channel is based on a percentage price deviation. It is implemented with a color background filling. The channel width is controlled by the percentage deviation.
 RBVI_HTF
The RBVI indicator with the timeframe selection option available in its input parameters.