Join our fan page

Volatility Quality Stridsman - indicator for MetaTrader 5

- Views:
- 16470
- Rating:
- Published:
-
 You are missing trading opportunities:
- Free trading apps
- Over 8,000 signals for copying
- Economic news for exploring financial markets
Registration Log inYou agree to website policy and terms of use
If you do not have an account, please register -
 Need a robot or indicator based on this code? Order it on Freelance
Go to Freelance
Need a robot or indicator based on this code? Order it on Freelance
Go to Freelance
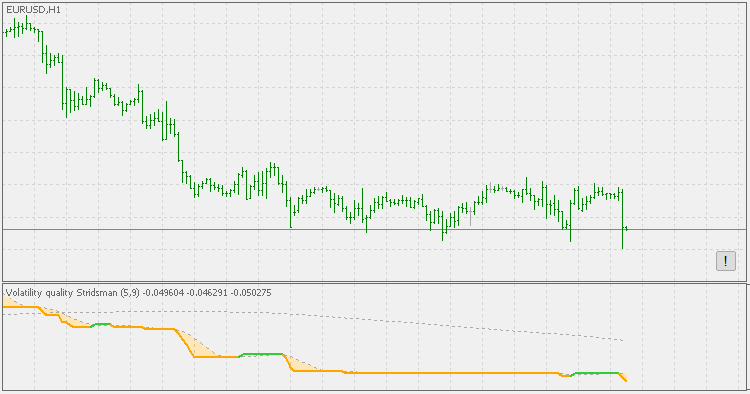
Volatility quality Stridsman indicator (Thomas Stridsman is the inventor of that indicator, and this version is coded the way how original version is, not like some variations that are commonly used).
This plots 4 value:
- fast average
- slow average
- Volatility quality line (the colored line)
- the zone between the volatility quality and the fast average
Color of the line and color of the zone should help finding the current trend.
PS: The fill color and the color of the slope of the volatility quality aren't necessarily the same, so pay attention when it comes to that. Also, Stridsman version is using that "slow" average that is the primary criteria for trend (if the VQ is above slow average, the trend is up, if it is bellow, the trend is down). Colors of VQ in that case can be treated as short term changes in the trend.
Volatility Quality Stridsman (histo)
Volatility Quality Stridsman (histo).
Smoother std adaptive
Smoother - standard deviations adaptive.
High and Low Custom levels
High and Low. For levels, you can specify an offset. You can specify the interval (PERIOD_D1) on which to search for levels.
 Breakthrough_BB
Advisor on the signals of the indicators Bollinger Bands and Moving Average.