Join our fan page
- Views:
- 8226
- Rating:
- Published:
- Updated:
-
Need a robot or indicator based on this code? Order it on Freelance Go to Freelance
The real author:
Gryb Alexander
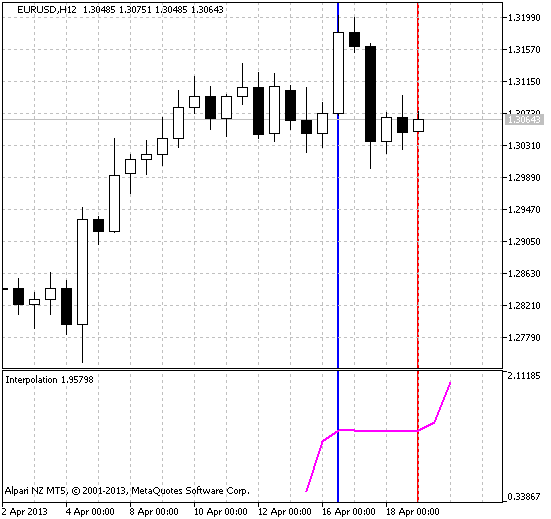
The Lagrange interpolating polynomial is used to determine the functions by the specified points. In fact, the indicator takes the coordinates of price points between input int ibegin and input int iend (They are drawn by red and blue lines in the chart) and with the help of the Lagrange interpolating polynomial it calculates the coordinates of the next points.
Remarks:
- iend-ibegin = the degree of the polinomial. That is, if the distance between ibegin and iend is equal to two, then the chart will be a parabola, if the three, it will be hyperbola, etc.
Indicator input parameters:
//+----------------------------------------------+
//|  INDICATOR INPUT PARAMETERS                  |
//+----------------------------------------------+
input uint inumPrognoz=2;  // Number of predicted bars
input uint ibegin=0;       // Starting bar for the analysis
input uint iend=5;         // Last bar for the analysis
This indicator was first implemented in MQL4 and published in Code Base at mql4.com on 15.11.2008.

Fig.1 The Interpolation indicator
Translated from Russian by MetaQuotes Ltd.
Original code: https://www.mql5.com/ru/code/1662
 FullSSA
The redrawing oscillator drawn on the basis of the SSA.mqh singular transformation library of functions
 Waddah_Attar_Def_RSI
The MACD smoothed histogram drawn on the basis of the RSI technical indicator.