Join our fan page
- Views:
- 5736
- Rating:
- Published:
- Updated:
-
Need a robot or indicator based on this code? Order it on Freelance Go to Freelance
Real author:
Vadim Shumiloff
The indicator is the development of the idea of using the Normalized Volume.
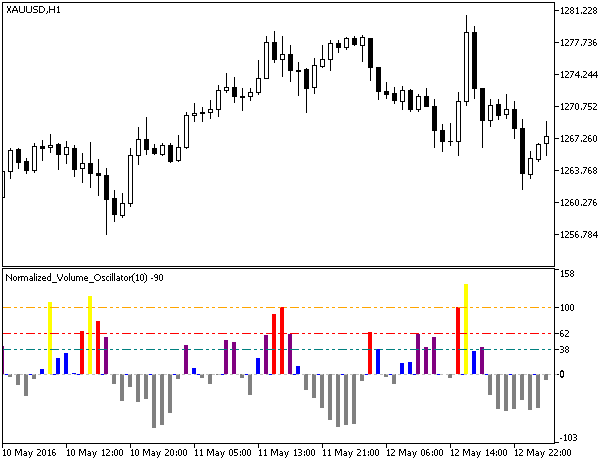
First, the normalized volume values are now expressed as a percentage of the average value for the period. Consequently, the data on the chart can now take negative values, which means a lull in the market.
Another useful addition is coloring of the histogram columns depending on the value of the normalized volume.
- Gray color means that the current volume is less than the average for the period;
- Blue color means a small excess of the volume compared to the average for the period;
- Brown color means that the increase in volume has exceeded the 38,2% Fibo level compared to the average for the period;
- Red color means that the increase in volume has exceeded the 61,8% Fibo level compared to the average for the period;
- Yellow color (red in the figure below, so as not to blend with the background) means that the increase in volume has exceeded the 100% level compared to the average for the period.
Originally this indicator has been written in MQL4 and was first published in the Code Base on 19.06.2008.

Fig.1. The Normalized_Volume_Oscillator indicator
Translated from Russian by MetaQuotes Ltd.
Original code: https://www.mql5.com/ru/code/16030
 Exp_i-CAiChannel_System_Digit
The breakthrough trading system based on the signals of the i-CAiChannel_System_Digit indicator.
 PFE_HTF
The PFE indicator with the timeframe selection option available in input parameters.
 StodivCandle
The StochCandles indicator. Colors the candles based on the Stochastic.
 RSIdivCandle
The RSIdivCandle indicator. Colors the candles based on the RSI oscillator.