Join our fan page
- Views:
- 4220
- Rating:
- Published:
- Updated:
-
Need a robot or indicator based on this code? Order it on Freelance Go to Freelance
The Exp_OsHMA Expert Advisor drawn on the basis of the signals taken from the OsHMA histogram.
A signal to perform a deal is formed at bar closing when there is breakthrough in the OsHMA histogram zero level or the histogram changes direction (depending on the options selected in the input parameter Mode).
Place the OsHMA.ex5 compiled file to the terminal_data_folder\MQL5\Indicators.
Default Expert Advisor's input parameters have been used during the tests shown below. Stop Loss and Take Profit have not been used during the tests.

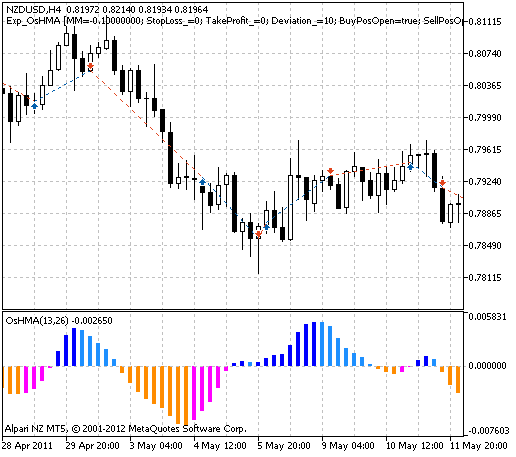
Fig. 1. The instances of history of deals in the chart.
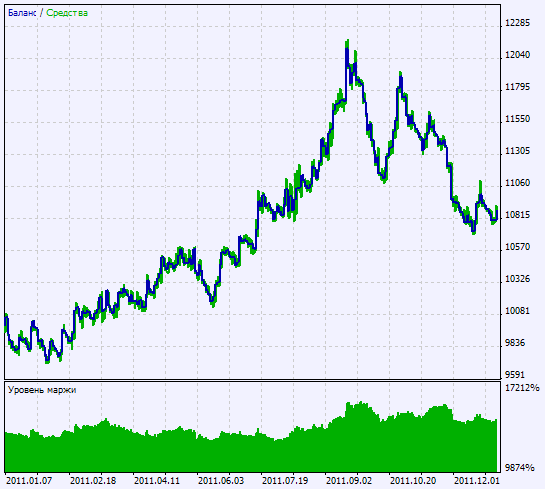
Testing results for 2011 at NZDUSD H4:

Fig. 2. Chart of testing results
Translated from Russian by MetaQuotes Ltd.
Original code: https://www.mql5.com/ru/code/1335
 AC_Signal
A semaphore, signal indicator drawn on the basis of the values of the Accelerator of Bill Williams with sending alerts, push-notifications and e-mail messages
 ytg_Price_Peak
The indicator of Peak Price Values.
 LinearRegressionChannel
Custom instrument of the linear regression. LR line, Support and Resistance lines values are in the buffers
 XMUV
XMUV
The drawing of this Moving Average is based on Demark's method "Daily Range Projections".
