Watch how to download trading robots for free
Find us on Twitter!
Join our fan page
Join our fan page
You liked the script? Try it in the MetaTrader 5 terminal
- Views:
- 8512
- Rating:
- Published:
- Updated:
-
Need a robot or indicator based on this code? Order it on Freelance Go to Freelance
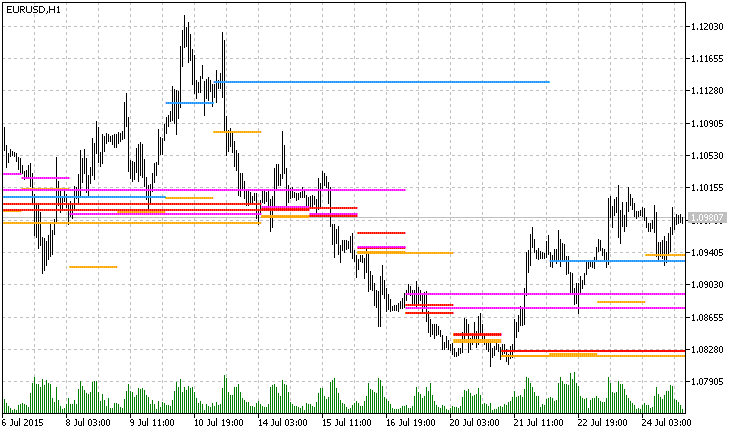
This indicator shows the support/resistance lines using price histogram. The indicator is not so heavy, the calculation was simplified.
Display:
- Gold Line — peaks of a 1-day histogram.
- Red Line — peaks of a short term histogram.
- Magenta Line — peaks of a medium term histogram.
- Blue Line — peaks of a long term histogram.

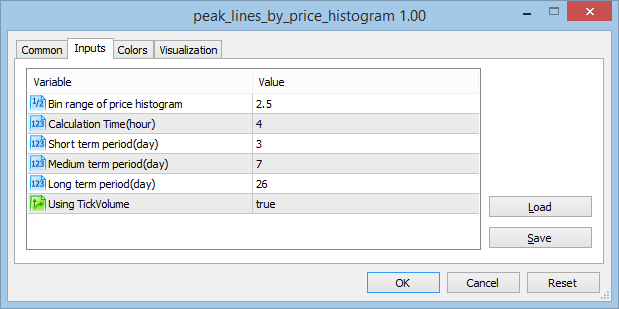
Settings:

 MomentumCloud
Cloud indicator, the envelopes of which represent the Momentum oscillator values calculated for High and Low prices.
 ColorZerolagTriXOSMATrend_x10
The ColorZerolagTriXOSMATrend_x10 indicator shows the ColorZerolagTriXOSMA oscillator direction from ten different timeframes.
 ColorZerolagRSIOSMA_HTF
The ColorZerolagRSIOSMA indicator with the timeframe selection option available in the input parameters.
 ColorZerolagRSIOSMACandle
The ColorZerolagRSIOSMA indicator implemented as a sequence of candlesticks.