Join our fan page
- Views:
- 8439
- Rating:
- Published:
- Updated:
-
Need a robot or indicator based on this code? Order it on Freelance Go to Freelance
The real author:
Yuriy Tokman
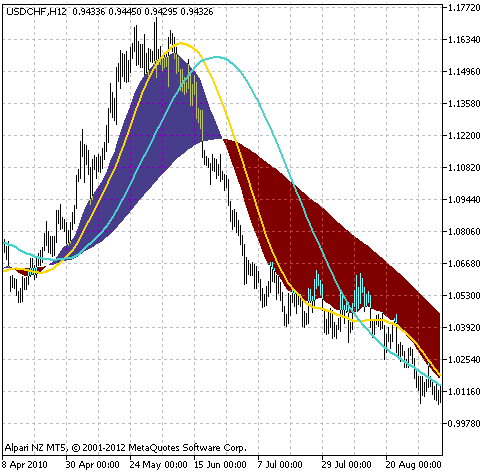
The MACD histogram drawn using two signal lines in the price chart of the financial asset.
This indicator was first implemented in MQL4 and published in Code Base on 18.11.2009.
The indicator uses SmoothAlgorithms.mqh library classes (must be copied to the terminal_data_folder\MQL5\Include). The use of the classes was thoroughly described in the article "Averaging price series for intermediate calculations without using additional buffers".

Fig.1 The 2XMA indicator
Translated from Russian by MetaQuotes Ltd.
Original code: https://www.mql5.com/ru/code/1249
 AffineTransform
The indicator transfers the price data to the new coordinates system shifting price axis (axis of the ordinates).
 Ind_2 Line+1
The indicator of the arbitrage situation for spread consisting from two instruments
 String - Library of functions for working with strings
Library of functions for working with strings: StringToArray, StringToPeriod and PeriodToString
 Exp_GG-RSI-CCI
The Expert Advisor using the GG-RSI-CCI signal indicator.