Join our fan page
- Views:
- 7785
- Rating:
- Published:
- Updated:
-
Need a robot or indicator based on this code? Order it on Freelance Go to Freelance
Real author:
Khlystov Vladimir
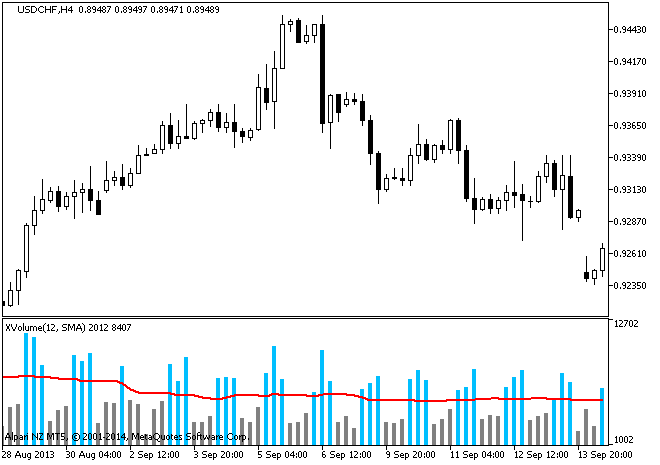
Volume indicator. The histogram displays volumes of a price chart, and red lines shows their averaging.
If the histogram is above the mean level, it changes to bright green. If volumes are below the mean level, the histogram turns gray.
The indicator uses SmoothAlgorithms.mqh library classes (must be copied to the terminal_data_folder\MQL5\Include). The use of the classes was thoroughly described in the article "Averaging Price Series for Intermediate Calculations Without Using Additional Buffers".

Fig.1. XVolume Indicator
Translated from Russian by MetaQuotes Ltd.
Original code: https://www.mql5.com/ru/code/11392
 RegressionPolynomial
RegressionPolynomial is a trend indicator calculating values of polynomial regression on each bar.
 BnB_HTF
The BnB indicator with the timeframe selection option available in input parameters.
 XVolume_HTF
The XVolume indicator with the timeframe selection option available in input parameters.
 Show Bid
The indicator displays the current Bid price magnified on the chart.