Join our fan page
- Views:
- 11550
- Rating:
- Published:
- Updated:
-
Need a robot or indicator based on this code? Order it on Freelance Go to Freelance
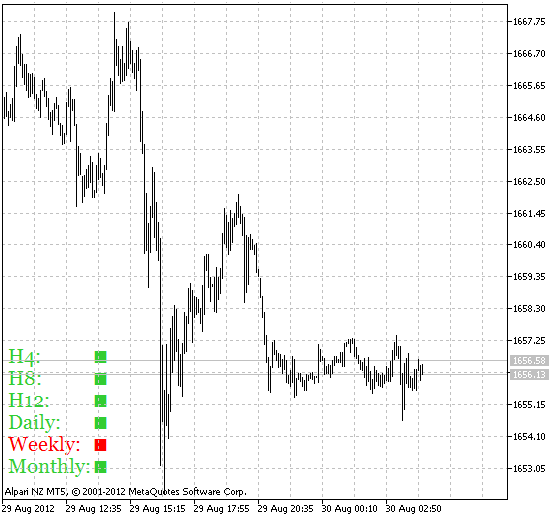
The CandleTrend indicator displays price movement directions from six different timeframes: H4, H8, H12, Daily, Weekly, Monthly. Downtrend paints squares in red, uptrend - in green.
Indicator input parameters:
//+----------------------------------------------+
//| Indicator input parameters                   |
//+----------------------------------------------+
input color  UpColor=LimeGreen;  // currency uptrend color
input color  DnColor=Red;        // currency downtrend color
input color  ZrColor=Gray;       // no change color
input int    FontSize=11;        // font size
input type_font FontType=Font14; // font type
input ENUM_BASE_CORNER  WhatCorner=CORNER_LEFT_LOWER; // location corner
input uint Y_=20;                                     // vertical location
input uint X_=5;                                      // horizontal location

Fig.1 The CandleTrend Indicator
Place GetFontName.mqh library file to the 'terminal_directory\MQL5\Include' folder.
Translated from Russian by MetaQuotes Ltd.
Original code: https://www.mql5.com/ru/code/1028
 CCIT3_Simple
Modified CCIT3 indicator
 BubblesAndDrops
The indicator shows possible price movement direction.
 XPercentR-PCR
The simple oscillator indicator displayed as colored cloud.
 PercentInfo
PercentInfo gives information on the rise and drop in prices expressed as a percentage and in points as obtained from the three largest time frames of the currency chart. Simple and good information assistant.