EngulfingScanner user guide: engulfing candle scanner for MT5 and MT4

This is the user guide for EngulfingScanner for MT5 and MT4, an engulfing candle scanner that watches many symbols and timeframes at once and grades every bullish and bearish engulfing by its context. One panel shows each fresh engulfing on closed bars with its grade and age, the top setups across your market watch, and a small execution section that trades the chart symbol with the stop beyond the pattern. More about it is on engulfingscanner.com.
How-tos and articles: How to trade engulfing candles at key levels and Bullish and bearish engulfing patterns: what the context tells you.
What it is
- An Expert Advisor with a panel. It never trades by itself: an order is sent only when you click Buy or Sell.
- A scanner grid: symbols down, timeframes across. By default the 28 major and cross currency pairs plus XAUUSD on M5, M15, M30, H1, H4 and D1, or your own list of up to 40 symbols and 8 timeframes.
- A context grade A, B or C on every pattern, from key levels, liquidity sweeps, the higher timeframe trend, candle size, session and high-impact news.
- An overview: fresh patterns counted per timeframe and per currency, and the top setups one click away.
- Chart marks: a click on a cell switches the chart and draws the two candles, the grade and the key level.
- An execution section: stop beyond the pattern plus a buffer, target as a multiple of the stop, lot size from your risk, one-click Buy and Sell, break-even and close.
- Alerts for new A grades (or A and B, or every engulfing) on the timeframes you choose.
Install and first run
- 1. Install it from the Market: in the terminal press Ctrl+T, open the Market tab, then Purchased, and click Install.
- 2. Open any chart. The scanner reads every symbol and timeframe in its list, whatever the chart shows, and always adds the chart symbol.
- 3. In the Navigator, find EngulfingScanner under Expert Advisors, Market, and drag it onto the chart.
- 4. On the Common tab, allow Algo Trading (MT4: "Allow live trading") if you want to use the Buy and Sell buttons. Also switch on the Algo Trading button in the toolbar (MT4: AutoTrading). The scanner itself works without it.
- 5. Check the Inputs tab, at least the symbols and timeframes, the risk mode and value, and the alerts. Then press OK.
The panel opens at the top left. The first scan after the terminal starts can take up to a minute while MetaTrader loads the history of each symbol: those cells show three dots, and the status pill in the header reads SCAN with the number of series still loading. Once every series is in, the pill reads LIVE and a full scan takes under a second. A chart holds one Expert Advisor, so EngulfingScanner takes the place of any other EA on that chart. Run one copy per terminal, since two copies would alert twice.
Symbols and broker names
Leave the symbol list blank for the 28 majors and crosses plus XAUUSD, or type your own, comma separated. Broker prefixes and suffixes such as EURUSD.a or EURUSDm are found from the chart symbol, or you can type them in the inputs. A symbol the broker does not carry is skipped and named in the Experts log, and XAUUSD falls back to GOLD where the broker uses that name.
What counts as an engulfing
A bullish engulfing is an up candle (close above open) after a down candle, whose body covers the prior body: its close is at or above the prior open and its open at or below the prior close. A bearish engulfing is the mirror image. Three inputs change the definition:
- Prior candle must be the opposite colour (on by default). Switched off, the prior candle can be any colour, and the engulfing body must then be larger than the prior body and cover it.
- Also engulf the full range (off by default): the engulfing candle's high and low must also cover the prior candle's high and low.
- Minimum body, 0.25 x ATR(14) by default, so tiny candles that happen to cover a tiny prior body are ignored. 0 switches it off.
Below D1, two candles separated by a market closure, such as the weekend, are not treated as one pattern: Friday's last bar never pairs with Monday's first. On D1, Friday to Monday counts, as traders read daily charts.
Everything is found on closed bars only. A pattern appears when its candle has closed, its grade uses data that was fixed at that moment, and a cell never changes its past or repaints.
The header
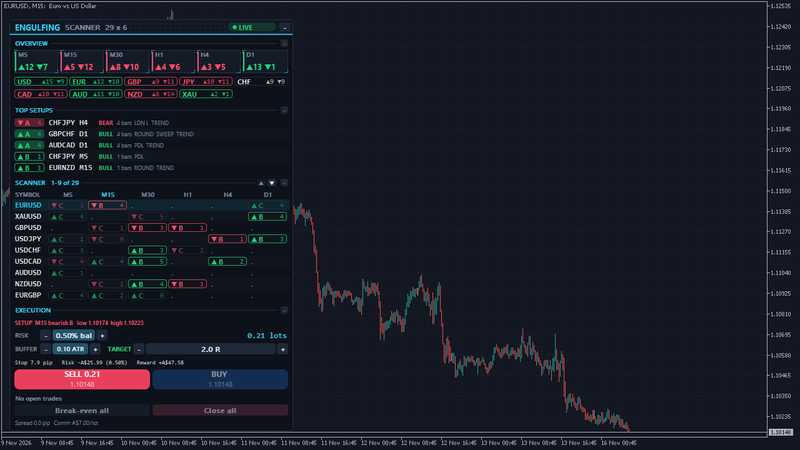
The header shows ENGULFING SCANNER with the number of symbols and timeframes, for example 29 x 6, the status pill and a minus button. The pill reads LIVE when every series is scanned, SCAN with a count while history loads, and TESTER in the Strategy Tester. Drag the header to move the panel. The minus minimises the panel to a bar that keeps the count of A and B setups, for example "ENGULFING 3 A 38 B".
The overview
The first section, OVERVIEW, has two rows:
- One tile per timeframe with the number of fresh bullish and bearish engulfings across all symbols. The tile turns green when bullish patterns lead and red when bearish patterns lead.
- One badge per currency. A bullish engulfing on EURUSD counts bullish for EUR and bearish for USD, and the other way round for a bearish one, so you see which currencies are turning across the board. Gold counts as XAU. Hover a badge for the counts per timeframe.
Folded, the section keeps one line with the total number of fresh patterns.
Top setups
The second section, TOP SETUPS, lists the best fresh patterns, five by default: A grades first, then B and C, and within a grade the newest candle first. Each row shows the grade badge, the symbol and timeframe, BULL or BEAR, the age in bars and short tags for what passed: the key level (PDH, PDL, PWH, PWL, TKY H, TKY L, LDN H, LDN L, NY H, NY L or ROUND), SWEEP and TREND. Click a row to open that setup on the chart. Folded, the section keeps the best setup on one line.
The scanner grid
The third section, SCANNER, is the grid. The chart symbol sits on the first row and the chart timeframe is highlighted. A cell shows the newest fresh engulfing on that symbol and timeframe:
- An up or down arrow for bullish or bearish, the grade A, B or C, and the age in closed bars (0 means the last closed bar).
- An A cell is filled, a B cell is outlined, and a C cell is outlined in a faded colour, so the A grades stand out at a glance.
- A dot means no engulfing within the freshness window (the last 6 closed bars by default: ages 0 to 5). Three dots mean the history is loading, "short" means there is not enough history yet, and "n/a" means the broker has no data for that symbol.
Hover a cell for the full check list behind its grade: each check with its points, the level and its price, the swing that was swept, the higher timeframe close against its EMA, the body size in ATR, the session and any release nearby. Click a cell to switch the chart to that symbol and timeframe, with the pattern marked. Click a symbol name to switch the chart's symbol, or a timeframe heading to switch its timeframe. With more symbols than fit, scroll with the up and down chips on the section title, or with the mouse wheel on MT5.
The context grade A, B, C
Each check adds points, and the grade comes from the total:
- Key level, 2 points: a prior day or prior week high or low, the last completed Tokyo, London or New York session high or low, or a round number lies in the pattern's wick zone, within 0.25 x ATR(14). For a bullish pattern the zone runs from the lower of the two lows up to the lower of the two bodies; for a bearish pattern from the higher of the two bodies up to the higher of the two highs. When several levels qualify, the one nearest the pattern's extreme is shown.
- Liquidity sweep, 1 point: the pattern or the bar before it wicked through the latest confirmed swing low (bullish) or swing high (bearish) and closed back inside. A swing needs 5 bars on its left and 3 on its right to be confirmed.
- Trend, 1 point: on the next higher timeframe, the last bar that had closed when the engulfing closed is on the pattern's side of its EMA 50. The pairs are M5 to M15, M15 to H1, M30 and H1 to H4, H4 to D1 and D1 to W1.
- Size, 1 point: the engulfing body is at least one ATR(14).
- Session, 1 point, below H4 only: the engulfing candle formed while London (08:00 to 16:30 London time) or New York (08:00 to 17:00 New York time) was open, each with its own daylight saving.
- High-impact news: no point, but a gate. A release for either currency from 30 minutes before the pattern's first candle to 30 minutes after the engulfing candle closed keeps it from an A. This is checked below H4.
An A needs 5 of 6 points, a key level and no news nearby. A B needs 3 points. Everything else is a C. On H4 and above the session is not counted, so the maximum is 5 and both thresholds are one point lower: 4 for an A, 2 for a B. The thresholds are inputs.
Some details worth knowing:
- Session levels are those in force when the pattern started: the latest completed Tokyo, London and New York sessions, skipping a session while it is running again. Session times follow Tokyo, London and New York local time, converted to the server clock, whose offset is detected from the live server time.
- Prior day and week come from the broker's own D1 and W1 bars.
- Round numbers are every 50 pips below H4 and every 100 pips on H4 and above. On symbols without pips, such as gold quoted with two decimals or indices, the step is about 0.4% of the price below H4 and about 1% on H4 and above, in round steps: on XAUUSD near 4,050 that is every 25 dollars below H4 and every 50 dollars on H4 and above. You can set your own step in pips.
- ATR is a simple average of true range over 14 bars up to the candle before the engulfing, as in MT5.
Chart marks
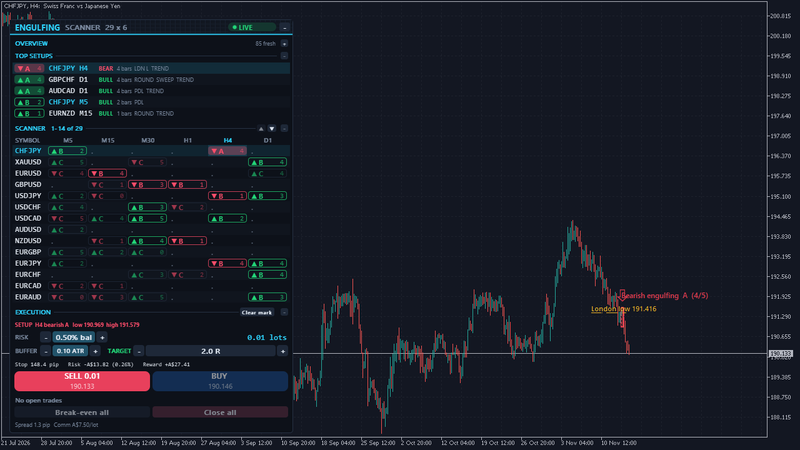
A click on a cell or a top setup marks the pattern on the chart: a box over the two candles, an arrow, a label such as "Bearish engulfing A (4/5)", a dashed line at the key level with its name and price, and a dotted line at the swing that was swept. The Clear mark chip on the execution title removes them. By default the click switches this chart, and the scanner moves with it, keeping its settings. The input "Click on a cell" can open a new chart instead, or do nothing.
The execution section
The fourth section, EXECUTION, trades the chart symbol from its selected setup.
- SETUP: the pattern the buttons use, with its timeframe, direction, grade, low and high. It is the cell you clicked on this symbol; without a click, the pattern on the chart timeframe; otherwise the best grade, then the newest, among this symbol's cells.
- RISK: minus, value and plus. Click the value to switch between % of balance, a money amount and fixed lots. The lot size on the right is worked out from the stop and the commission, and rounded down to the broker's lot step.
- BUFFER: extra room beyond the pattern for the stop, 0.10 x ATR(14) of the setup's timeframe by default, or in pips. Click the value to switch the unit.
- TARGET: take profit as a multiple of the stop distance, 2.0 R by default. 0 means no take profit.
- Readout: the stop distance, the money at risk including commission with its share of the balance, and the reward.
- SELL and BUY: one click sends a market order with the stop and target attached. A buy's stop goes below the lower of the two lows minus the buffer, a sell's stop above the higher of the two highs plus the buffer. The target is measured from the fill.
- Open trades: up to three rows of your trades on the symbol, each with its profit and a BE (break-even) and X (close) button. More trades show as "+n more".
- Break-even all and Close all. Close all asks once more: the first click arms it ("Click again to close"), and a second click within three seconds closes.
- Footer: the spread now and the commission per lot round turn, measured from your own closed trades or typed in the inputs. "not found" means there were none to measure: set it in the inputs so the lot size includes it.
Some details worth knowing:
- If price is already past the setup's stop, or the stop would sit closer than twice the spread or the broker's minimum distance, the panel does not send the order and says why in plain words.
- If the minimum lot would risk more than your setting, the panel shows what the minimum lot would risk and does not size up by itself.
- Break-even moves the stop to the entry plus 0.2 pip (an input), only when that tightens the stop and price is far enough from it for the broker to accept.
- Every order carries a request tag. If the server is slow to answer, the panel looks for the order before it could ever send it again, so one click never opens two trades.
- Break-even and close act on the panel's own orders (its magic number) and, by default, on manual trades of the chart symbol. Trades of other Expert Advisors are left alone.
Folded, the section keeps one summary line, and the panel folds it by itself on a small chart.
Alerts
An alert fires when a new engulfing closes on a timeframe you chose (M15, M30, H1 and H4 by default) with a grade you chose: A only by default, or A and B, or every fresh engulfing. Patterns already on the chart when the scanner starts do not alert. A message reads like "EngulfingScanner: GBPUSD H1: bearish engulfing, grade A (London low, liquidity sweep, H4 trend down)".
Each alert can go out as a popup, a sound, a push notification to your phone and an email. When more than three arrive at once, push and email combine them into one message, since MetaTrader limits push notifications. Push needs your MetaQuotes ID in Tools, Options, Notifications, and email needs the mail settings in Tools, Options, Email. For Telegram and Discord alerts, switch on "Send to DuoFX Alert Relay" in the inputs and run the free DuoFX Alert Relay in the same terminal.
News on MT5 and MT4
On MT5, EngulfingScanner reads the terminal's economic calendar at high importance for the currencies of each symbol. MT4 has no economic calendar, so it uses bundled US and euro area release dates, built from the official schedules and running to 31 December 2027, and checks news for USD and EUR only. For other currencies the tooltip says there is no data, and the news check does not hold the pattern back. After the bundled calendar ends, the tooltip says so. In the Strategy Tester the calendar cannot be read and the tooltip says that too.
Panel size, folding and themes
Each section folds to one summary line with the minus on its title, and the panel minimises to a bar. On a small chart the panel shows fewer scanner rows and scrolls, and folds sections by itself before it covers the chart; a section you open by hand stays open. The theme follows your chart's background, dark or light, or you can set it in the inputs.
The panel is light on the terminal: each symbol and timeframe is read again only when a new bar opens on it, the levels are cached per symbol, and only changed cells are redrawn, so the panel does not flicker.
Settings
- Scanner: symbols, prefix and suffix, always scan the chart symbol, timeframes, how many closed bars a pattern stays fresh (5 by default), click action.
- Engulfing definition: opposite colour, full range, minimum body in ATR.
- Context grade: level tolerance in ATR, round number step, swing bars before and after, sweep bars, trend EMA, size in ATR, news window before and after, points for A and B, number of top setups.
- Execution: show the section, risk mode and value, buffer unit and size, target in R, maximum lots per order, commission, break-even offset, manual trades in scope, magic number, comment, slippage.
- Alerts: on or off, grades, timeframes, popup, sound and file, push, email, DuoFX Alert Relay.
- Panel: corner, offsets, theme, fonts, font size, scanner rows kept visible, start minimised.
FAQ
- Does it trade by itself? No. Orders are sent only when you click Buy or Sell.
- Does it repaint? No. Patterns are found on closed bars only, and every check uses data fixed when the candle closed: the levels in force at the pattern's first bar, the higher timeframe bar closed by then and the sweep up to the engulfing bar. A grade does not drift later.
- Why is a cell old by a few bars? The cell shows the newest fresh engulfing within the freshness window. An age of 3 means three closed bars have formed since the engulfing candle closed.
- Why is an engulfing at a level only a B? A key level gives 2 of the 3 points a B needs. An A also needs the sweep, the trend, the size or the session to agree, and no release nearby.
- Can I scan indices, metals or crypto? Yes, any symbol your broker offers, up to 40. Round numbers use a share of the price on symbols without pips.
- Does it work in the Strategy Tester? Yes, in visual mode with the panel and its buttons. The tester can only read the tested symbol, so the scanner shows that symbol alone there.
- Is the money at risk exact? It uses the symbol's current tick value and your commission. A stop can fill further away in gaps and fast markets, so the loss can be larger than the readout.
- Does it have trailing stops or partial closes? No. It is a scanner with a small execution section: risk sizing, Buy and Sell, break-even and close.
Risk note: trading forex and CFDs carries a high risk of loss, and markets can move fast around releases and at the open. EngulfingScanner is a tool for information and order entry: it shows where the patterns and their context are, and the decision stays yours. It is not financial advice and does not promise any result.