
An engulfing candle is one of the first price action patterns most traders learn, and one of the most common on any chart. That is the point to start from: on a busy watch list, dozens of engulfings close every hour. The ones worth a closer look are the ones that form where other traders have orders waiting, after those orders have been taken, and in the direction the larger timeframe is already moving. This article walks through those questions in order, then shows worked examples with the A, B and C grades from EngulfingScanner (user guide), and ends with stop and target placement. The ideas work with any charting setup.
Why location comes first
An engulfing candle says one thing: within two candles, one side took control. A bullish engulfing opens at or below the prior close and closes at or above the prior open, so buyers absorbed the whole of the previous candle's selling and more.
Where that happens changes what it means. In the middle of a range, buyers taking over for one candle is ordinary noise. At the prior day's low, the same candle says the level was tested, sellers could not push through it, and buyers answered. Traders who sold the break are now holding a losing position with stops just below, and traders who wanted to buy the level have their reason. Both groups act on the same price, which is why levels matter more than the candle shape.
The levels that count
EngulfingScanner checks the levels most traders already watch:
- Prior day high and low, from the broker's daily bars. Day traders mark them every morning.
- Prior week high and low, the levels swing traders watch.
- Session highs and lows: the last completed Tokyo, London and New York sessions. A London low is where the London morning's sellers ran out, and New York often tests it.
- Round numbers: 1.3000, 1.0950, 4,050 on gold. Orders cluster there because people pick round prices for limits and stops.
A level counts when it lies in the pattern's wick zone. For a bullish engulfing that is the area from the lower of the two lows up to the lower of the two bodies, plus a tolerance of 0.25 x ATR(14) on each side. In plain words: the level must sit where the pattern's lower wicks rejected price, not somewhere above it. The key level is worth 2 of the 6 points in the grade, twice any other check.
Liquidity sweeps: who was on the other side
A sweep is a wick through a recent swing high or low that closes back inside. Below a swing low there are usually sell stops from traders who bought earlier, and sell orders from breakout traders. When price trades through the low, those orders fill. If the candle then closes back above it, the selling has been absorbed: the stops are gone and the breakout sellers are trapped.
An engulfing right after a sweep is the reversal of that move written in two candles. EngulfingScanner gives a point when the pattern or the bar before it swept the latest confirmed swing on the right side (a swing low for a bullish pattern, a swing high for a bearish one) and closed back inside. A swing is confirmed with 5 bars on its left and 3 on its right, so the scan never uses a swing that was not yet visible at the time.
Higher timeframe trend
A bullish engulfing on M15 against a falling H1 is a counter-trend trade: it can work, but the larger flow is against it. The trend check compares the next higher timeframe's last closed bar with its EMA 50: M5 is read against M15, M15 against H1, M30 and H1 against H4, H4 against D1 and D1 against W1. A bullish pattern earns the point when that close is above the EMA, a bearish one when it is below.
The check uses the higher timeframe bar that had already closed when the engulfing closed, so it shows what you could have seen at that moment, never a later bar.
Size against ATR
An engulfing candle with a body the size of the previous one is a small change of control. One with a body of a full ATR(14) or more moved as much as a typical whole candle in one direction and kept it into the close. EngulfingScanner gives a point for a body of at least 1 x ATR, and by default ignores bodies under 0.25 x ATR altogether, because a tiny candle covering a tiny candle says very little.
Session
Below H4, a candle formed while London or New York was open carries more volume behind it than one from the quiet late hours. The session check gives a point when the engulfing candle overlaps London (08:00 to 16:30 London time) or New York (08:00 to 17:00 New York time). On H4 and above every candle spans a session, so the check is not counted there.
News
A high-impact release can print a huge engulfing candle that has nothing to do with levels: it is the market repricing a number. EngulfingScanner does not add or remove points for news, but a release for either currency from 30 minutes before the pattern to 30 minutes after it keeps the pattern from an A, below H4. The tooltip names the release.
Putting it together: the grade
Level 2 points, sweep 1, trend 1, size 1, session 1: 6 points below H4, 5 on H4 and above. An A needs 5 points (4 on H4 and above) with a key level and no release nearby, a B needs 3 (2 on H4 and above), and the rest are C. The grade is a summary of the checks above; hover a cell to see which ones passed.
Worked example 1: a daily A at a round number
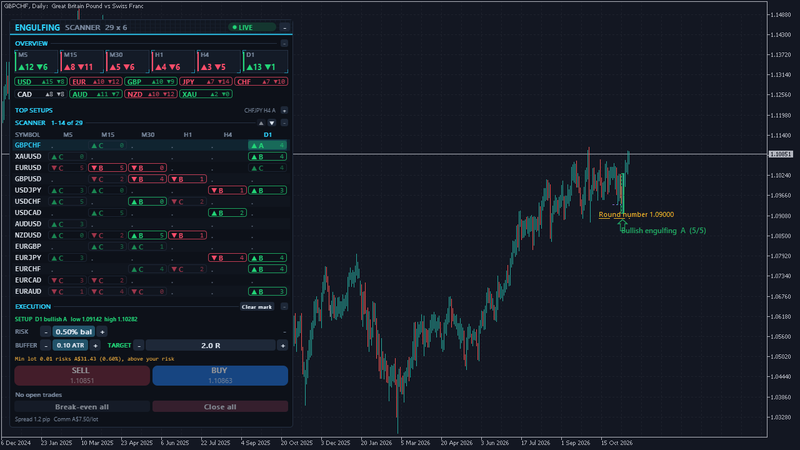
GBPCHF on D1, from the screenshots. A bullish engulfing closed with its lower wicks at 1.09142, and the round number 1.09000 sat inside the wick zone, within 0.25 ATR of the low. The pattern also swept the latest swing low and closed back above it, the weekly close was above its EMA 50, and the body was more than one daily ATR. That is 2 + 1 + 1 + 1 = 5 of 5 points on D1: an A.
Read as a story: price dipped under a recent low into a big figure, took the stops resting there, and the next day buyers covered the whole previous body, in the direction the weekly chart was already going.
The scanner marks it on the chart with a box over the two candles, the label "Bullish engulfing A (5/5)" and a dashed line at Round number 1.09000.
Worked example 2: an H4 A at a session low
CHFJPY on H4: a bearish engulfing whose upper wicks reached the last London low at 191.416. Price had fallen through that low earlier and came back up to test it from below; the engulfing rejected it. The D1 close was below its EMA 50 and the body was at least one ATR. That is 2 + 1 + 1 = 4 of 5 points, an A on H4, with no sweep.
A broken session low turning into resistance is a common pattern on its own. The engulfing adds the moment when sellers took control right at it.
Worked example 3: a level alone is a B
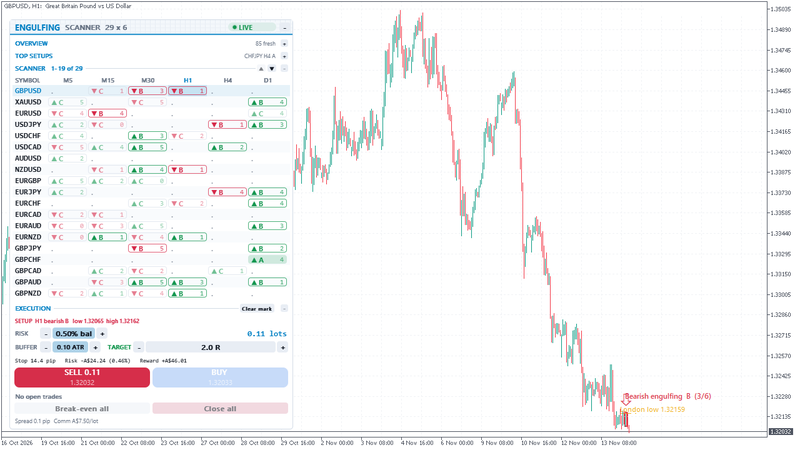
GBPUSD on H1: a bearish engulfing with its high at 1.32162, right at the London low of 1.32159. The level is there, but only one other check passed, for 3 of 6 points: a B. This is a common case. A pattern at a level is worth a look; it becomes an A only when more of the context agrees, for example the H4 trend also down and a sweep of the latest swing high.
The C grades are not wrong, they are ordinary: an engulfing in open space, against the higher timeframe, in the quiet hours. They are the background the A and B grades stand out from, which is why the alerts start with A grades only by default.
Stops beyond the pattern
The pattern itself gives the stop. If price trades back beyond the extreme of both candles, the rejection has failed. So:
- Buy: stop below the lower of the two lows, minus a buffer.
- Sell: stop above the higher of the two highs, plus a buffer.
The buffer keeps the stop out of the noise right at the extreme, where the next small spike would take it. A share of ATR adapts the buffer to how much the market moves: EngulfingScanner uses 0.1 x ATR(14) of the setup's timeframe by default, or a fixed number of pips if you prefer.
In the GBPUSD H1 example, the pattern high was 1.32162 and 0.1 ATR added about 1.4 pips: a stop near 1.32176, about 14 pips from a sell at 1.32032. At 0.5% risk the panel sized it at 0.11 lots, with the commission included.
Targets in R
R is the stop distance. A 2R target is twice the stop distance away from the entry, so a win of 2R pays for two losses of 1R. With a 2R target, the break-even win rate before costs is 1 / 3, about 33%. With a 1R target it is 50%, and with 3R it is 25%.
Higher R targets need fewer wins but are reached less often. Many engulfing traders also look at the next level in the target's path, for example the opposite side of the prior day's range or the next round number, and take a closer target when a level stands in the way.
EngulfingScanner's target is a multiple of the stop distance, 2R by default, measured from the actual fill. The lot size follows the stop: a wide daily pattern gets a small lot and a tight M15 pattern a larger one, so the money at risk stays the same.
A gold example
XAUUSD near 4,050, H1, illustration only. A bullish engulfing forms at the prior day low of 4,012.40, with the lower of the two lows at 4,009.80 and ATR(14) on H1 at 15.00. The tolerance is 0.25 x 15.00 = 3.75, so the level qualifies.
- Stop: 4,009.80 minus a buffer of 0.1 x 15.00 = 1.50, so 4,008.30.
- Entry at the ask after the close: 4,021.50. Stop distance 13.20.
- 2R target: 4,021.50 + 26.40 = 4,047.90, just under the 4,050 round number.
- One lot of gold is usually 100 ounces, so 13.20 is US$1,320 per lot. At 0.5% of a US$10,000 account, US$50, that is 0.03 lots after rounding down. Check your broker's contract specification.
The 4,050 big figure above the target is the kind of level that can stall the move, so this is a case where a slightly closer target fits the chart.
A routine for each setup
- 1. Start from the A and B grades in the top setups, or from an alert.
- 2. Hover the cell and read which checks passed. Is the level one you would have drawn yourself?
- 3. Click it, look at the marked chart: is there room to the target before the next level?
- 4. Check the session and the calendar for the next hour.
- 5. Let the execution section place the stop beyond the pattern and size the lot from your risk.
EngulfingScanner is available for MT5 and MT4. More on engulfingscanner.com. For the definition variants, common mistakes and reading the overview by currency, see Bullish and bearish engulfing patterns: what the context tells you.
Risk note: trading forex, gold and CFDs carries a high risk of loss. The examples above are illustrations, not trade recommendations, and prices and contract sizes differ between brokers. Stops can fill further away in gaps and fast markets. Grades point you to the patterns with the most context behind them; the trade plan and the decision stay yours. Test any approach on a demo account first.