NVIDIA (NVDAm) Liquidity & Gap Analysis: Navigating Violent Momentum Expansion Around H4 Structure (12 Nov 2026)

High-beta tech stocks like NVIDIA ( NVDAm ) are famous for violent opening gaps, rapid stop-hunts, and sudden shifts in intraday momentum. When volatility spikes, retail traders often fall into the trap of chasing extended green candles right into major institutional resistance.
In this multi-timeframe technical breakdown (H1 & M15), we use LiquiditySweep Radar with News Diary to decode NVIDIA’s dramatic plunge to $148.20 , its subsequent violent rebound to $164.63 , and the exact structural triggers required for our next high-probability trade .
Indicator Reference: All liquidity sweep markers ( sb / ss ), multi-timeframe structure lines ( H4 close below structure ), momentum alerts, and session/news overlays shown in this analysis are generated automatically by LiquiditySweep Radar with News Diary for MetaTrader 5 .
1. The Macro Picture (H1): Bearish Structure & Opening Gaps
Examining the NVDAm H1 chart captured at 15:30 GMT+0 on 12 November 2026, the broader order flow has been decisively bearish since the major Buy-Side Liquidity Sweep ( sb ) near $208.57 :
-
Sequential Breakdowns: Following the initial sweep at $208.57 and confirmed retests at $196.27 and $189.74 , NVIDIA experienced repeated bearish session gaps .
-
H4 Structural Shift: Price eventually broke down and printed a critical H4 close below structure level around $165.65 , turning this zone into a major institutional supply barrier .
-
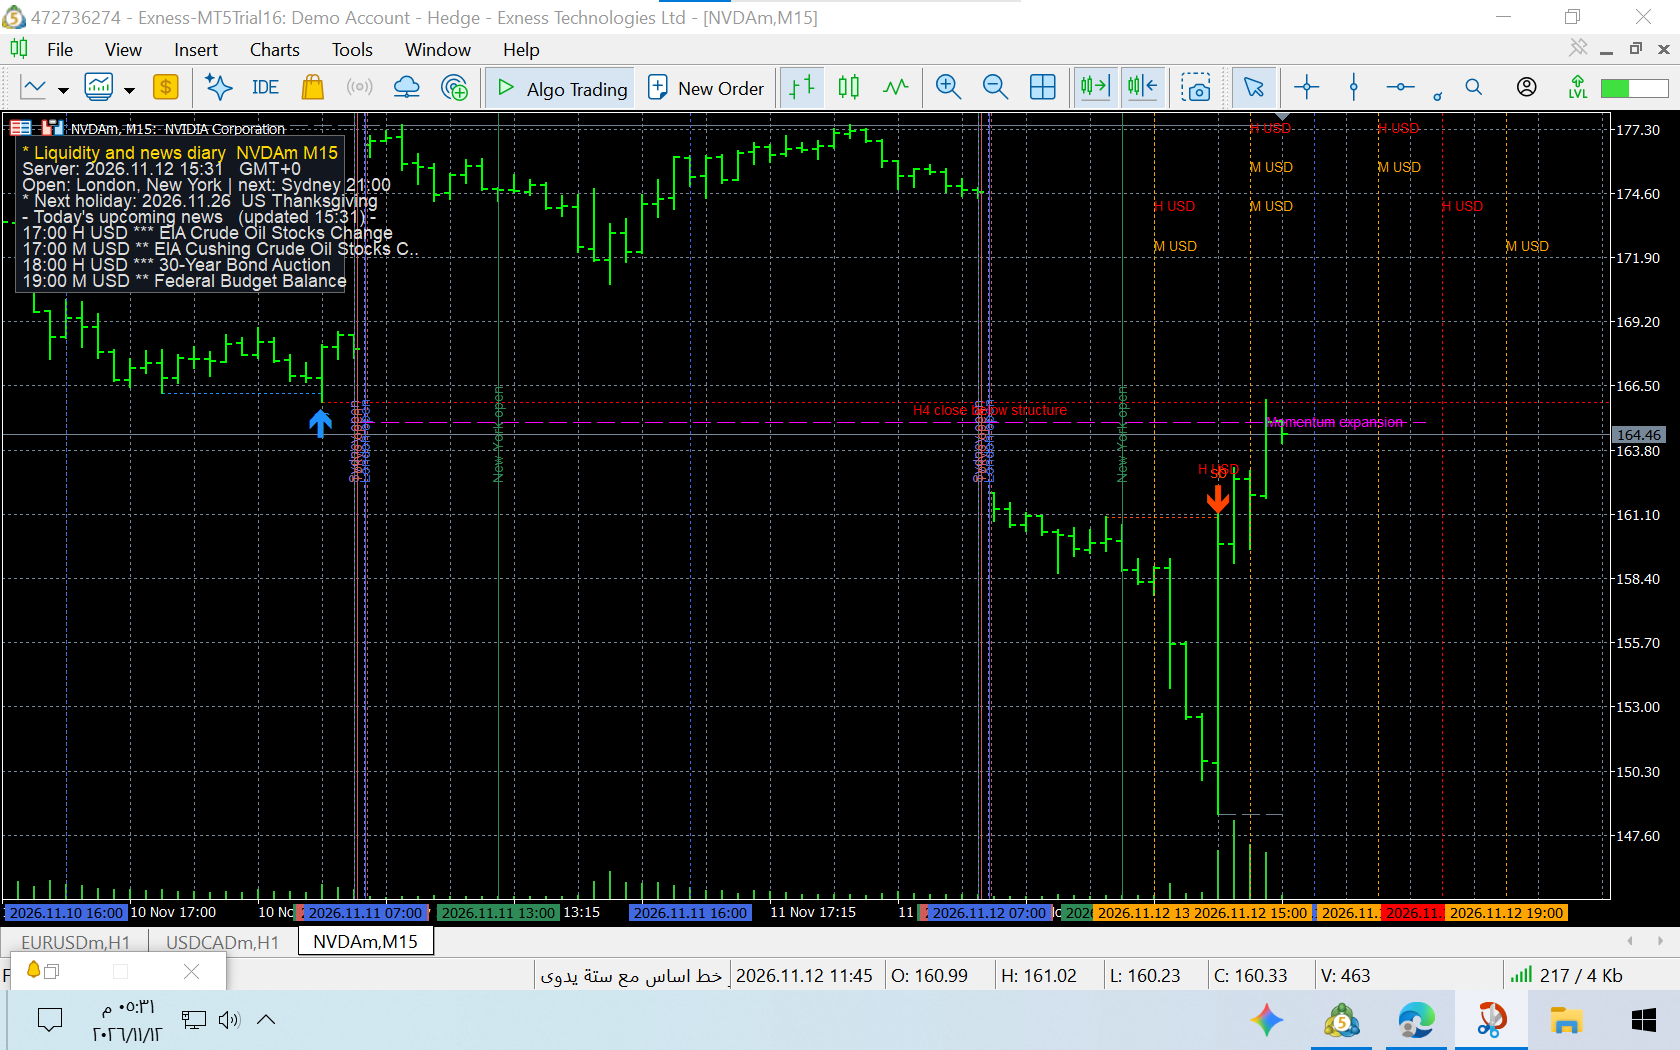
Today’s Session Shock: At the New York session open, NVDAm gapped down below $162.00 , plunged sharply to sweep deep liquidity near $148.20 , and immediately staged a massive V-shaped recovery back to $164.63 —parking right underneath the H4 structural ceiling .
2. Intraday Precision (M15): Decoding the "Momentum Expansion"
Zooming into the M15 timeframe reveals the exact mechanics behind today's wild price swing :
-
The Intraday Trap ( sb at $161.10 ): Early in the session, price swept a local high near $161.10 , printing a red sb arrow right before flushing down over 12 dollars to $148.20 .
-
Violent Reversal ( Momentum expansion ): Once sell-side stops below $150.00 were absorbed, institutional buyers stepped in aggressively. The indicator flagged this vertical surge as Momentum expansion , driving price straight back through $161.10 to $164.46 .
3. Actionable Trade Plan: Why Patience at $164.50–$166.00 is Critical
Buying right now at $164.63 means buying after a 16-dollar vertical rally directly into a multi-timeframe resistance wall ( H4 close below structure + unfilled gap edge) . Conversely, shorting blindly against strong upward momentum without a confirmed sweep is equally dangerous.
Here is the rules-based execution plan waiting for closed-candle confirmation:
| Trade Scenario | Structural Trigger & Indicator Confirmation | Entry & Risk Management |
| Current State | Price at $164.46–$164.63 , testing H4 structure ( $165.65 ) | Stand Aside / Wait (Do not chase the vertical spike) |
| Scenario A: Bearish Rejection (Sell Setup) | Price sweeps above $165.65–$166.50 , prints a fresh red sb arrow, followed by bearish displacement and a Retest | Sell on retest; Stop Loss above sweep high ( ~$167.50 ); Targets: $158.00 & $150.00 |
| Scenario B: Gap-Fill Continuation (Buy Setup) | H1 candle closes decisively above $166.50 , followed by a clean pullback and indicator Retest confirmation at $164.50–$165.65 | Buy on support retest; Stop Loss below $162.50 ; Target: Gap fill at $174.50 |
4. Macro & Session Context (Built-In News Diary)
Even when trading US equities like NVIDIA, macro liquidity catalysts drive intraday volatility. According to the indicator’s live News Diary (updated at 15:31 GMT+0), traders must watch upcoming US releases :
-
17:00 GMT+0 ( H USD): EIA Crude Oil Stocks Change
-
18:00 GMT+0 ( H USD): 30-Year Bond Auction (critical for US yields and tech stock valuations)
-
19:00 GMT+0 ( M USD): Federal Budget Balance
Yield fluctuations around the 18:00 GMT+0 30-Year Bond Auction frequently trigger fakeouts on NASDAQ leaders like NVDA—making a non-repainting sweep and retest filter essential .
Conclusion
In fast-moving markets like NVIDIA, structure and confirmation separate disciplined execution from emotional chasing. Let price interact with the $165.65 H4 structural level first, and wait for the Sweep $\rightarrow$ Displacement $\rightarrow$ Retest sequence to confirm the true institutional direction .
Get full access to automated liquidity sweep detection, H4 structure mapping, and MQL5 Expert Advisor buffers on the official product page:
👉 LiquiditySweep Radar with News Diary on MQL5




