
This article is for informational and educational purposes only. It does not constitute financial advice or an investment recommendation. Trading in financial markets carries a high risk of loss.
Introduction
Support and resistance are usually drawn as a single horizontal line at an exact price. The market rarely respects that precision. Price reacts a few pips above the line one day and a few pips below it the next, and each of those small overshoots looks like a breakout that then fails. Drawing the level as a zone solves most of these problems.
This article is divided into three sections. The first explains why price reacts to areas rather than exact prices. The second shows how to draw a zone and decide its width, with a step-by-step example. The third covers how to judge which zones matter and how to use them in MetaTrader 5.
1. Why a zone works better than a line
Orders are spread across an area
A support or resistance level exists because many participants placed orders around a price: entries, take profits, stops. Those orders are never all at the same price. Some traders sell a little earlier, others wait for a better price, and spreads differ between brokers. The result is an area where supply or demand is concentrated, not a single value.
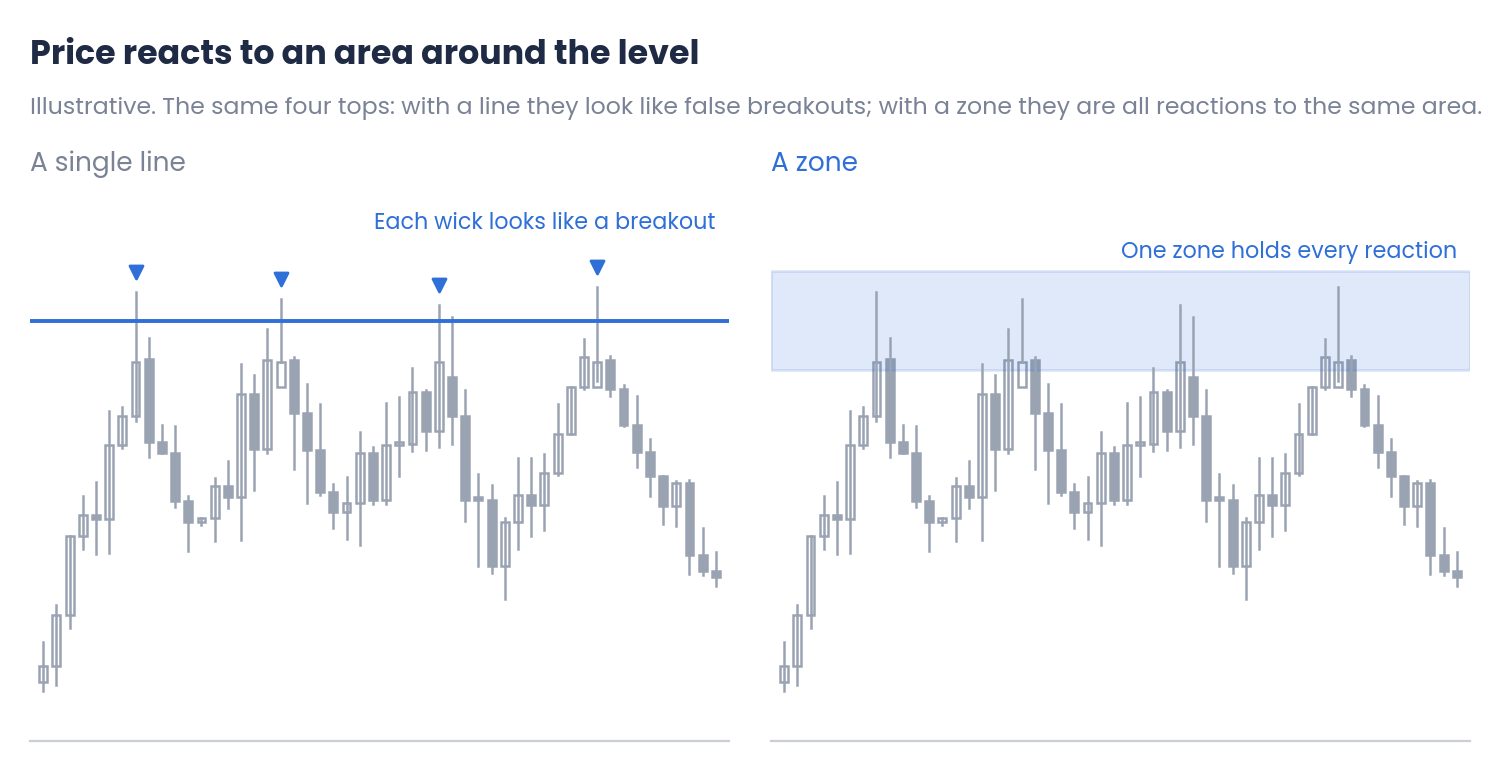
Figure 1. The same four tops seen with a line and with a zone (illustrative)
With a line, each top that goes slightly above it looks like a breakout, and each one that stops slightly below it looks like the level was not reached. With a zone, all four are simply reactions to the same area.
Fewer false signals
A zone changes the question from "has price touched the line?" to "has price entered the area, and how does it behave there?". A breakout becomes meaningful only when price closes clearly beyond the zone. A wick a few pips past a line is no longer enough.
2. How to draw a zone
From the bodies to the wicks
A practical way to define a zone is to look at the candles where price reacted. The bodies show where the market closed, and the wicks show how far it was pushed before being rejected.
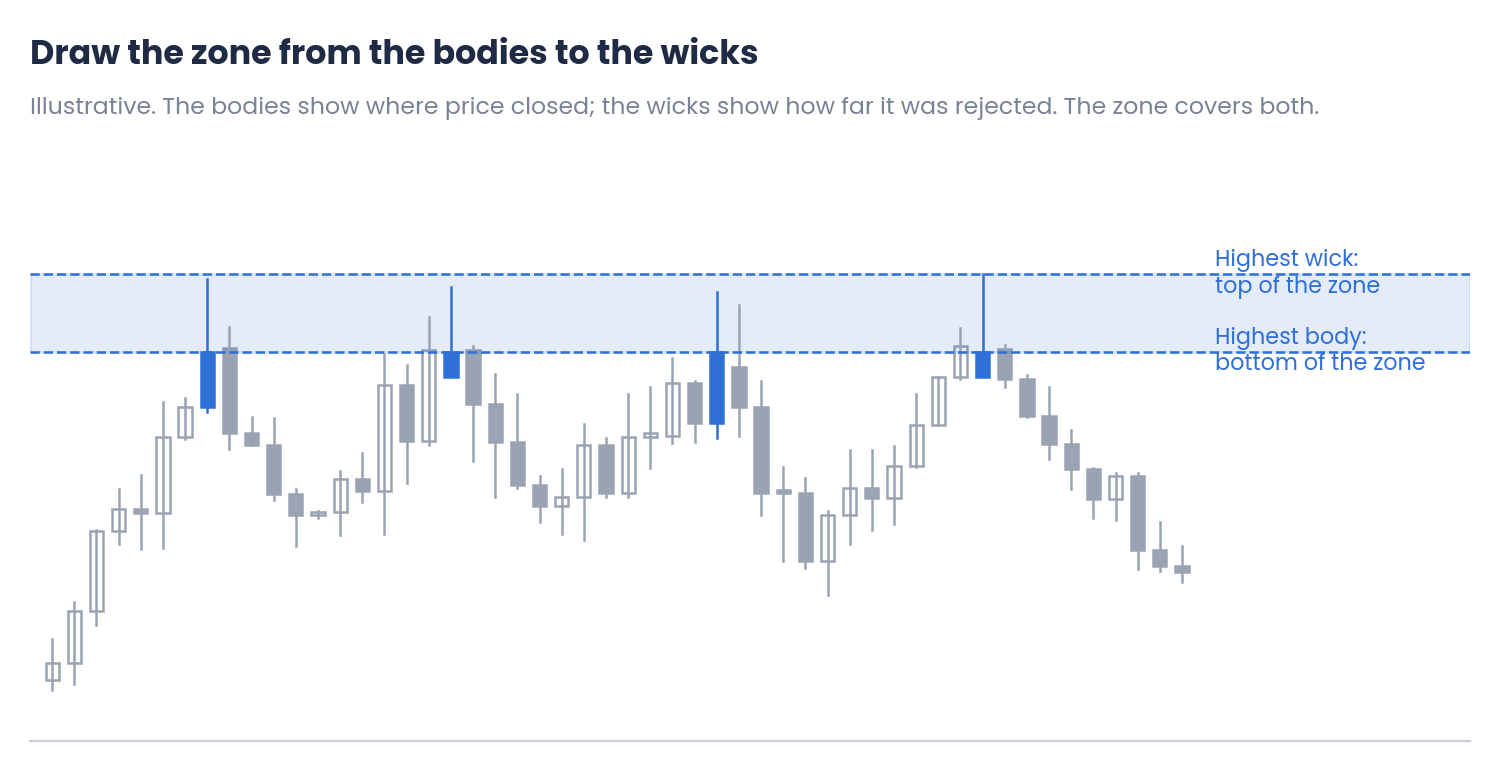
Figure 2. A resistance zone drawn from the highest body to the highest wick (illustrative)
For a resistance zone, the bottom is the highest body among the reaction candles and the top is the highest wick. For a support zone, it is the reverse: the top is the lowest body and the bottom is the lowest wick.
Checking the width with the ATR
A zone should be wide enough to contain the normal reactions and narrow enough to be useful. Comparing its width with the ATR of the same timeframe is a simple check:
Zone width in ATR = (Top of the zone − Bottom of the zone) ÷ ATR
As a reference, zones between about 0.3 and 1 ATR are usually practical. A much narrower zone behaves like a line; a much wider one is often two different levels drawn as one. (Indicative range.) How the ATR is calculated in MT5 is covered in the article on ATR volatility.
Step-by-step example
Suppose EURUSD on H4 has reacted three times at the same resistance area.
| Step | Calculation | Result |
|---|---|---|
| 1. Highest wick of the reactions | 1.0912, 1.0918, 1.0905 | Top: 1.0918 |
| 2. Highest body of the reactions | 1.0896, 1.0899, 1.0894 | Bottom: 1.0899 |
| 3. Width of the zone | 1.0918 − 1.0899 | 19 pips |
| 4. Width in ATR | 19 ÷ 30 (ATR of H4) | 0.63 ATR: practical |
| 5. Stop for a short trade | 1.0918 + 0.25 × 30 pips | About 1.0926 |
Illustrative values. The ATR and the reaction prices depend on the broker and the period.
The zone also tells you where the stop should not go: inside it, where normal reactions happen. Placing the stop beyond the zone with a small volatility margin is the same idea explained in the article on where to place a stop loss.
3. Which zones matter and how to use them
Judging a zone
- Strength of the reaction: a zone where price turned sharply, with large candles leaving it, matters more than one where it drifted away slowly.
- Timeframe: zones visible on the daily or weekly chart usually carry more weight than those that only appear on M15.
- Recency: a zone that worked last month is more relevant than one from several years ago that price has not visited since.
- Number of tests: each test uses up part of the orders resting in the zone. After several tests, a zone is more likely to break than to hold.
When a zone breaks
A broken zone does not disappear. Traders who sold at resistance and were caught by the breakout, and those who missed it, often act when price returns to the same area. As a result, old resistance frequently acts as support, and old support as resistance.
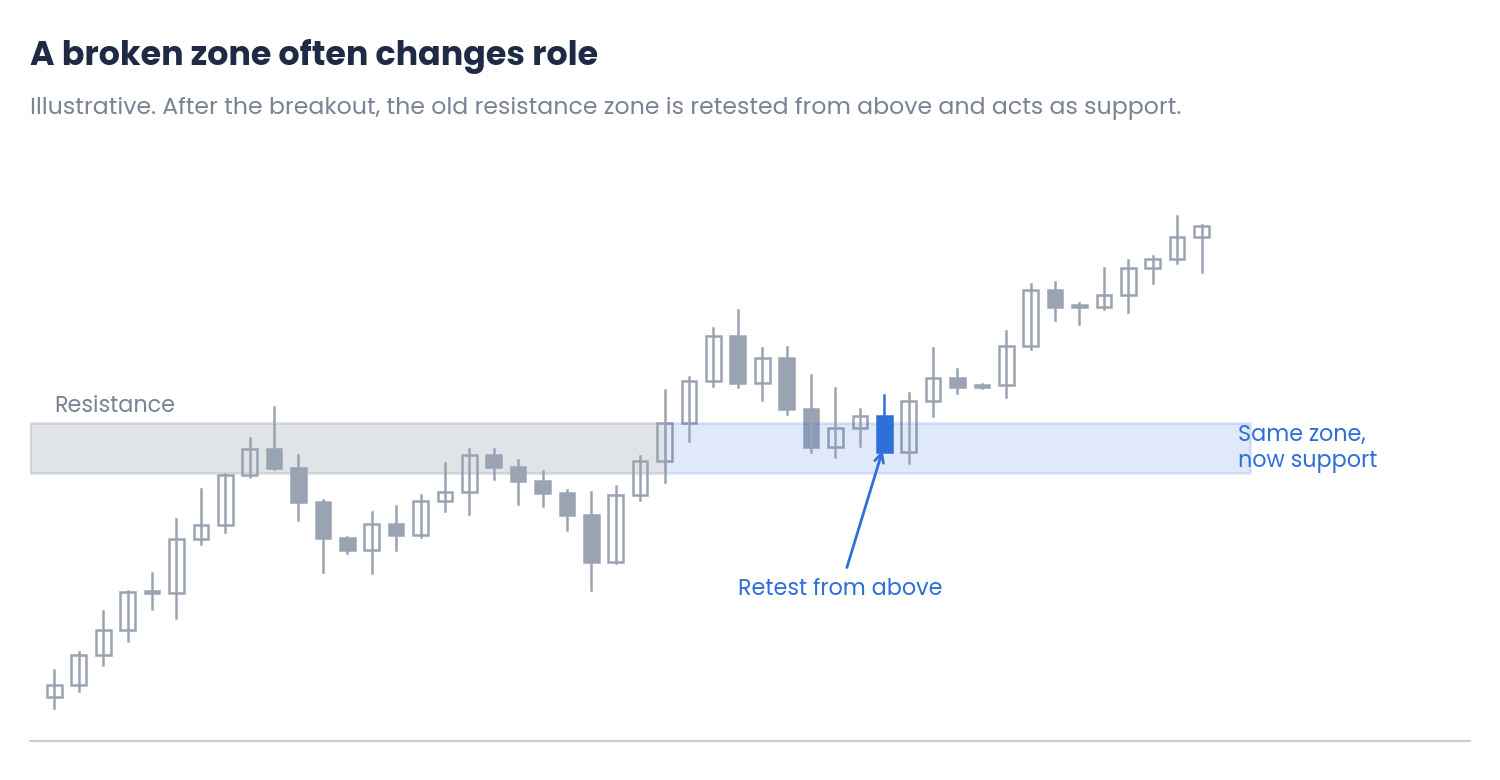
Figure 3. A resistance zone that becomes support after the breakout (illustrative)
Zones in MT5
- Rectangle object: the natural way to draw a zone. Set its right edge some time into the future, or move it forward as new candles form, so that it stays next to the current price.
- Fill and background: a filled rectangle drawn as background keeps the candles visible over it.
- Visibility by timeframe: a zone from the weekly chart can be shown on all timeframes; one from M15 is better kept to the lower timeframes so it does not clutter the daily chart.
- Review: delete zones that have been clearly broken and not retested. The article on clean charts in MT5 explains why old levels distort the reading.
Common mistakes
- Drawing every level as a thin line. Small overshoots then look like breakouts.
- Zones that are too wide. If almost every candle is inside the zone, it is not telling you anything.
- Placing the stop inside the zone. That is where normal reactions happen.
- Trusting a zone that has been tested many times. Each test weakens it.
- Keeping broken zones forever. Keep them only while price is likely to return to them.
Conclusions
- Why zones work better: orders are spread across an area, so price reacts to zones rather than exact prices. A zone avoids false breakouts and focuses on how price behaves inside it.
- How to draw them: from the bodies to the wicks of the reaction candles, with a width of roughly 0.3 to 1 ATR. Stops go beyond the zone, with a small volatility margin.
- Which zones matter: strong reactions, higher timeframes, recent zones and few tests. Broken zones often change role. In MT5, draw them as filled rectangles and review them regularly.
Thinking in zones makes support and resistance closer to how the market actually works. Test any approach with your own data on demo or in the Strategy Tester, and combine it with disciplined risk management.
Disclaimer
This content is for informational and educational purposes only. It does not constitute financial advice or a recommendation to buy or sell any instrument. Support and resistance zones describe past price behaviour and are not a forecast. The charts and examples are illustrative, and every asset and every broker is different. Trading forex, CFDs and other leveraged products carries a high risk of loss. Every trading decision, and its outcome, is the sole responsibility of the reader. The author accepts no liability for any loss arising from the use of this information.