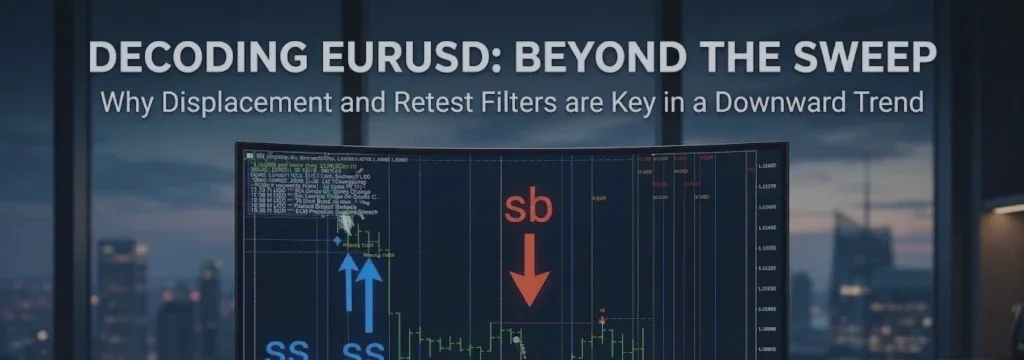
Live Market Breakdown: How Liquidity Sweeps and News Context Dictate Patience on EURUSD (12 November 2026)

In algorithmic and price-action trading, knowing when not to trade is just as profitable as knowing when to pull the trigger. Many retail traders lose capital by chasing an already-extended move or trying to catch a falling knife without structural confirmation.
In this live technical breakdown on EURUSDm (H1), we examine how LiquiditySweep Radar with News Diary maps institutional order flow, validates reversals, and keeps traders disciplined ahead of high-impact economic releases .
Tool Reference: All liquidity levels, session dividers, and economic calendar markers shown in this analysis are generated automatically by the LiquiditySweep Radar with News Diary indicator for MetaTrader 5.
1. The Anatomy of the Move: From Buy-Side Sweep ( sb ) to Breakdown
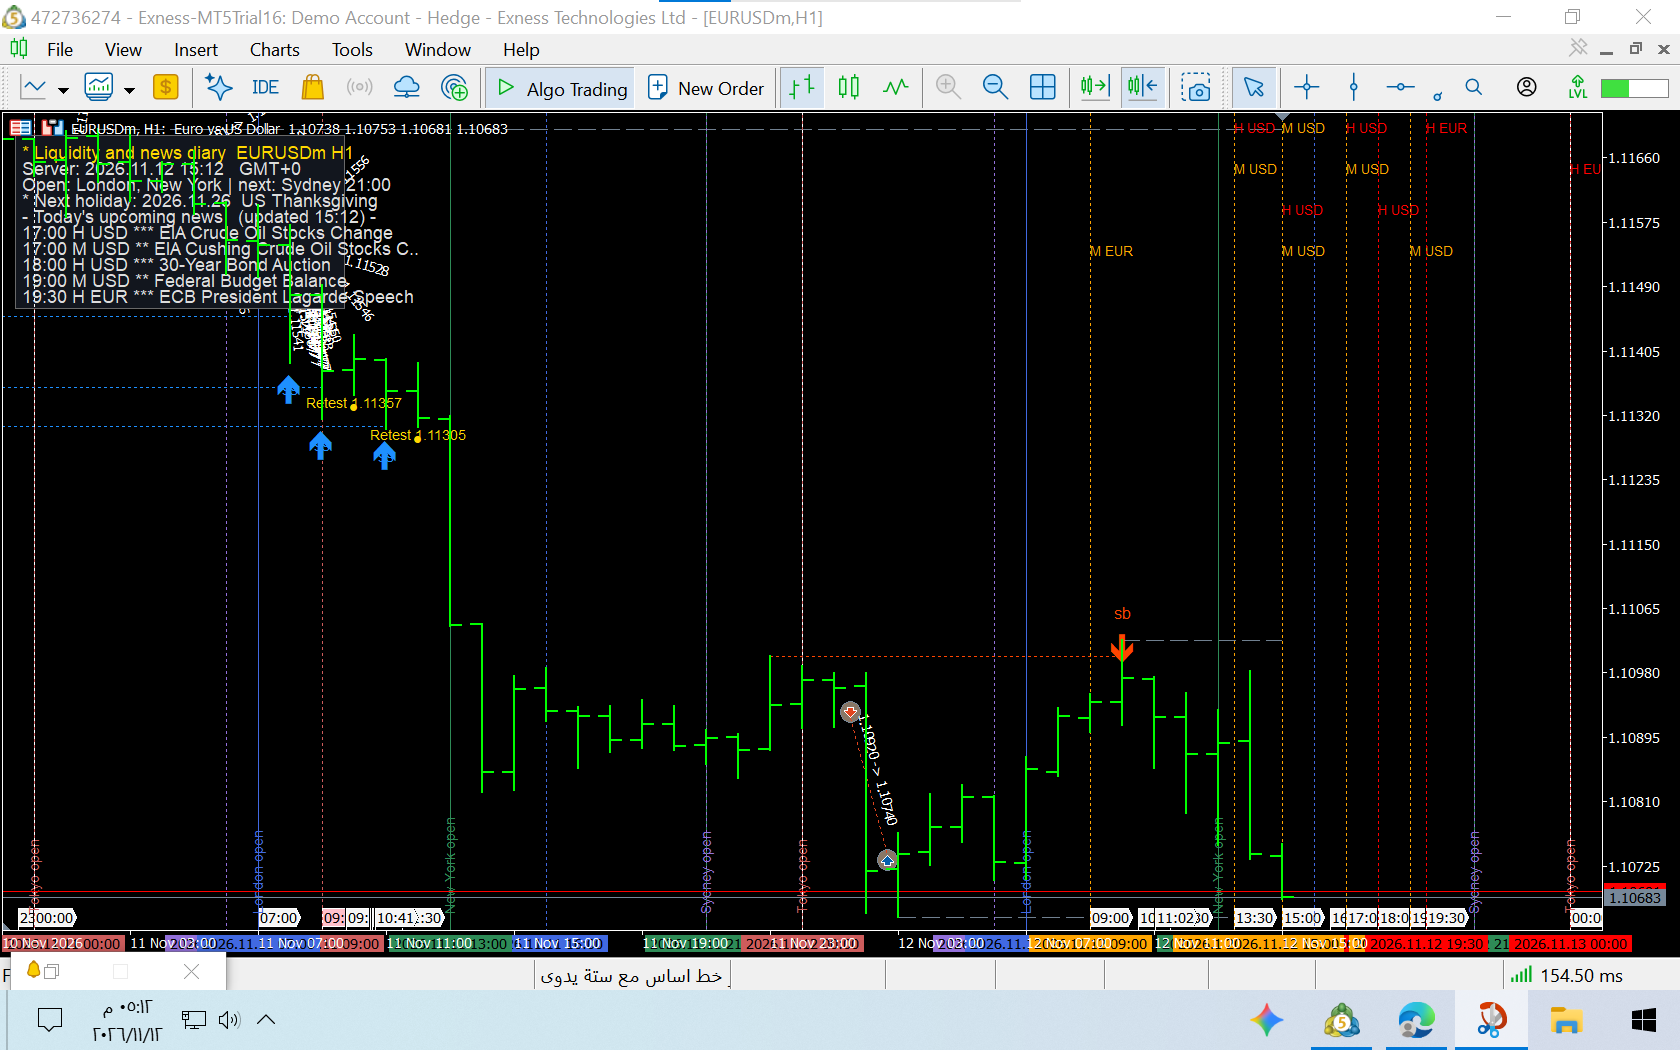
Looking at the H1 chart snapshot captured at 15:12 UTC on 12 November 2026, the market structure tells a clear sequential story :
-
The Trap ( sb — Buy-Side Liquidity Taken): Earlier in the session around 10:00 UTC, price pushed above a prior intraday swing high near 1.11002 , triggering resting buy stops and trapping breakout buyers . The indicator immediately logged this event with a red downward arrow labeled sb , signaling that buy-side liquidity had been harvested .
-
Displacement & Continuation: Instead of holding above the swept high, price closed back inside the range and displaced downward . Entering on the retest of that swept zone provided a clean, low-risk short setup targeting the opposing liquidity pools below.
-
Current State ( 1.10683 ): By 15:12 UTC, EURUSDm has driven down through the 1.10691 support floor, trading at 1.10683 .
2. Actionable Trade Recommendation: Why "Wait" is the Only Valid Signal
At the exact moment of this snapshot ( 1.10683 ), the indicator displays no active entry arrow . Here is how a systematic trader interprets this state:
| Parameter | Current Reading / Plan |
| Current Price | 1.10683 (Breaking below 1.10691 swing low) |
| Indicator State | Active bearish expansion; no confirmed Sell-Side Sweep ( ss ) yet |
| Immediate Action | Stand Aside / Wait (Do not chase shorts at the bottom; do not buy without a sweep) |
| Bullish Trigger (Buy Setup) | Wait for price to print a confirmed ss arrow below 1.10657–1.10691 , followed by a bullish displacement candle and a validated Retest |
| Bearish Trigger (Sell Setup) | Only valid if price retraces back into an untested supply zone and prints a fresh sb rejection |
Chasing a sell order after a 34-pip drop offers poor risk-to-reward, while buying prematurely exposes the account to further downside momentum. Discipline means waiting for the three-step sequence (Sweep $\rightarrow$ Displacement $\rightarrow$ Retest) to complete on a closed candle.
3. Upcoming Volatility: Reading the Built-In News Diary
Liquidity sweeps rarely happen in a vacuum; they are frequently fueled by scheduled macroeconomic catalysts. According to the indicator's on-chart News Diary (updated at 15:12 GMT+0), the New York session has several high-impact ( H ) and medium-impact ( M ) events lined up :
-
17:00 GMT+0 ( H USD): EIA Crude Oil Stocks Change
-
18:00 GMT+0 ( H USD): 30-Year Bond Auction
-
19:00 GMT+0 ( M USD): Federal Budget Balance
-
19:30 GMT+0 ( H EUR): ECB President Lagarde Speech
With President Lagarde's speech at 19:30 and US bond/oil releases starting at 17:00, liquidity around the 1.10650 psychological zone is primed for a potential stop-hunt . Traders watching the H1 and M5 timeframes should monitor how price reacts to these releases—if a sharp spike below the lows quickly snaps back and prints a confirmed ss + Retest , it will present the next high-probability long opportunity.
Conclusion
Consistent trading is built on rules rather than impulses. By combining structural liquidity sweeps with session timing and an automated economic calendar, you eliminate guesswork and let the market prove its intent before risking capital.
Explore the full indicator features, buffer documentation for Expert Advisors, and live screenshots on the official MQL5 Market page:
👉 LiquiditySweep Radar with News Diary on MQL5