On 04 November 2026, Owl Smart Levels gave signals on GBPUSD and EURUSD at 14:37 and 14:50 UTC, both by its rules. A trade by either signal would have closed at the stop-loss between 15:15 and 15:18 UTC, within 40 minutes; the Owl Smart Levels Trading System Guide shows why such signals are better skipped.
Before the EURUSD signal, price had rallied strongly with almost no pullbacks. The signal formed on a shallow pullback at the very top. Its stop was close to the entry. The guide states that such signals are better skipped.
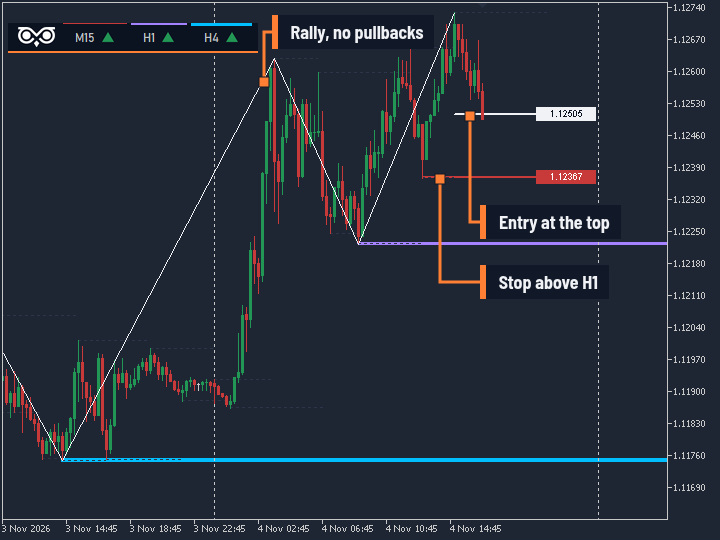 Figure 1. EURUSD, 04.11: a rally without pullbacks, the signal at the top, the stop above the H1 line.
The US ISM Services PMI came out at 15:00 UTC, shortly after both signals. With an important release due soon, the guide says these signals are better left alone. You make that call using the guide. The indicator does not make it.
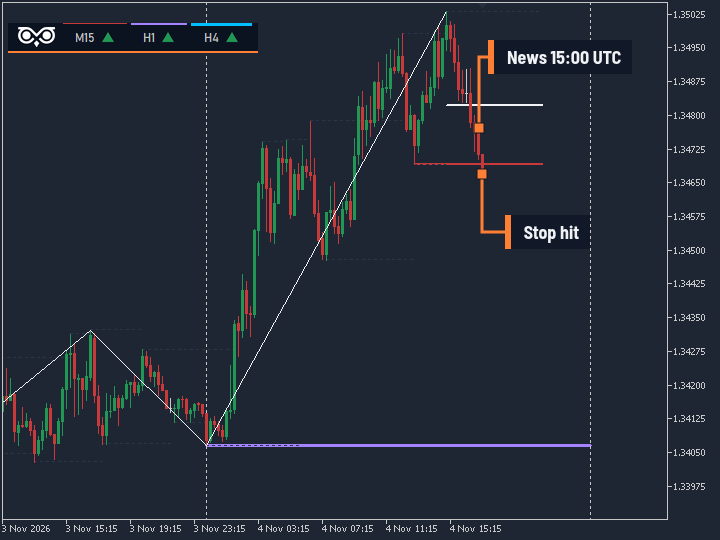 Figure 2. GBPUSD, 04.11: news release at 15:00 UTC, price reached the stop level.
The guide calls a deep pullback in the trend direction a signal worth considering. You can recognise it when the stop-loss level coincides with the purple H1 level.
The indicator always places the stop at the M15 line, which is the 15-minute chart’s level line. The H1 line marks the level from the one-hour chart. When the M15 and H1 lines coincide, the stop ends at H1, and this scheme works. In this story, the stops of both signals sat above the H1 line.
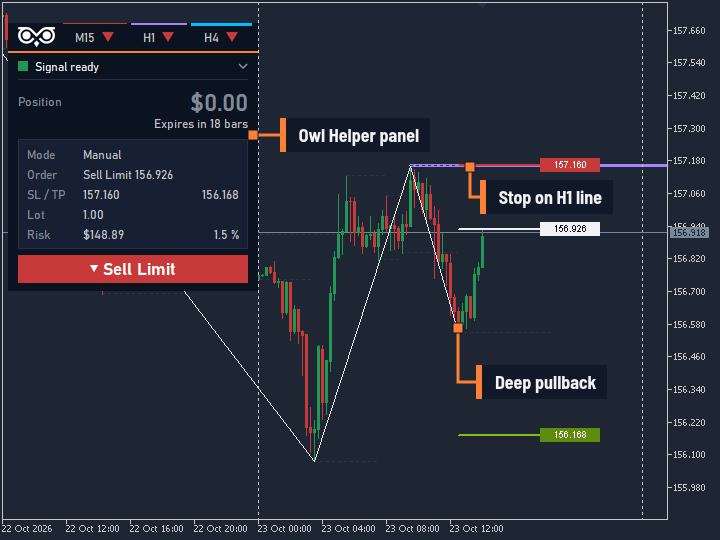 Figure 3. USDJPY, 23.10: deep pullback, stop on the H1 line (signal cancelled, TP not reached).
The indicator is half of the tool; the other half is the rules for which signals to take. These rules are in the guide, which comes in the kit with the indicator.
Owl Smart Levels shows the levels, entry, stop, target and trend on three timeframes.
To decide whether this approach fits your manual trading, open the Owl Smart Levels product page.
On the charts: the Owl Smart Levels indicator.
The kit includes:
- a detailed Strategy guide;
- the Trading System Guide (methodology) with all explanations;
- a Checklist;
- the Owl Helper Expert Advisor.
The Expert Advisor and the materials are sent by private message after purchase.