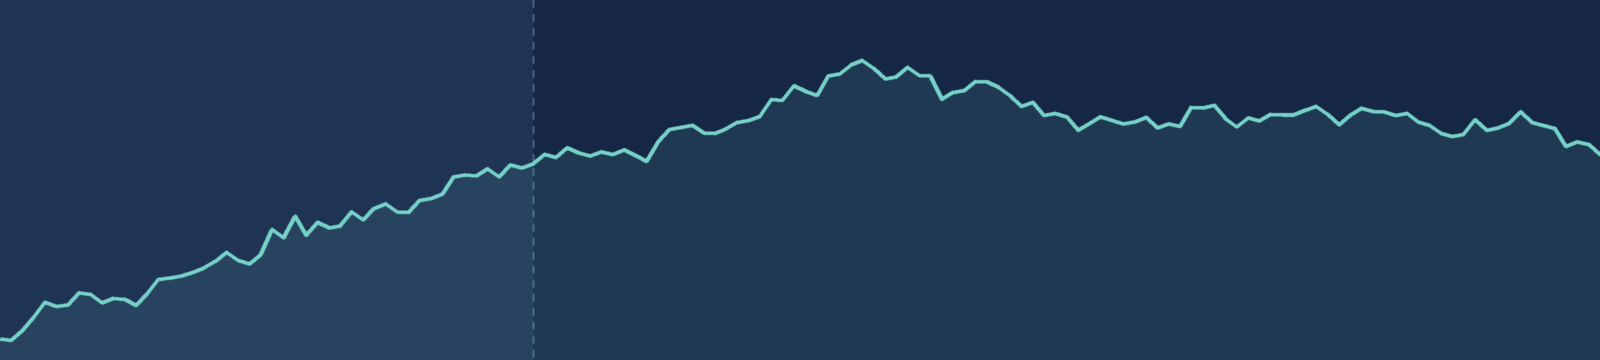
I found a strategy with PF 1.29 on 369 trades. Then I tested it properly

The winner, EMA 20/60, looked excellent: PF 1.29 on 369 trades, +66.6 R in four years. A t-statistic above 2, a bootstrap range entirely above 1. On paper, a proven edge.
Then I applied the checks I now use on every idea:
- Out of sample (2019–2022): PF 1.06 on 344 trades. Most of the edge gone.
- Holdout (2023–2026), opened once: PF 0.96 on 317 trades. A loss.
- The same 174 combinations on a purely random price series: the best one made PF 1.33. Better than my “edge”, on data with nothing to find.
- The 20/60 on 21 currency pairs: not one pair was profitable in all three periods.
The statistics weren’t wrong. They were applied to the very trades on which the combination was chosen as the best of 174. Statistical tests don’t know about the other 173 attempts, so they measure the luck of the selection, not the quality of the strategy.
Three questions I now ask of every backtest, including mine:
- How many variants were tried? A PF of 2.0 found at the first attempt is worth more than a PF of 3.0 found after 300.
- Which period was never used for any decision? If the answer is “none”, there is no out-of-sample result at all.
- Does it beat chance under the same conditions? Compare it with random entries of the same number, direction and duration, not with zero.
I’ve collected the whole method in a practical guide: pre-registration, walk-forward, parameter plateaus, bootstrap and permutation tests, how to validate a filter, a diary of my own failed ideas, and one real indicator that passed a pre-registered test. Every example uses real MT5 data, and the three Python scripts that reproduce every number are included.
Validating a Strategy Without Fooling Yourself — the first chapter is free to read on the page: https://payhip.com/b/QuTy0
Launch price €25 until 22 November.
Questions about the method are welcome in the comments.