Market Structure Signals for MT4 and MT5: How to Trade Graded CHoCH and BOS Signals with Supreme Power House

1. Introduction
Most structure traders do the same three jobs by hand on every chart. They mark the swings, decide whether the last close broke one of them, and then work out where the stop and the targets go. The first job is slow, the second is easy to get wrong when the chart is busy, and the third is where most of the mistakes are made: a stop that sits too close to a swing, or a target that was never measured against the risk.
Supreme Power House does all three jobs on closed bars and draws the result. It prints a BUY or a SELL when a candle closes beyond the last unbroken swing, grades that signal from A to C against seven checks, and draws a complete plan beside it: an entry, a stop, three targets and the zones between them. Around it sit an adaptive trend ribbon, the ICT zones of the current leg and a dashboard of six timeframes.
This guide explains the rules behind every drawing, shows how to read a signal in about ten seconds, and walks through a practical way to trade with it. The figures that explain a rule are illustrations and say so in their captions; every chart screenshot is a real MetaTrader capture of the indicator at its default settings.
2. Market Structure in One Page
A trend, in structure terms, is a sequence of swings. In an up trend each swing high is higher than the one before (HH) and each swing low is higher than the one before (HL). In a down trend the highs are lower (LH) and the lows are lower (LL). The indicator writes these four labels on every confirmed swing, so the sequence can be read without counting candles.
A swing here is a pivot: a high with no higher high within five bars on either side, or a low with no lower low within five bars on either side. The five bars to the right matter. A swing is only known five bars after it formed, and that delay is the price of a swing that never moves once it is drawn.
3. Change of Character and Break of Structure
A break happens when a candle closes beyond the last swing that has not been broken yet. A wick through the level does not count; only the close does.
The structure before the break decides its name:
- BOS (break of structure): the structure already pointed the same way. Higher highs and higher lows, then a close above the last high: the trend continues.
- CHoCH (change of character): the structure pointed the other way. Lower highs, then a close above the last high: the trend turns.
Both are drawn as a dashed line from the swing to the bar that broke it, labelled CHoCH (blue by default) or BOS (grey by default).
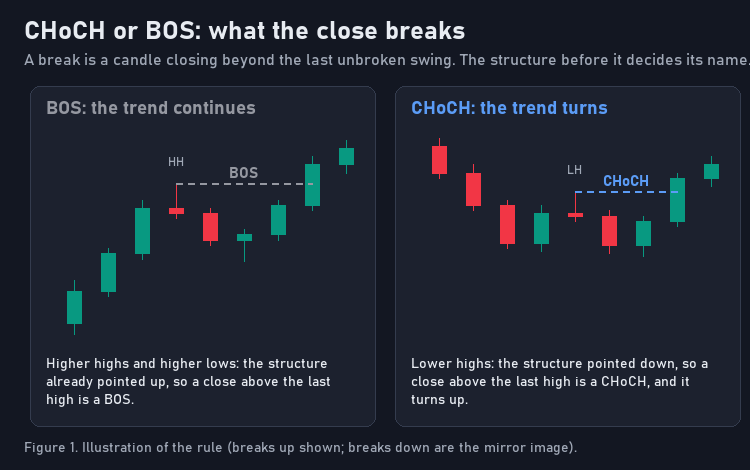
Figure 1. Illustration of the rule (breaks up shown; breaks down are the mirror image).
4. Introducing Supreme Power House
Supreme Power House is an indicator for MetaTrader 4 and MetaTrader 5. It reads the chart it is attached to and draws on that chart; it does not place trades and it has no access to your account. On every closed bar it:
- confirms the swings and labels them HH, HL, LH or LL;
- checks whether the close broke the last unbroken swing, and names the break CHoCH or BOS;
- checks the enabled filters; if they all agree, it prints a BUY or a SELL plate with a grade;
- draws the plan: entry, stop, three targets, a risk zone and one reward band per target;
- follows every open plan bar by bar, ticking each target reached and crossing a stop that is hit;
- updates the trend ribbon, the ICT zones, the trigger lines and the dashboard.
By default it prints one signal per direction: after a BUY, the next signal must be a SELL. A second bullish break in a row moves the structure on, but it does not print a second BUY.
5. Seven Checks and One Grade
Every break is measured against seven checks. A check that is switched on as a filter must agree, or the signal is not printed. A check that is switched off still counts towards the grade.
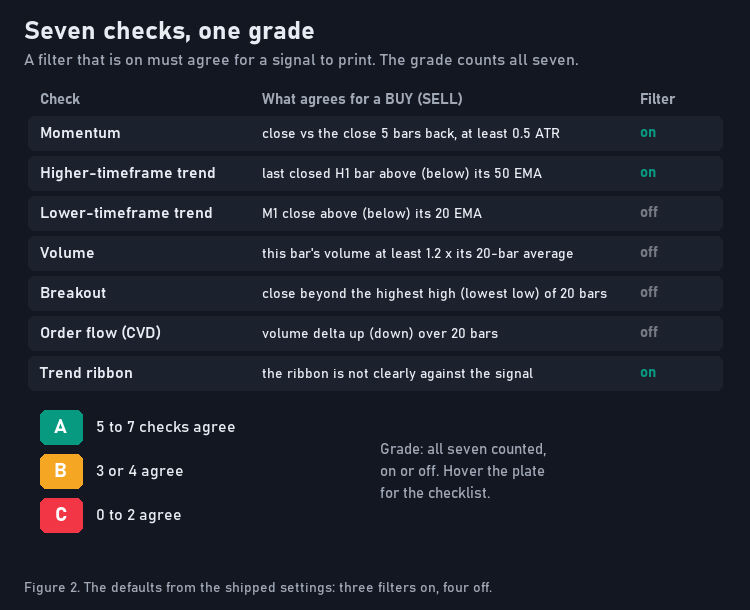
Figure 2. The defaults from the shipped settings: three filters on, four off.
- Momentum (on): the close against the close five bars back must have moved at least half an ATR in the signal's direction.
- Higher-timeframe trend (on): the last closed H1 bar must sit on the signal's side of its 50-period EMA. Only closed bars of the higher timeframe are read, so the check cannot change while the hour is still forming.
- Lower-timeframe trend (off): the M1 close against its 20-period EMA.
- Volume (off): the signal bar's tick volume at least 1.2 times its 20-bar average.
- Breakout (off): the close also beyond the highest high (lowest low) of the last 20 bars.
- Order flow (off): the cumulative volume delta, read from lower-timeframe candles, rising for a BUY or falling for a SELL over 20 bars.
- Trend ribbon (on): blocks a signal only when the ribbon is clearly against it.
The grade counts all seven, whether they are filters or not: five or more in agreement is A, three or four is B, two or fewer is C. With the three default filters on, every printed signal already has at least three checks behind it, so a C appears only when you switch filters off. Hover the plate and the tooltip lists the kind of break, the entry, the stop and which checks agree.
6. The Plan: Entry, Stop and Three Targets
Every signal is drawn with its plan.
- Entry: the close of the signal bar.
- Stop: beyond the last opposite swing, plus a tenth of an ATR. For a BUY that is below the last swing low; for a SELL, above the last swing high. The distance is held between 0.5 and 3 ATR, so a swing that sits very close or very far cannot produce an unusable stop. A fixed ATR multiple can be chosen instead.
- Targets: 1, 2 and 3 times the risk by default. They can also be set in ATR multiples or as fixed price distances, and each one can be switched off.
- Zones: a red risk zone between the entry and the stop, and one green reward band per target.
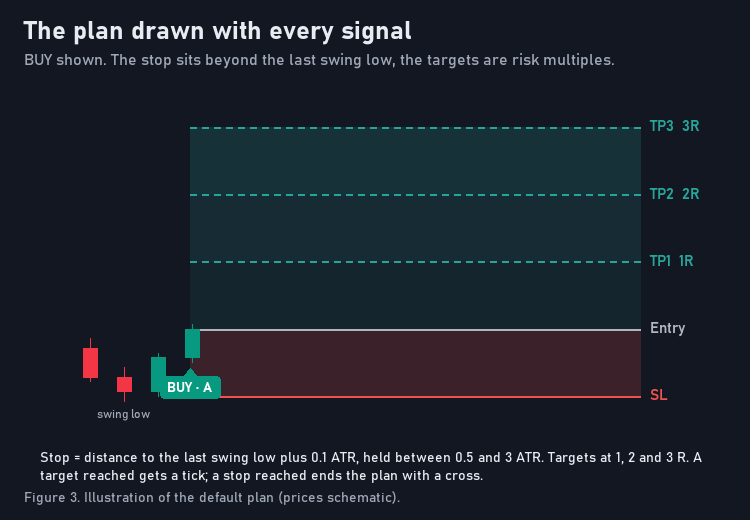
Figure 3. Illustration of the default plan (prices schematic).
The plan is checked bar by bar on closed bars: the stop first, then the targets. A reached target gets a tick on its label, a reached stop a cross. The plan ends at the stop, at the last target, or when the next signal prints. Its lines run 20 bars to the right while it is open, and the newest five signals stay on the chart.
7. Get Ready and the Trigger Lines
Two drawings tell you where the next signal will come from before it prints.
- Get Ready plates appear when price comes within half an ATR of an unbroken swing while the filters (other than momentum and breakout) already agree. It is a warning that a close beyond that swing is close, not a signal.
- Trigger lines are dotted lines at the swing high and swing low that the next BUY and SELL need a close beyond, labelled with their prices. The dashboard repeats them with their distance in ATR.
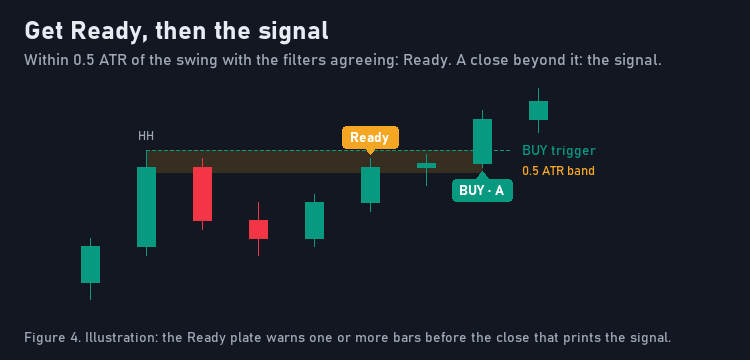
Figure 4. Illustration: the Ready plate warns one or more bars before the close that prints the signal.
8. The Adaptive Trend Ribbon
The ribbon is a Kaufman-style adaptive moving average. It moves fast when the market trends cleanly and slows down in noise, because its speed follows the efficiency of the last ten bars. Around it sits a two-layer band whose colour runs from red through grey to green with the strength of the trend score, and the candles are coloured to match.
The ribbon turns only when a close goes 0.6 ATR beyond it and the trend score agrees, so it does not flip on every small pullback. On a bar where it turns, it leaves a gap, so a new direction is always visible as a new segment.
As a filter, the ribbon is lenient on purpose: it blocks a signal only when it is clearly against it. A grey ribbon does not block anything.
9. ICT Zones of the Current Leg
The indicator measures the current leg between the last swing high and the last swing low and draws three things on it:
- the optimal trade entry (OTE) zone, from 62 to 79 percent of the leg;
- the equilibrium line at 50 percent;
- premium shading above equilibrium and discount shading below it.
In a bullish leg, a pullback into discount and into the OTE zone is where a structure trader looks for the next long; in a bearish leg, the premium half and its OTE zone are where the next short is prepared. The zones move with every new swing, so they always describe the leg that is live now.
10. The Dashboard
The dashboard sits in a corner of the chart (top right by default) and answers five questions at a glance.
- Bias: how many of the dashboard's timeframes point the same way, for example BEARISH 4/4.
- Six timeframes: M5, M15, H1, H4, D1 and W1 by default, each rated by its close against its 50-period EMA on closed bars: strong when the EMA itself also points that way, weak when it does not. A timeframe below the chart's own shows n/a.
- Volatility: low, normal or high, from where the current ATR sits among the last 100 bars.
- Trend ribbon: its direction and conviction in percent, or Sideways.
- Signal: the newest signal, its grade and its state: live, TP1, TP2 or TP3 with a tick, or SL.
- Next BUY and Next SELL: the trigger prices and how far away they are in ATR.
Every cell has a tooltip: hover it for what it measures.
11. What Repaints and What Does Not
Everything that makes a decision is calculated on closed bars:
- swings, breaks, signals, grades and plans never change once they are drawn;
- a target or a stop is marked on the bar that closed beyond it;
- alerts fire once, for the closed bar.
Only the trend ribbon and the candle colours follow the forming bar, because they describe the market now rather than decide anything; when the bar closes, they settle on the closed values. The dashboard, the trigger lines and the ICT zones are updated when a bar closes, like the signals.
The other honest limit is the swing delay: a swing is confirmed five bars after it forms, so a break of that swing can only be seen after those five bars.
12. The Settings That Change the Picture Most
- Signals: CHoCH and BOS (default), CHoCH only, or BOS only. CHoCH only keeps the signals at turns of the structure; BOS only keeps continuation signals.
- Structure length: 5 by default. Smaller values find more and smaller swings, so more signals with tighter stops; larger values find fewer and bigger swings.
- The filters: each one on or off. Switching on the lower-timeframe trend or the order-flow filter makes the signals rarer and stricter.
- The plan: structure or ATR stop, targets in R, ATR or price, and how long the plan runs.
- One signal per direction: switch it off to see every break that passes the filters.
13. The Ten-Second Read
When a plate prints, read it in the same order every time.
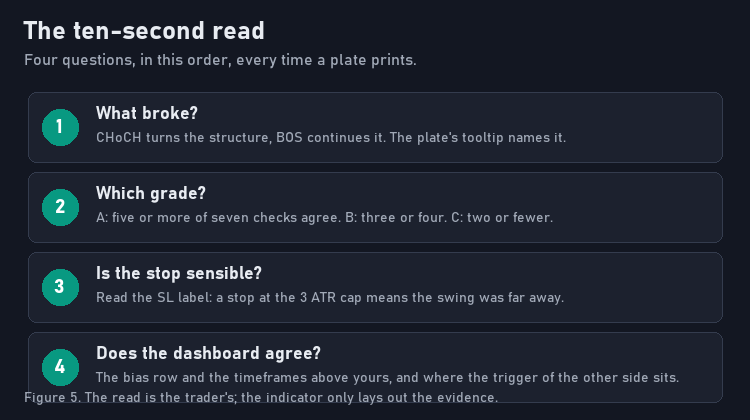
Figure 5. The read is the trader's; the indicator only lays out the evidence.
- What broke? CHoCH turns the structure, BOS continues it.
- Which grade? A is five or more checks in agreement, B three or four.
- Is the stop sensible? A stop at the 3 ATR cap means the swing was far away; the plan is valid, but the position must be small.
- Does the dashboard agree? Look at the bias row and the timeframes above yours.
14. A Practical Workflow
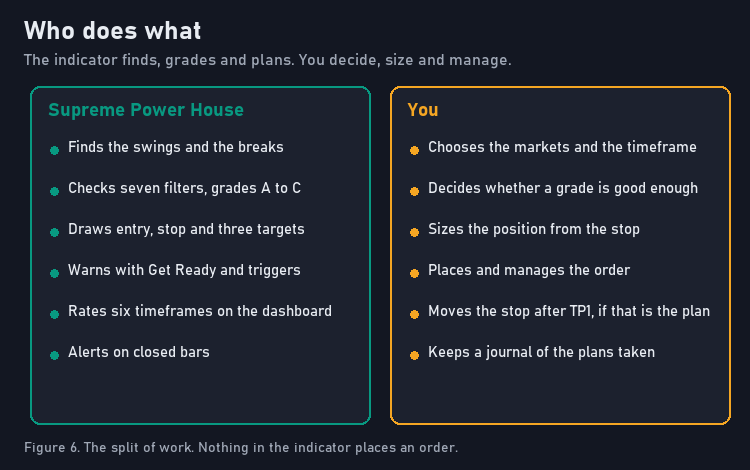
Figure 6. The split of work. Nothing in the indicator places an order.
- Choose the chart. Pick a market and a timeframe you can watch. H1 is a good start: a signal or two a week per market, with enough room between them to manage each one.
- Read the dashboard. Note the bias and the higher timeframes. A BUY with the higher timeframes up is a different trade from a BUY against them.
- Wait for Get Ready. A Ready plate tells you which way the next signal is likely to go and where its trigger is. Set the alert if you will not be watching.
- Read the signal. When the plate prints, do the ten-second read.
- Size from the stop. The plan gives the stop distance. Size the position so that distance costs the amount you accept to lose on one trade.
- Manage by the plan. Decide before entering what you do at TP1: take part off, move the stop, or hold for TP2 and TP3. The ticks on the labels show what the market has done; the decision is yours.
- Keep a journal. Note the grade, the kind of break and the outcome of every plan you take.
15. Three Mistakes That Cost the Most
- Entering on the wick. A break is a close. A wick through the trigger line is not a signal, and the indicator does not print one.
- Ignoring the stop distance. Two signals with the same grade can have very different stops. The position size must follow the stop, not the other way round.
- Trading every grade the same. Grade B means fewer checks agree. Treat it as the weaker of the two: smaller size, or wait for the higher timeframes to agree.
16. Real Chart Examples
Every screenshot below is a real MetaTrader capture of the indicator at its default settings, on a broker's demo feed. The text under each one is read from the newest plate's own tooltip.
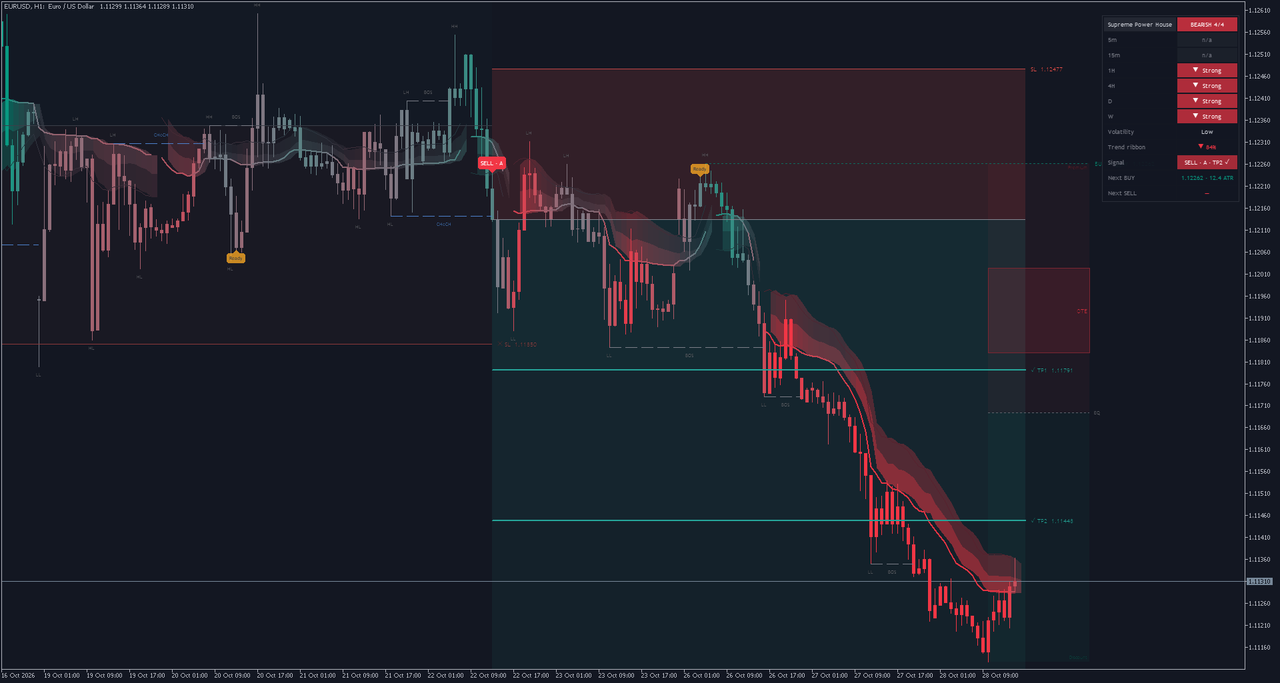
EURUSD H1, MetaTrader 5
The newest plate is a SELL graded A from a CHoCH on 22 October at 13:00, with all seven checks in agreement. The entry is 1.12134 and the stop 1.12477. The structure, the plan of the newest signal with its zones and target ticks, and the dashboard in the corner.
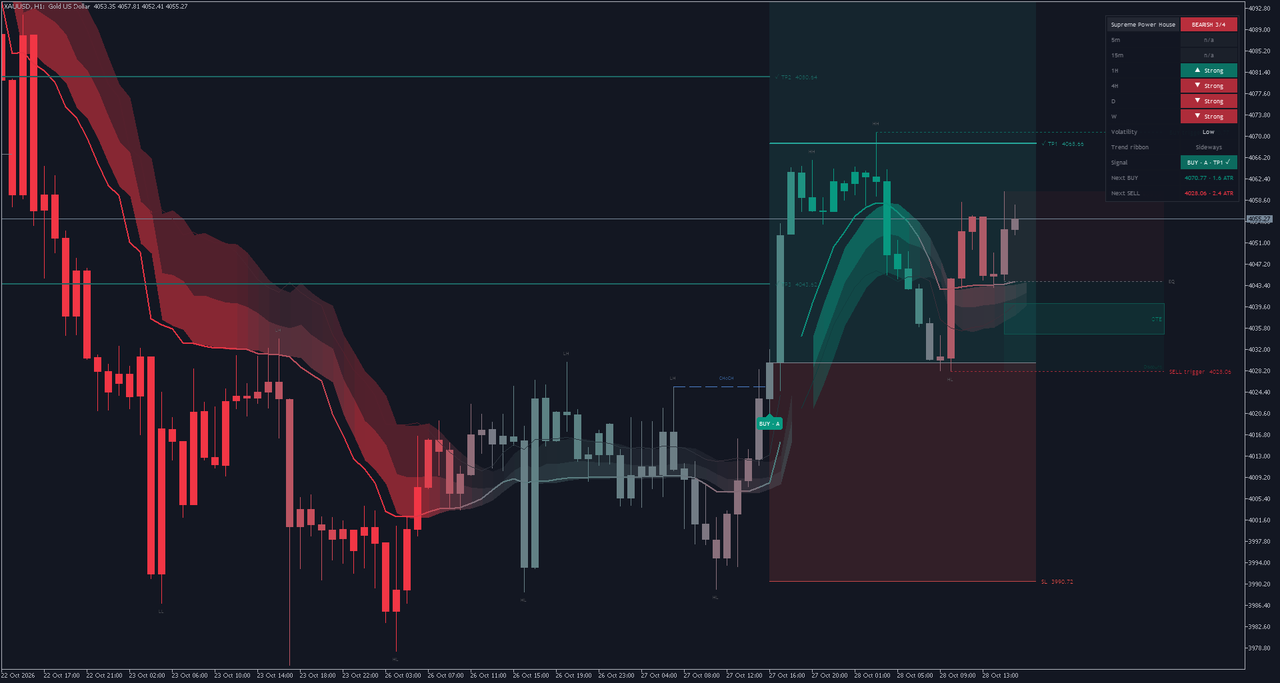
Gold H1 close-up, MetaTrader 5
The newest plate is a BUY graded A from a CHoCH on 27 October at 16:00, with 5 of the seven checks in agreement. The entry is 4029.69 and the stop 3990.72. A close-up at a larger zoom: hover the plate in the terminal and the tooltip lists the seven checks.
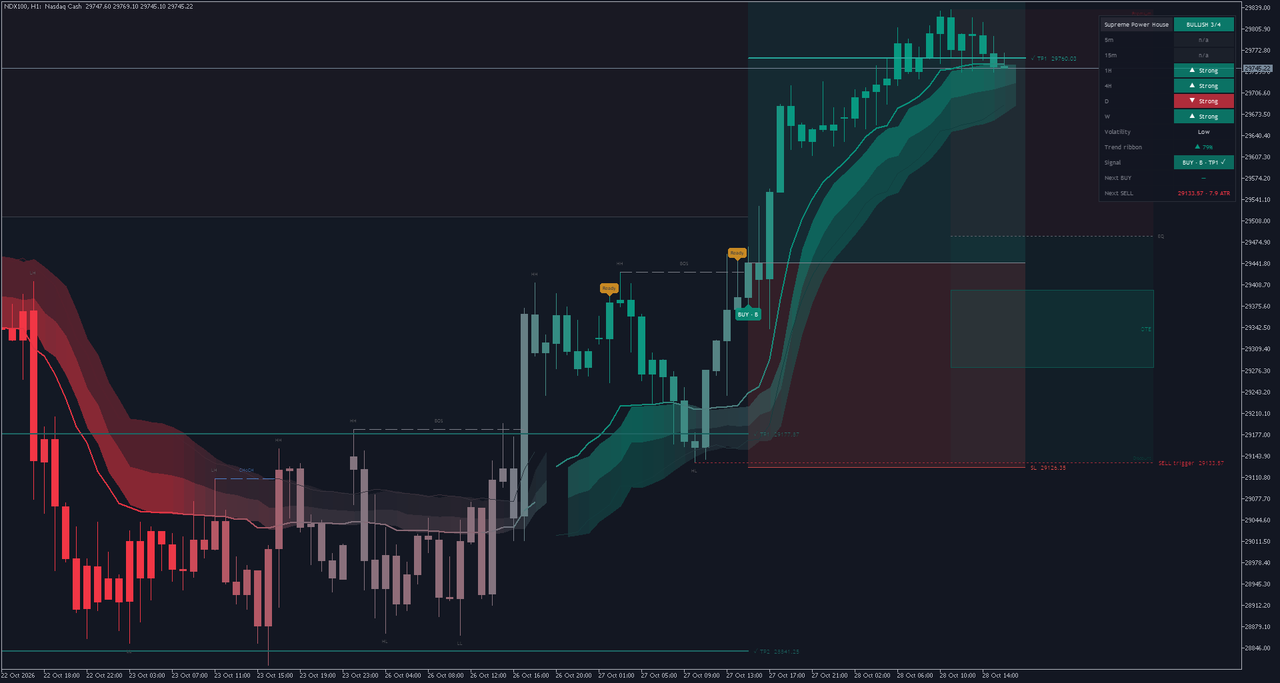
Nasdaq 100 H1 close-up, MetaTrader 5
The newest plate is a BUY graded B from a BOS on 27 October at 15:00, with 3 of the seven checks in agreement. The entry is 29443.19 and the stop 29126.35. The plan's risk zone and reward bands, and the ribbon turning with the move.
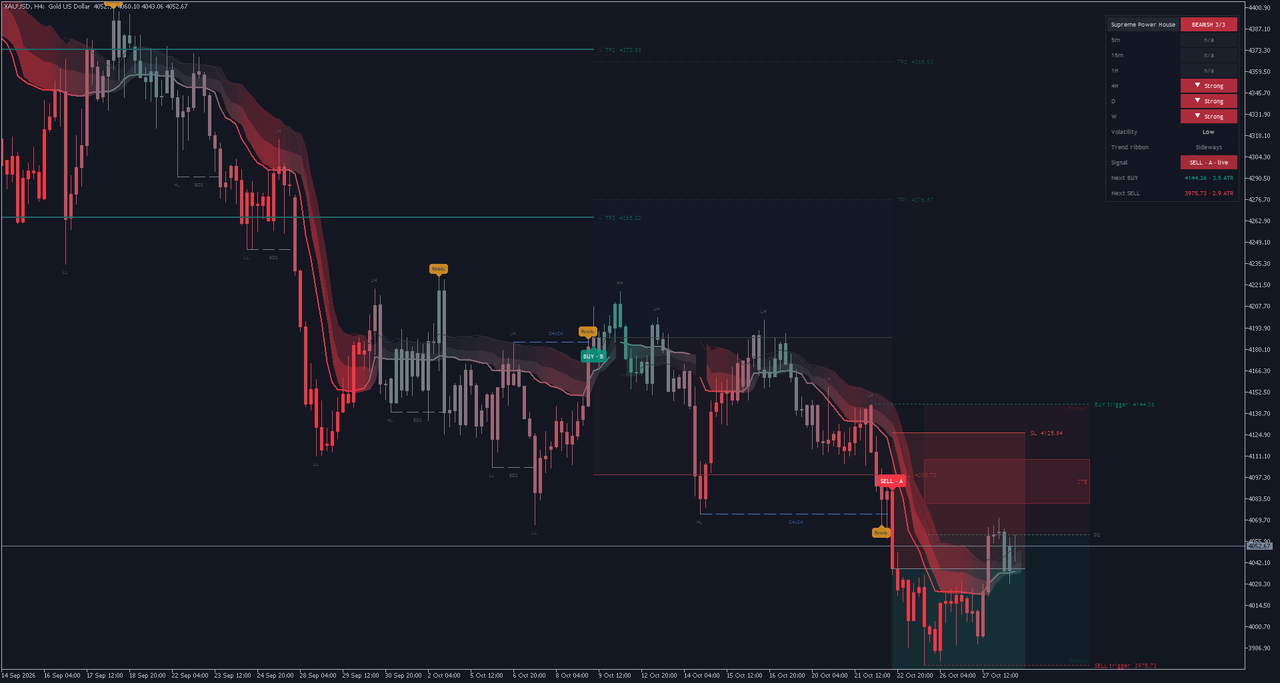
Gold H4, MetaTrader 5
The newest plate is a SELL graded A from a CHoCH on 22 October at 16:00, with all seven checks in agreement. The entry is 4037.98 and the stop 4125.84. On H4 the M5 and M15 rows of the dashboard read n/a: they are below the chart's timeframe.
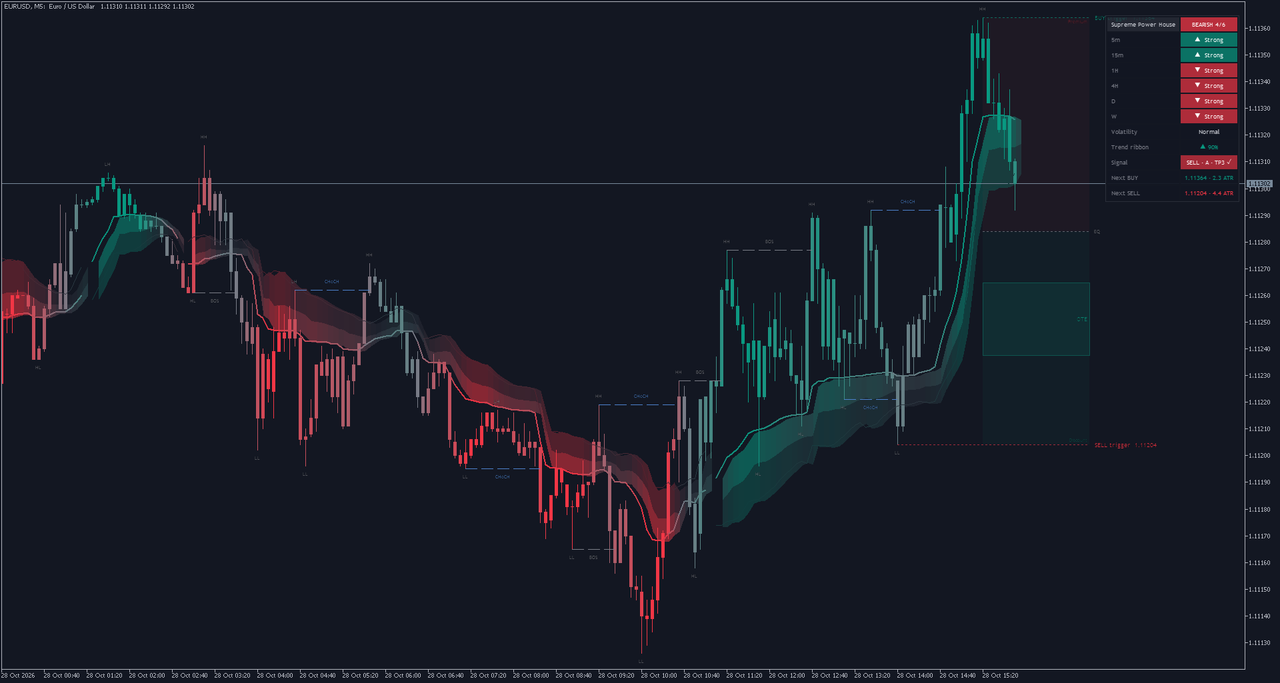
EURUSD M5, MetaTrader 5
The newest plate is a SELL graded A from a CHoCH on 26 October at 13:05, with 6 of the seven checks in agreement. The entry is 1.12010 and the stop 1.12105. On M5 the plates come more often, and the higher-timeframe filter still reads the closed H1 bars.
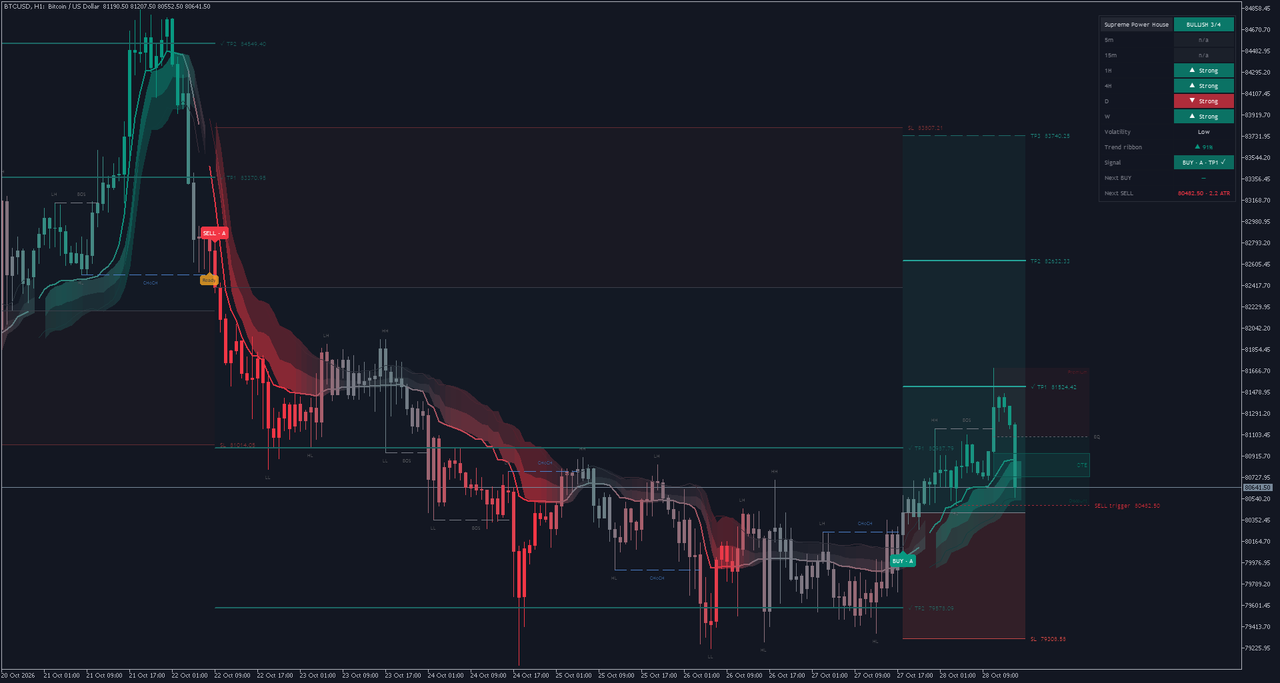
Bitcoin H1, MetaTrader 5
The newest plate is a BUY graded A from a CHoCH on 27 October at 18:00, with 6 of the seven checks in agreement. The entry is 80416.50 and the stop 79308.58. Crypto trades through the weekend, so its swings and plans run without the weekend gaps.
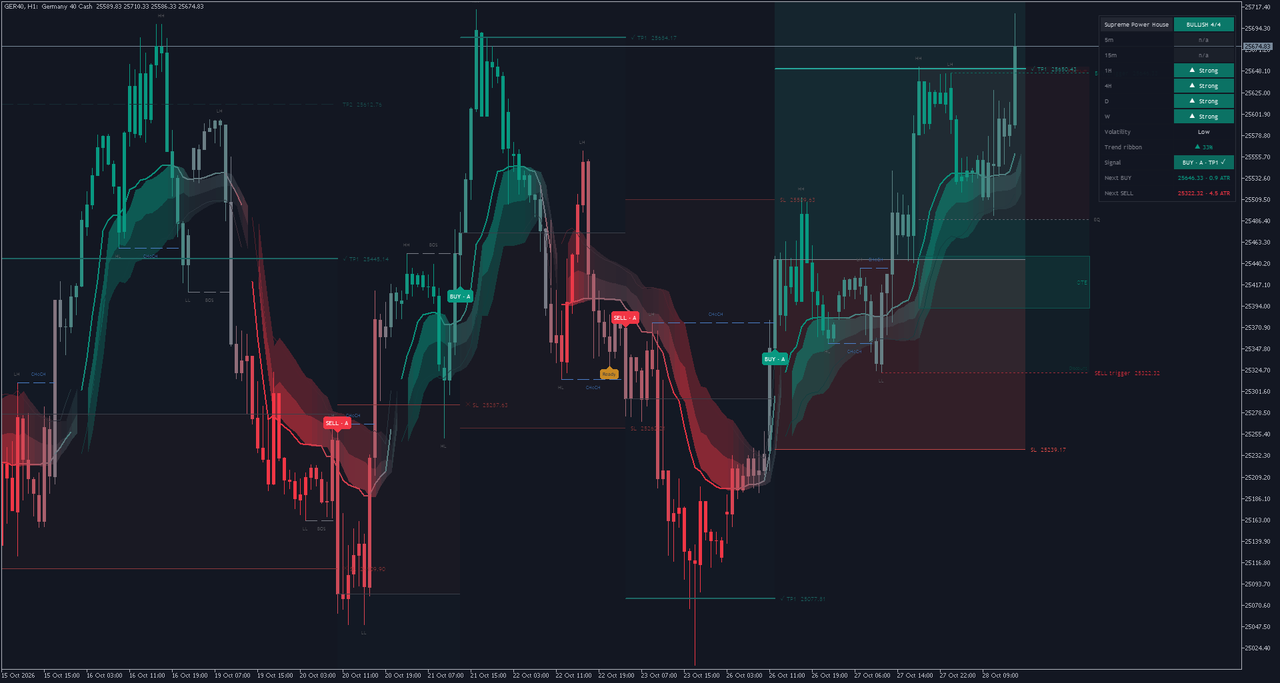
DAX 40 H1, MetaTrader 5
The newest plate is a BUY graded A from a CHoCH on 26 October at 12:00, with 6 of the seven checks in agreement. The entry is 25444.80 and the stop 25239.17. An index chart: the stop distance is held between 0.5 and 3 ATR whatever the price level.
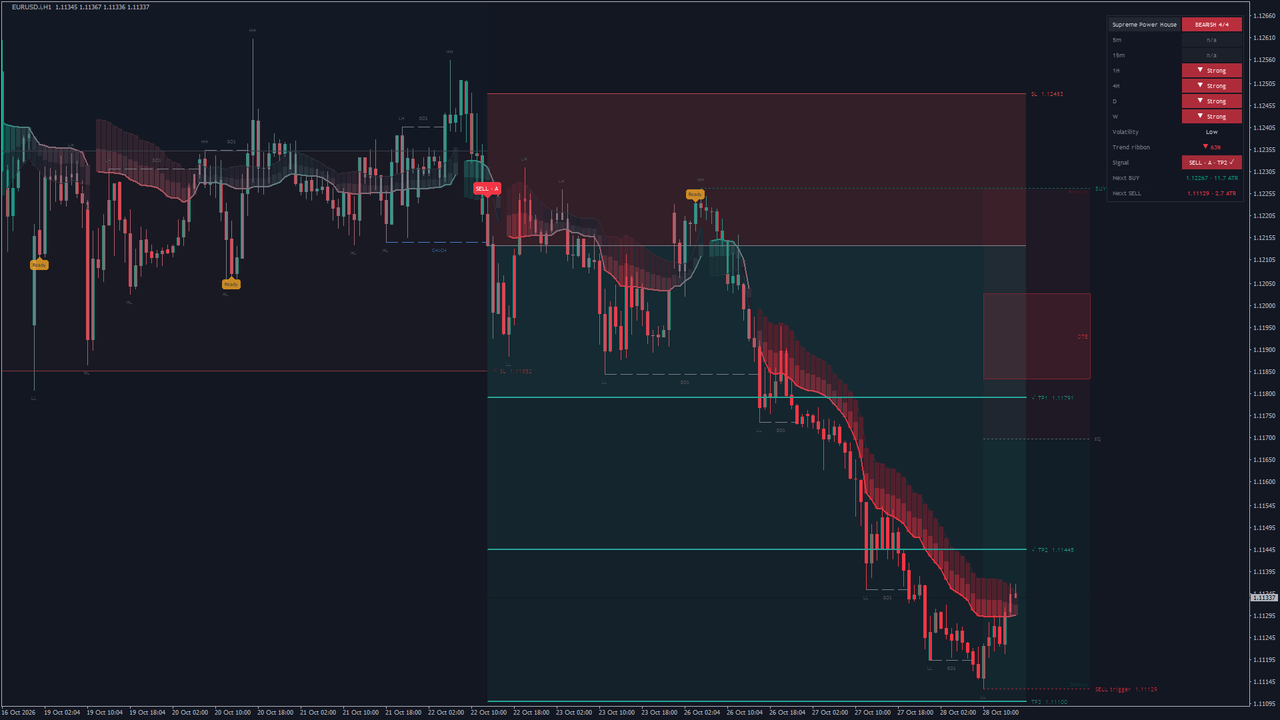
EURUSD H1, MetaTrader 4
The newest plate is a SELL graded A from a CHoCH on 22 October at 13:00, with all seven checks in agreement. The entry is 1.12137 and the stop 1.12483. The MetaTrader 4 version on its own broker feed: the same drawings, with the ribbon band in colour steps.
17. Alerts
Eight events can raise an alert, each with its own switch:
- a BUY signal and a SELL signal (on by default);
- a Get Ready BUY and a Get Ready SELL;
- TP1, TP2 and TP3 reached;
- the stop reached.
Four channels deliver them: the terminal's alert window (on by default), a sound with a file of your choice, a push notification to the MetaTrader app on your phone, and e-mail. Push and e-mail use the terminal's own settings (Tools, Options, Notifications and Email).
Every alert is evaluated on a closed bar and fires once for that bar. Nothing fires while the indicator calculates the chart's history, and nothing fires in the Strategy Tester. A BUY alert reads like this:
Supreme Power House: SELL signal (CHoCH, grade A, entry 1.12134, stop 1.12477) on EURUSD H1 @ 1.12134
18. Installation from the MQL5 Market
- Open the product page from the links in the introduction and buy or rent it with your MQL5 account.
- In MetaTrader, log in to the same MQL5 account (Tools, Options, Community), open the Toolbox (Ctrl+T), go to the Market tab, find the product under Purchased and click Install. It then appears in the Navigator under Indicators, Market.
- Drag Supreme Power House onto a chart. Leave the defaults for the first look, then open the settings (Ctrl+I) to adjust.
- The dashboard needs the other timeframes of the same symbol. On a fresh terminal it may take a few seconds to load them; the indicator redraws by itself when they arrive.
19. Parameter Reference
Every input, its default in the shipped version and what it does.
1. Signals
| Input | Default | What it does |
|---|---|---|
| Signals | CHoCH + BOS | Which breaks may print a signal: both, only changes of character, or only breaks of structure. |
| Structure length (bars each side of a swing, 2-50) | 5 | Bars on each side of a swing. Smaller finds more, smaller swings; larger fewer, bigger ones. |
| One signal per direction until the opposite signal | Yes | After a BUY, the next signal must be a SELL (and the other way round). |
| Get Ready pre-signals | Yes | Draw the Get Ready plates before a likely signal. |
| Get Ready: within ATR of the swing | 0.5 | How close to the unbroken swing price must come for Get Ready, in ATR. |
| Show grade on signals | Yes | Write the grade (A, B or C) on the BUY and SELL plates. |
| Structure lines (CHoCH / BOS) | Yes | Draw the dashed CHoCH and BOS lines with their labels. |
| Swing labels (HH / HL / LH / LL) | Yes | Write HH, HL, LH and LL on every confirmed swing. |
| Next BUY / SELL trigger levels | Yes | Draw the dotted lines at the next BUY and SELL trigger levels. |
2. Filters (every enabled filter must agree)
| Input | Default | What it does |
|---|---|---|
| Momentum | Yes | Momentum filter: the move over the last bars must be large enough. |
| Momentum bars | 5 | How many bars back the momentum filter compares the close with. |
| Momentum ATR | 0.5 | The momentum the filter needs, in ATR. |
| Higher-timeframe trend | Yes | Higher-timeframe filter: the last closed bar of the higher timeframe must sit on the signal's side of its EMA. |
| Higher-timeframe | H1 | The higher timeframe that filter reads. |
| Higher-timeframe EMA | 50 | The EMA length on the higher timeframe. |
| Lower-timeframe trend | No | Lower-timeframe filter: the lower timeframe's close must sit on the signal's side of its EMA. |
| Lower-timeframe | M1 | The lower timeframe that filter reads. |
| Lower-timeframe EMA | 20 | The EMA length on the lower timeframe. |
| Volume | No | Volume filter: the signal bar's tick volume must stand out from its 20-bar average. |
| Volume x average | 1.2 | How many times the average the volume must reach. |
| Breakout (close beyond the recent high / low) | No | Breakout filter: the close must also break the highest high (lowest low) of recent bars. |
| Breakout bars | 20 | How many bars the breakout filter looks back. |
| Order flow (CVD from lower-timeframe candles) | No | Order-flow filter: the cumulative volume delta from lower-timeframe candles must point the signal's way. |
| Order flow bars | 20 | Over how many bars the order-flow change is measured. |
| Trend ribbon (blocks only a clearly opposite ribbon) | Yes | Trend-ribbon filter: blocks a signal only when the ribbon is clearly against it. |
| Session window | No | Session filter: signals only inside the session window. |
| Session (HHMM-HHMM) | 0700-1600 | The session window, start and end in hours and minutes. |
| Session timezone (e.g. America/New_York, Europe/London, UTC) | America/New_York | The timezone of the session window (a city name such as America/New_York, or UTC). |
3. Trend ribbon
| Input | Default | What it does |
|---|---|---|
| Ribbon | Yes | Draw the adaptive trend ribbon and its two-layer band. |
| Candle colours | Yes | Colour the candles with the ribbon's colour. |
| Adaptive length | 10 | The efficiency window of the adaptive average: how many bars it measures trend against noise over. |
| Adaptive slow | 30 | The slowest speed of the adaptive average. |
| Flip band (ATR): a direction change needs a close this far beyond | 0.6 | How far beyond the ribbon (in ATR) a close must go to turn the ribbon's direction. |
| Colour smoothing (bars, 1-50) | 10 | Smoothing of the ribbon's colour. |
4. Trade plan
| Input | Default | What it does |
|---|---|---|
| Stop (Structure: beyond the swing; ATR x: fixed multiple) | Structure | Stop beyond the last opposite swing, or a fixed ATR multiple. |
| Stop ATR x | 1.5 | The ATR multiple of the fixed stop. |
| Stop distance (ATR): min | 0.5 | The structure stop is never closer than this, in ATR. |
| Stop distance (ATR): max | 3.0 | The structure stop is never further than this, in ATR. |
| Targets in | R multiple | The unit of the three targets: risk multiples (R), ATR multiples, or price distance. |
| TP1 | Yes | Use the first target. |
| TP1 value | 1.0 | The first target's distance in the chosen unit. |
| TP2 | Yes | Use the second target. |
| TP2 value | 2.0 | The second target's distance. |
| TP3 | Yes | Use the third target. |
| TP3 value | 3.0 | The third target's distance. |
| Show trade plan | Yes | Draw the trade plan: entry, stop, zones, target lines and labels. |
| Hit rate on targets | No | Add to each target label how often this chart's past plans reached it (after 20 closed plans). |
| Plan length (bars, 5-200) | 20 | How many bars the plan's lines and zones run to the right. |
| Signals kept on chart (1-50) | 5 | How many signals and plans stay on the chart. |
5. ICT
| Input | Default | What it does |
|---|---|---|
| OTE zone of the current leg | Yes | Draw the optimal trade entry zone of the current leg. |
| OTE from | 0.62 | The start of the OTE zone, as a fraction of the leg. |
| OTE to | 0.79 | The end of the OTE zone, as a fraction of the leg. |
| Equilibrium (50%) | Yes | Draw the equilibrium line at the middle of the leg. |
| Premium / discount shading | Yes | Shade the premium half above equilibrium and the discount half below it. |
6. Dashboard
| Input | Default | What it does |
|---|---|---|
| Dashboard | Yes | Show the dashboard. |
| Dashboard position | Top right | The corner the dashboard sits in. |
| Dashboard text size | Small | The dashboard's text size. |
| Matrix 1 | M5 | The first timeframe of the dashboard's trend matrix. |
| Matrix 2 | M15 | The second matrix timeframe. |
| Matrix 3 | H1 | The third matrix timeframe. |
| Matrix 4 | H4 | The fourth matrix timeframe. |
| Matrix 5 | D1 | The fifth matrix timeframe. |
| Matrix 6 | W1 | The sixth matrix timeframe. |
| Matrix EMA | 50 | The EMA length the matrix rates each timeframe against. |
7. Colours
| Input | Default | What it does |
|---|---|---|
| Buy | #089981 | Colour of BUY plates, bullish ribbon and up candles. |
| Sell | #F23645 | Colour of SELL plates, bearish ribbon and down candles. |
| Get Ready | #F5A623 | Colour of the Get Ready plates. |
| CHoCH | #5B9CF6 | Colour of CHoCH lines and labels. |
| BOS | #9598A1 | Colour of BOS lines and labels. |
| Targets | #26A69A | Colour of the target lines, labels and reward zones. |
| Stop | #EF5350 | Colour of the stop line, label and risk zone. |
| Entry | #B2B5BE | Colour of the entry line. |
MetaTrader
| Input | Default | What it does |
|---|---|---|
| Bars to calculate (0 = all) | 20,000 | How many of the newest bars are calculated (0 = the whole chart). Fewer bars load faster. |
| Broker server time zone (for the session window) | Auto (from the broker clock) | Your broker's clock, for the session window. Auto reads it from the terminal. |
| Keep object limits (500 boxes, 500 lines, 500 labels) | Yes | Keep at most 500 boxes, lines and labels, removing the oldest first. Off keeps everything. |
Alerts
| Input | Default | What it does |
|---|---|---|
| Enable alerts | Yes | The master switch of every alert. |
| Alert: BUY signal | Yes | Alert when a BUY signal prints. |
| Alert: SELL signal | Yes | Alert when a SELL signal prints. |
| Alert: Get Ready BUY | No | Alert on a Get Ready BUY. |
| Alert: Get Ready SELL | No | Alert on a Get Ready SELL. |
| Alert: TP1 hit | No | Alert when the newest plan reaches TP1. |
| Alert: TP2 hit | No | Alert when it reaches TP2. |
| Alert: TP3 hit | No | Alert when it reaches TP3. |
| Alert: Stop hit | No | Alert when a plan's stop is reached. |
| Channel: popup window | Yes | Deliver alerts in the terminal's alert window. |
| Channel: sound | No | Play a sound with each alert. |
| Sound file (in the terminal's Sounds folder) | alert.wav | The sound file, from the terminal's Sounds folder. |
| Channel: push notification | No | Send alerts to the MetaTrader app on your phone (set your MetaQuotes ID in the terminal's options). |
| Channel: e-mail | No | Send alerts by e-mail (set up the e-mail tab in the terminal's options). |
20. Conclusion
Supreme Power House is a structure trader's checklist, drawn. It finds the swings, names every break, grades it against seven checks and lays out a plan that can be sized and managed, while the ribbon, the ICT zones and the dashboard give the context around it. What it does not do is decide for you: it does not place trades, and it does not print a win rate. Use the grade and the plan as the starting point of your own decision, test it on a demo account first, and keep a journal of the plans you take.
Risk Disclaimer
Trading leveraged products such as forex and CFDs carries a high level of risk and may not be suitable for all investors. You could lose more than your initial deposit. Supreme Power House is an analysis tool, not financial advice; past signals do not guarantee future results. Test it on a demo account before trading real money.