
Burst Exhaustion for MT4 and MT5: How to Read the Signals, Clusters and Session Ranges of Supreme Pressure Signals

1. Introduction
A move that runs far beyond its usual range is easy to see and hard to weigh. Is it still going, or has it run out of fuel? Did it run into anything on the way? Supreme Pressure Signals answers those questions by fixed rules and draws the answers. It waits for a burst beyond a volatility band to stall, marks a signal against it, maps the pressure clusters and session ranges around it, rates the setup from 0 to 10 and lays out a ticket with an entry, a stop and three targets.
This guide explains the rule behind every part of the picture and ends with a read of one signal in about ten seconds. Figures 2 and 7 illustrate a rule; Figures 1, 3, 4, 5, 6 and 8 are real MetaTrader charts.
One rule about time runs through the whole guide. Signals are decided on the closed bar and do not change afterwards. On the forming bar the dashboard moves with every tick, and a target, a stop or a cluster event counts on the touch and can change until the bar closes.
2. What It Looks For: a Burst That Runs Out of Fuel
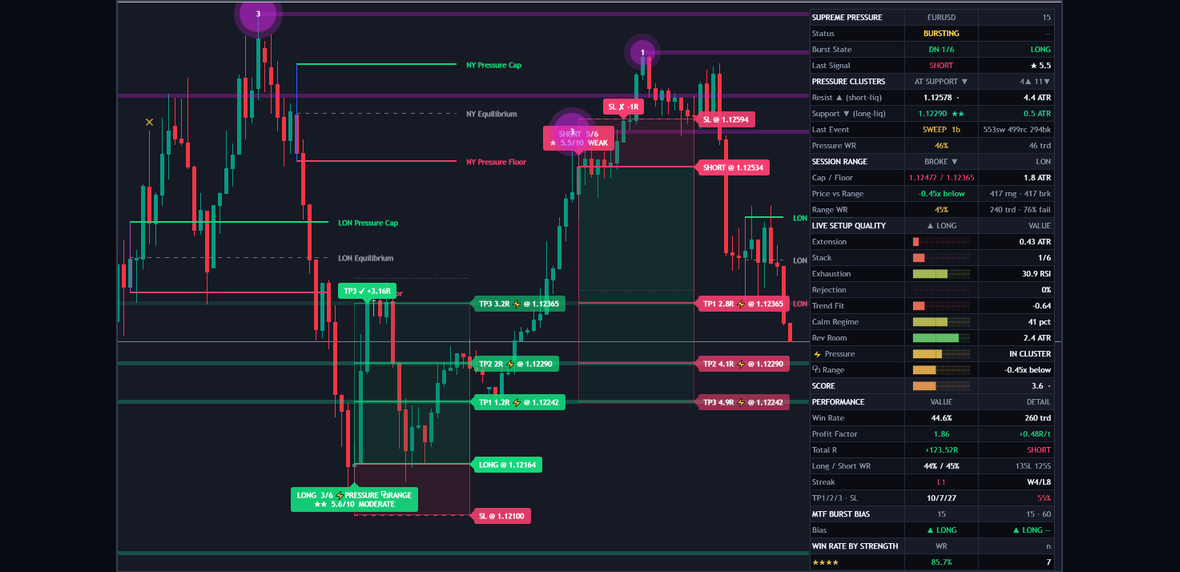
Figure 1. The indicator on a MetaTrader chart: signal labels, pressure clusters, session ranges, a ticket and the dashboard, all on the price chart.
A burst is a bar whose high or low reaches beyond a band drawn around an average. The indicator does not follow the burst. It waits for the burst to stop expanding, then marks a signal against it, back toward the average: SHORT after an up burst, LONG after a down burst. A signal goes against the move in progress, and a move can run much further than any band.
Everything is drawn on the price chart:
- LONG and SHORT labels on the signal bars. Hover a label to read what went into it.
- Pressure clusters: round bubbles at swing points, with level lines out to the newest bars.
- Session ranges: a box around each opening range, with its level lines.
- The ticket: a stop zone and three target zones, with lines, priced labels and a result label.
- The dashboard, which says why.
- Two optional marks: diamonds on a reclaimed sweep (Show cluster reclaim diamonds, off) and a tint on the peak bar of an extreme burst (Tint background on extreme bursts, off).
3. The Burst: Basis, Band and Stack

Figure 2. Illustration of the rule: the band, the burst, the stack, the peak, the filters and the signal, at the default settings.
The basis. A 20-bar EMA of the close (Basis length). It is the average a burst is measured from, and the average a signal points back to.
The band. 2.0 ATR on each side of the basis (Band width), with the ATR over 14 bars (ATR length). Because the band is measured in the symbol's own ATR, the same settings fit a quiet forex pair and a fast index. The basis and the band are not drawn as lines; a ticket's dotted line marks where the basis stood at its signal.
The burst. A bar bursts when its high is above the upper band or its low is below the lower band. The close does not matter unless you switch on Require closing burst (off).
The stack. How far beyond the band the bar reached, in steps. A burst starts at level 1, and each further 0.5 ATR (ATR per stack step) adds a level, up to 6 (Max stack height). At the defaults level 3 starts 1.0 ATR beyond the band. A stack is a distance, not a number of bars. A burst that peaks at the maximum is an extreme burst.
4. The Signal and When It Is Decided
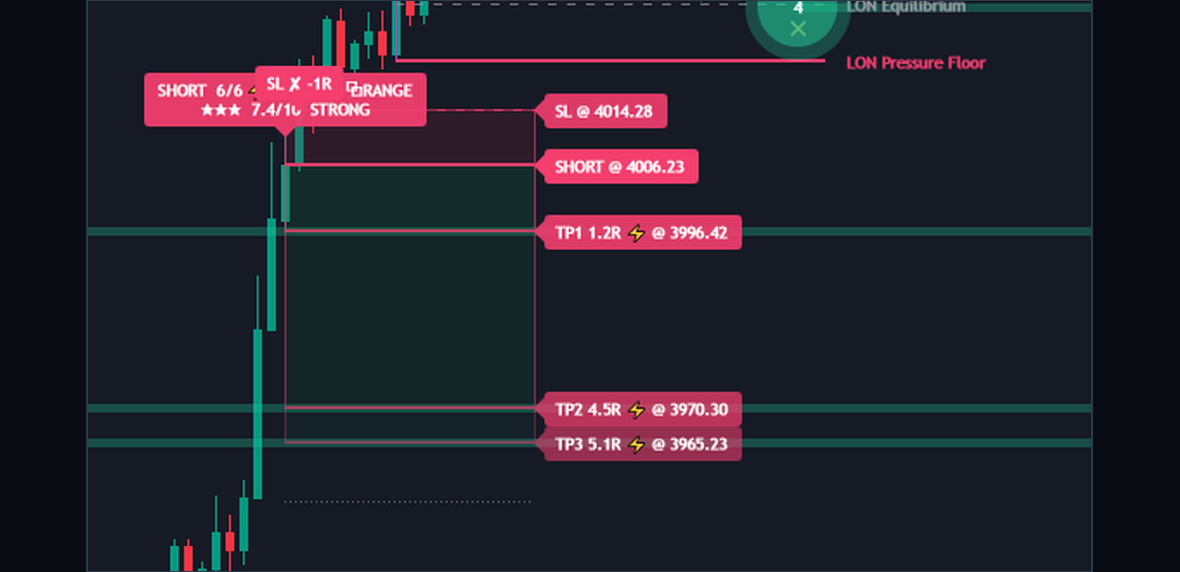
Figure 3. A signal label on a real chart with its ticket: the stop zone, the three target zones, the lines and the priced labels.
The peak. A burst has peaked when the bar before this one reached beyond the band, at least as far as the bar before it, and further than this one. So the signal comes on the first bar that reaches less far, one bar after the highest reach.
What a peak needs. A peak becomes a signal only if all of these hold:
- The stack at the peak reached Min stack height to signal (3), and its distance reached Min burst magnitude (0).
- The side is allowed: Allow SHORTS (up bursts) and Allow LONGS (down bursts) are both on by default.
- No trade is open, none ended on this bar, and Minimum spacing between signals (20 bars) has passed since the last signal.
- The setup reaches Minimum stars to take (0).
- Every filter you switched on passes:
| Filter | Default | Passes when |
|---|---|---|
| Require rejection wick on the peak bar | false | The peak bar's wick back from the burst is at least Min rejection wick (0.30) of its range. |
| Require RSI exhaustion | false | RSI at the peak is at or above RSI overbought (65) for a short, at or below RSI oversold (35) for a long. |
| GATE - burst must hit / sweep an opposing cluster | false | The burst reached into a cluster on its side, on the peak bar or the signal bar, or a sweep was reclaimed on the signal bar. |
| GATE - burst must extend beyond the session range | false | The peak is beyond the Pressure Cap or Pressure Floor the dashboard shows. |
| GATE - only trade inside an enabled trading session | false | The bar is inside the Session time of a switched-on window. |
If both sides qualify on one bar, the bigger burst wins.
The label. The first line is the side, the stack (such as 4/6), a PRESSURE tag if the burst reached a cluster and a RANGE tag if it went beyond the session range. The second line is the stars, the score out of 10 and its name.
When it is decided. With Confirm on bar close (on), the peak is tested only when a bar closes, so a signal does not change after it prints. MetaTrader reports a close with the next bar's first tick, so the label sits on the bar that closed and appears as the next bar opens. With it off, the peak is tested on every tick of the forming bar, and a label can appear and go away again before the close.
Reading a missing label. The Status row gives the plain reason: BURSTING while the stack is below the minimum, ARMED from that level up, and IN TRADE while a ticket is open, because no new signal can start then. SCANNING means no burst at all.
5. Pressure Clusters: Touch, Sweep, Reclaim, Break and Flip
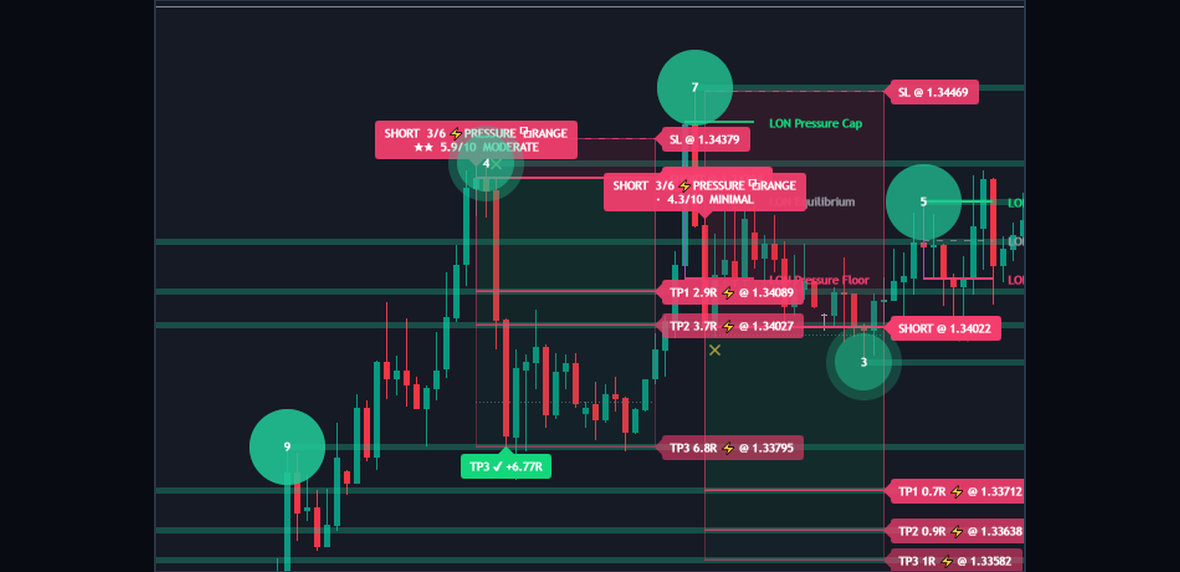
Figure 4. Pressure clusters on a real chart: bubbles at swing points with a score inside, and their level lines out to the newest bars.
Where a cluster comes from. Every swing high and low with 12 bars on its left (Pivot left) and 4 on its right (Pivot right) can start one. A swing low starts a support cluster under price, a swing high a resistance cluster above it. It appears 4 bars after its swing. Clusters start only inside Lookback (3,000 bars back from the newest bar when the indicator loaded). A new one that overlaps a live one by at least Overlap threshold (35) is dropped. At most 30 stay live (Max live clusters), and each ends after 400 bars (Max cluster age).
What price does to one. Each cluster has an invisible band around its level, 0.5 (Band height) times its own ATR over 200 bars (Cluster ATR length).
| Event | What it means |
|---|---|
| Touch | Price reached into the band and closed on the cluster's side of it. |
| Sweep | Price went through the band by at least 0.15 ATR (Min sweep depth). |
| Reclaim | After a sweep, a close back on the cluster's side. |
| Break | After a sweep, a close 0.9 ATR beyond it (Decisive break acceptance), or a close still beyond it after 6 bars (Max reclaim window). |
| Flip | A broken cluster changes sides: support becomes resistance and the reverse. With Flip broken clusters off, it ends instead. |
How to read a bubble.
- The number is the cluster's score from 1 to 10. Of that, 0.7 (Magnitude weight) is its weight against the other live clusters: the tick volume times the range of its swing bar. The rest is how well it has held and how recently it was tested.
- The size follows the weight alone.
- The opacity follows the score: the higher the score, the more solid the bubble.
- The colour gives the side, so a flip changes it. The other Cluster color mode, Spectrum (vertical), colours by height instead.
- The level line runs from the bubble to just past the newest bar. It fades while the cluster is swept, until a reclaim or a break settles it.
A score describes what has happened at that level so far. It says nothing about what price does there next.
Two regimes on a deep chart. Clusters exist only inside the Lookback. With Bars To Calculate at 20,000 and Lookback at 3,000, the older part of the history has no clusters at all, so the tickets there ran without clusters: no cluster targets and no credit in the Pressure pillar. Set Lookback to 0 for clusters over the whole chart; it draws more and takes longer.
6. Session Ranges: Cap, Floor and Equilibrium
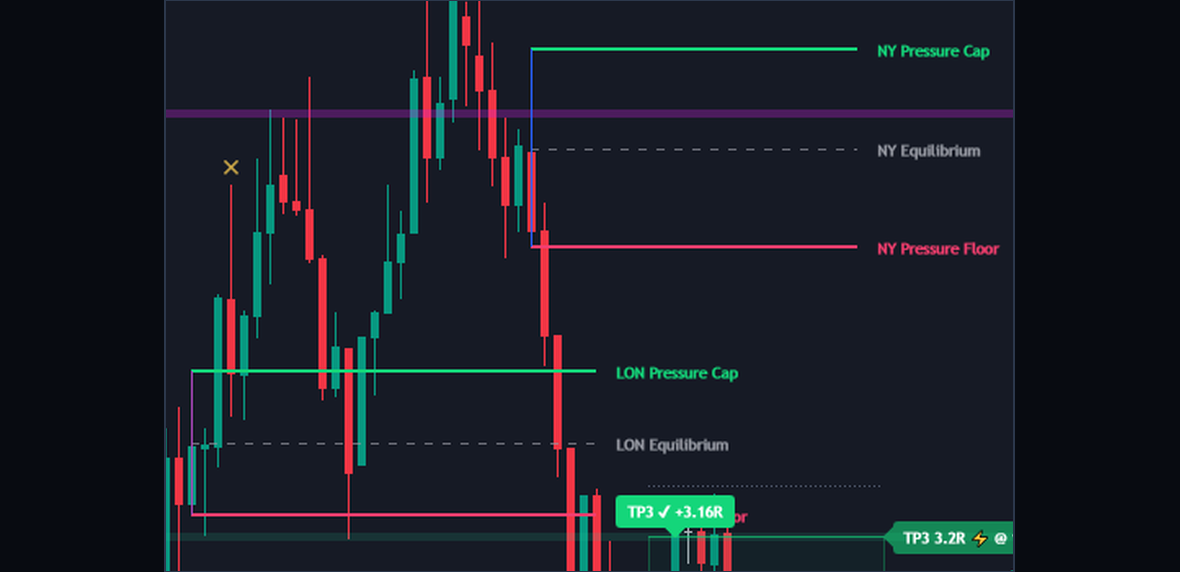
Figure 5. A session range on a real chart: the box, the Pressure Cap, Pressure Floor and Equilibrium lines with their tags, and a cross on a failed breakout.
Each of the three windows has a name, a Range time and a Session time:
| Window | Range time | Session time | At the defaults |
|---|---|---|---|
| NY | 0930-0945 | 0930-1600 | on |
| LON | 0300-0315 | 0300-1100 | on |
| ASIA | 2000-2015 | 2000-0400 | off |
What it draws. During the range time the indicator records the high and the low. When the range time ends it draws the box and three lines: Pressure Cap (the high), Pressure Floor (the low) and Equilibrium (the middle), each with a tag carrying the window's name. They run on through the session time.
Breakout and failed breakout. In the rest of the session the first close beyond the range is a breakout. A close back inside after it is a failed breakout, marked with a cross (Show failed range-breakout crosses, on). A window counts one of each per session. Both are read on closed bars, so they do not change.
The timezone. The times read Timezone, America/New_York by default, and that holds for all three windows. LON at 0300 is 03:00 in New York, not in London. Change Timezone and every window moves with it, so rewrite the times too.
The broker clock. MetaTrader's bars carry your broker's clock, so the indicator turns a bar's time into UTC before it reads Timezone. Broker server time zone does that, on Auto by default. GMT+2 or GMT+3 is taken as the usual New York close clock, which moves with New York's daylight saving; any other difference is used as it stands. If the boxes sit an hour off, name your broker's clock there. The Exchange choice of Timezone reads UTC on MetaTrader.
A bar counts by its open time. A range shorter than the bar can draw nothing: on H1 at the defaults, New York's 0930-0945 has no bar of its own, while London's 0300-0315 can fill one. On D1 and above the module switches itself off, the block reads INTRADAY ONLY and the Range pillar stays neutral.
7. The Score: Nine Pillars and the Stars
Each pillar reads from 0 to 1. The score is their average by weight, scaled to 10. A weight of 0 leaves that pillar out.
| Pillar | Weight | What it reads |
|---|---|---|
| Burst Extension | 0.16 | The peak's distance beyond the band against Heat saturates at (3.0 ATR). |
| Stack Height | 0.12 | The stack against Max stack height. |
| Momentum Exhaustion | 0.12 | RSI at the peak on the burst's side of 50, full at 30 points from it. |
| Rejection Wick | 0.10 | The peak bar's wick back from the burst, full at 0.6 of the bar's range. |
| Trend Fit | 0.08 | The basis's change over three bars, against the signal's side. |
| Volatility Regime | 0.06 | Where the ATR ranks over the last 100 bars. Calmer scores higher. |
| Reversion Room | 0.06 | How far the entry sits from the basis, full at 1.5 band widths. |
| PRESSURE Cluster | 0.20 | A hit or sweep of an opposing cluster, weighted by that cluster's score. A reclaim on the signal bar scores 0.9, and a near miss within Cluster proximity (1.0 ATR) earns part. |
| Session RANGE | 0.10 | How far beyond the range the burst went, full at one range width (Range pillar saturates at, 1.0). A failed breakout on the signal bar scores 0.9. It reads a neutral 0.5 until a range exists. |
The score then names a rank:
| Score | Stars | Name |
|---|---|---|
| 7.5 and up | Four | ELITE |
| 6.5 and up | Three | STRONG |
| 5.5 and up | Two | MODERATE |
| 4.5 and up | One | WEAK |
| Below 4.5 | A dot | MINIMAL |
The score describes the setup at the moment it fired, from what the chart shows. It is not a chance of success, and it is not a forecast. Minimum stars to take (0) decides which signals open a ticket, and Alert minimum stars (0) which ones alert.
Keep two scores apart. The one on a label is frozen at that signal. The SCORE row of the dashboard reads the newest bar, for the side that bar would signal, so it moves with every tick.
8. The Ticket: Entry, Stop, Targets and How a Trade Ends
A signal arms a ticket: a set of zones, lines and labels that the indicator tracks, not an order. It does not place trades, and these are reference levels, not a forecast. Figure 3 shows one.
Entry. The close of the signal bar.
Stop, from Stop basis:
- Burst Extreme (the default): beyond the burst's high or low by a margin of 0.30 ATR.
- ATR Multiple: 1.2 ATR from the entry (Stop distance).
- Swing Extreme: beyond the highest high or lowest low of 10 bars (Swing lookback), plus the same margin.
Whatever the basis, the distance stays between 0.5 ATR (Min risk) and 3.0 ATR (Max risk). That distance is 1 R.
Targets, from Target ladder:
- Pressure Ladder (the default): TP1, TP2 and TP3 are the nearest opposing clusters at least 0.6 R away (Pressure Ladder - min rung distance). A rung with no cluster falls back to its R multiple, kept at least half a stop distance beyond the rung before it. A bolt mark on a target's label says that rung is a cluster.
- R Multiples: TP1 (1.0), TP2 (2.0) and TP3 (3.0) times the stop distance.
- Mean Reversion: TP1 halfway to the basis, TP2 at the basis and TP3 half a band beyond it. If the basis is on the wrong side, the R multiples are used.
How a trade ends. Targets and the stop count on the touch, checked on every bar after the signal bar, in this order:
| Label | When | Counts as |
|---|---|---|
| TP3 | The third target was reached. | TP3's R |
| SL | The stop was touched before any target. | -1 R |
| SL | The stop bar also touched a target, even with a target reached earlier. | -1 R |
| TP1, TP2 | The stop was touched after that target was reached on an earlier bar. | That target's R |
| TIME | Max bars in trade (200) passed. | The close's distance from the entry, in R |
The second SL row is the stop-bar rule. A stop bar that also touches a target counts as a full stop at -1 R, because inside one bar nobody can tell which came first, so the indicator takes the worse one. Reaching TP1 or TP2 leaves the ticket open. A ticket still open after 200 bars ends at that bar's close, as a time stop. Only one ticket is open at a time, and a burst that peaks while one is open draws no signal.
A worked calculation, with round illustration values rather than prices read from a chart. A SHORT signal bar closes at 1.1000 with the ATR at 20 pips, and the burst's high is 1.1030. At the default margin of 0.30 ATR the stop sits 6 pips beyond that high, at 1.1036: a 36 pip stop distance, which is 1.8 ATR and inside the limits. With no cluster in the way the rungs fall back to R multiples: TP1 at 1.0964, TP2 at 1.0928 and TP3 at 1.0892.
Measure from your own fill. You can only act after the signal bar's close, at another price and with a spread. Say your fill is 1.0994. From there the stop is 42 pips away and TP1 only 30, so work out your own distances before you decide anything. The levels take no account of spread, slippage, commission or position size, and the stop distance changes with the ATR, so size each position from its own stop.
Where the labels sit. A ticket's labels sit 18 bars past the signal (UNIVERSAL zone width), so give the chart some room on the right with the chart shift, or switch on Pin Labels Inside Chart (off by default) to pull them in.
9. The Dashboard, Row by Row
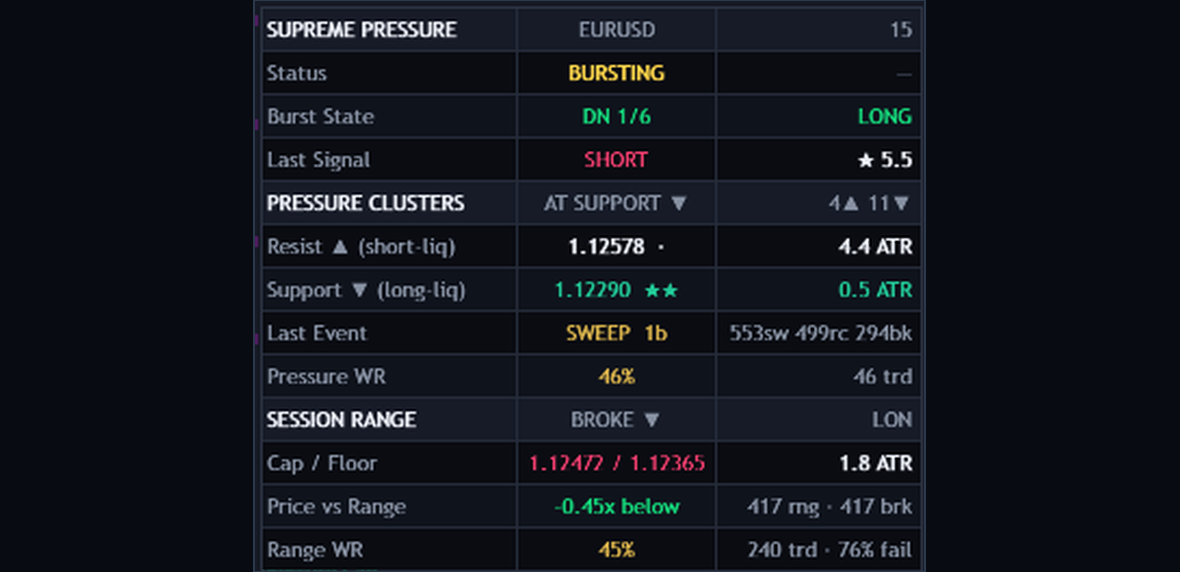
Figure 6. The top of the dashboard on a real chart: the status, the burst, the last signal, the clusters and the session range.
Position chooses one of six places. Most blocks have a switch of their own. Every row reads the newest bar, so on the forming bar it can still change.
| Row | What it says |
|---|---|
| SUPREME PRESSURE | The header, with the symbol and the timeframe. |
| Status | SCANNING, BURSTING, ARMED or IN TRADE, with the open side. |
| Burst State | UP or DN with the stack, or INSIDE, and the side a peak would signal. |
| Last Signal | The last signal's side, stars and score. |
| PRESSURE CLUSTERS | CLEAR, AT RESIST, AT SUPPORT, BOTH SIDES or the number swept, and the live clusters on each side. |
| Resist (short-liq) | The nearest resistance above the close: level, stars and distance in ATR. |
| Support (long-liq) | The same for the nearest support below. |
| Last Event | The last TOUCH, SWEEP, RECLAIM or BREAK and how many bars ago, with running totals. |
| Pressure WR | A count: among closed tickets whose burst reached a cluster, the share that ended above zero R. |
| SESSION RANGE | OFF, INTRADAY ONLY, NO RANGE YET, LAST, SET, BROKE or FAILED. |
| Cap / Floor | The range's two levels and its size in ATR. |
| Price vs Range | Inside, or how many range widths above or below, with totals of ranges and breakouts. |
| Range WR | A count: the same share among closed tickets whose burst went beyond a range. |
| LIVE SETUP QUALITY | The heading of the sliders, with the side the newest bar would signal. |
| Extension, Stack, Exhaustion, Rejection, Trend Fit, Calm Regime, Rev Room, Pressure, Range | The nine pillars as sliders for the newest bar, each with its reading. |
| SCORE | The score and stars of those sliders. |
| PERFORMANCE | The heading of the counts below. |
| Win Rate | A count: the share of closed tickets that ended above zero R, and how many closed. |
| Profit Factor | A count: the sum of R above zero against the sum below it, and the average R per ticket. |
| Total R | A sum of every closed ticket's R, and the side with the larger share above zero. |
| Long / Short WR | A count: the same share for each side. |
| Streak | A count: the current run of tickets above or below zero R, and the longest of each. |
| TP1/2/3 SL | A count: the share of closed tickets that ended at each target and at the stop. |
| MTF BURST BIAS | The heading of the strip: the chart's timeframe and the two you chose. |
| Bias | The burst on each: an up burst reads SHORT, a down burst LONG. The other two read their last closed bar. |
| WIN RATE BY STRENGTH | The heading of the count per star rank. |
| Four stars, Three stars, Two stars, One star | A count: the same share for the tickets of that rank. |
| LAST TRADES | The heading of the newest exits. |
| #1 to #6 | Each exit and its R. |
The sliders. They are the nine pillars of section 7, whose default weights Figure 7 shows, read for the newest bar. They show a setup taking shape before any signal exists.
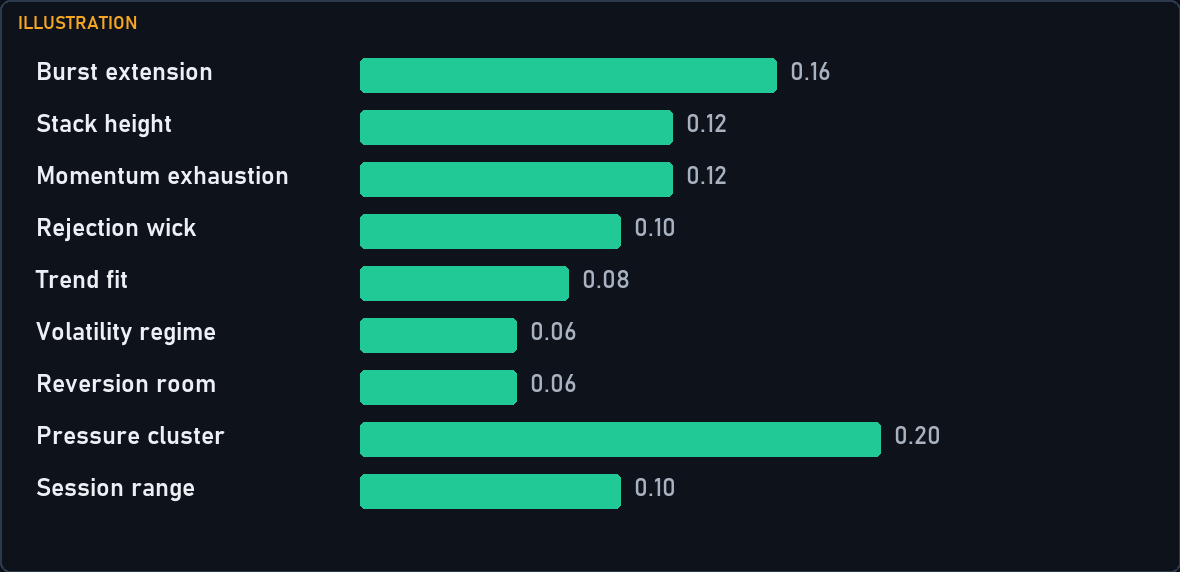
Figure 7. Illustration of the rule: the nine pillars with their default weights, and the stars the score names.
What the counts are, and what they are not. Pressure WR, Range WR, the PERFORMANCE rows and the WIN RATE BY STRENGTH block are counts of what the chart's tickets met on the bars the chart has loaded. They take no account of spread, slippage or commission. They are not a backtest, and they are not a win probability. They count a stop and a target by the rules of section 8, which no order at a broker follows, and they change with the broker, the timeframe and the depth of history. On a deep chart older tickets were drawn before the 3,000-bar cluster window starts, so they ran without clusters, and the counts mix the two. Max historical tickets drawn (16) limits the drawing, not the counts. A count describes this chart's past. It is no reason to take or skip the next signal, and this guide quotes no figure from it.
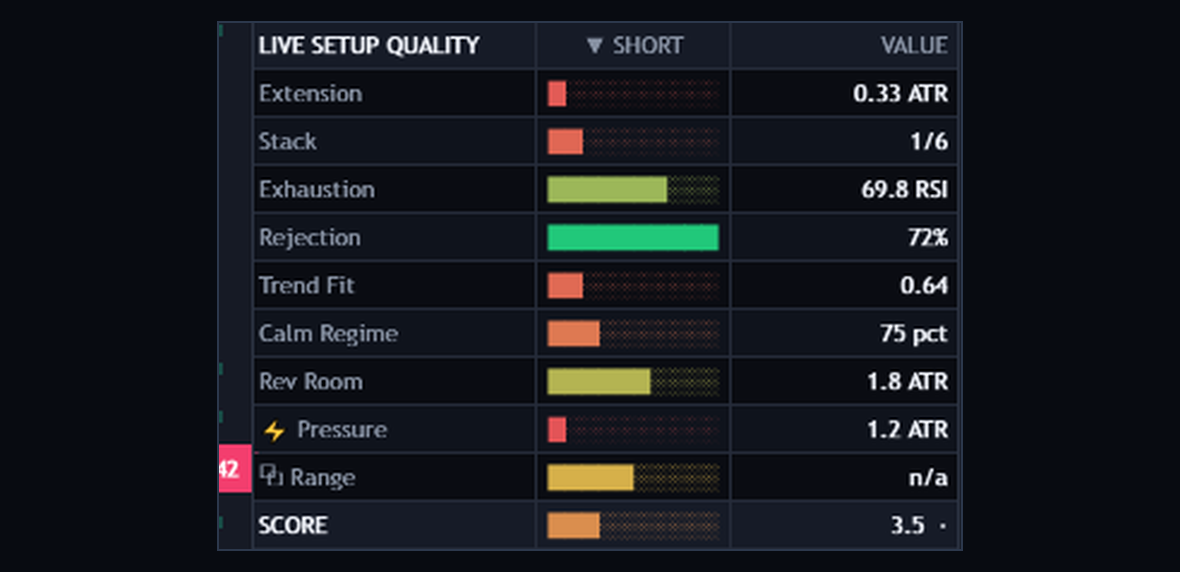
Figure 8. The live quality sliders on a real chart, with the score under them. The counts sit further down the dashboard.
AT RESIST and AT SUPPORT mean price reached the edge of any cluster on that side, even one far from the current bar, so they show often. The nearest cluster is on the rows below.
10. A Ten-Second Reading of a Signal
When a label prints or an alert arrives, read the chart in the same order every time.
- What burst is it? The side and the stack on the label.
- What did it reach? A PRESSURE tag means a cluster, a RANGE tag means beyond the session range, and no tag means it stalled in open space.
- How is it rated? The stars and the score. Hover the label for the readings that carried it.
- What stands nearby? The Resist and Support rows: the nearest clusters and their distance in ATR.
- Where is the session? SESSION RANGE and Price vs Range.
- What is the ticket? The stop's distance, whether TP1 is a cluster or an R multiple, and how far price already is from the entry.
One reading, as a walkthrough of what to look at, with round illustration values. A label reads SHORT 4/6 with a PRESSURE tag and three stars at 6.8/10. So the up burst peaked at level 4, at least 1.5 ATR beyond the band, and it reached a resistance cluster. There is no RANGE tag, so the peak did not clear a Pressure Cap. The Support row shows the nearest cluster below, which is where a Pressure Ladder TP1 sits if it is at least 0.6 R away. The ticket's stop is 1.8 ATR above the entry. What you do with that is your own plan.
Common misreadings
- Treating a label as an instruction. It says a burst peaked and your filters passed.
- Reading the forming bar as final. Touches and the dashboard can change until the bar closes.
- Reading stars as a forecast. They rate how the setup looks against nine fixed readings.
- Reading the counts as an expectation. They describe this chart's past tickets, with no costs in them.
11. Alerts
There are nineteen conditions, each with its own switch: Long, Short, Any Signal, Long + Cluster, Short + Cluster, TP3 Hit, Partial TP Exit, SL Hit, Extreme Up Burst, Extreme Down Burst, Cluster Sweep, Bullish Cluster Reclaim, Bearish Cluster Reclaim, Cluster Break, Near Strong Cluster, Session Range Set, Range Breakout, Failed Range Breakout and Time Stop Exit. Long and Short are on by default.
Four channels deliver them: a pop-up (on by default), a sound of your choice, a push notification to your phone, and e-mail. Push and e-mail use the terminal's own settings, and Test Alerts on Start checks your settings without waiting for a signal. Alert Frequency chooses once per bar, once per bar close, only once or once per minute.
Signals, extreme bursts, ranges and the time stop alert when the bar closes. Stops, targets and cluster events alert on the touch. TP1 and TP2 have no alert of their own: Partial TP Exit fires when the stop is touched after a target was reached. Alert minimum stars quiets Long, Short and the two cluster signals below that rank, while Any Signal ignores it. Nothing fires for history or in the Strategy Tester. A message ends with the chart's symbol and timeframe:
Supreme Pressure Signals: LONG (down-burst exhaustion) on EURUSD 60 @ 1.12345. | EURUSD H1 Supreme Pressure Signals: SL hit on EURUSD 60. | EURUSD H1
An alert is the moment to run the ten-second read, not an instruction. The drawing switches change what you see, not what fires: with Show signal labels off, a signal still alerts.
12. What It Does Not Do
- It does not place trades. It draws and alerts; you place and manage every order.
- It does not promise a result. A burst, a cluster, a star or a target says where price has been, not where it will go.
- It does not see the future. A signal waits for the closed bar. On the forming bar the dashboard and the touches move with every tick.
- It does not read anything but your chart. Cluster weights read your broker's tick volume and everything reads your broker's candles, so another feed can draw differently. It needs no DLL, no internet access and no files.
13. Common Settings Changes, and What Each Trades Away
Install the indicator from its Market page (MetaTrader 5: {{MT5_URL}}, MetaTrader 4: {{MT4_URL}}) and attach it with the defaults. All 160 inputs are described in the user manual ({{MANUAL_URL}}). A filter says nothing about what comes after the signals it keeps, so judge any setting on your own market, on a demo account.
| Input | Default | What changing it trades away |
|---|---|---|
| Min stack height to signal | 3 | Lower shows smaller bursts as well. Higher keeps only the far bursts and leaves long stretches with no signal. |
| Require rejection wick on the peak bar | false | On drops bursts that stalled with a full body. |
| Require RSI exhaustion | false | On drops bursts that never stretched the RSI. |
| GATE - burst must hit / sweep an opposing cluster | false | On ties every signal to a cluster, and shows none where the chart has no clusters. |
| GATE - burst must extend beyond the session range | false | On keeps only bursts past the Cap or Floor, and shows none before a first range or on D1 and above. |
| GATE - only trade inside an enabled trading session | false | On hides everything outside the windows, and shows none on D1 and above. |
| Minimum stars to take | 0 | Higher opens no ticket for the lower ranks, so the picture and the counts change with it. |
| Minimum spacing between signals (bars) | 20 | Shorter shows signals closer together, sometimes several from one stretched move. Longer leaves bursts unmarked after a signal. |
| Target ladder | Pressure Ladder | R Multiples gives even distances and drops the link to clusters. Mean Reversion stays near the basis, so a target can sit far nearer than the stop. |
Change one setting at a time, and start from the defaults on the timeframe you trade.
14. Conclusion
A burst beyond its band says little on its own. Supreme Pressure Signals waits for it to stall, says what it ran into and maps the levels you need for a plan, by fixed rules. The decision stays yours. Test it on a demo account first and keep a journal of the signals you take.
Risk Disclaimer
Trading leveraged products carries a high level of risk and may not be suitable for all investors. Supreme Pressure Signals is an analysis tool, not financial advice. Test it on a demo account first.