Supreme Power House User Manual for MetaTrader 4 and MetaTrader 5

1. What Supreme Power House Is
Supreme Power House is a chart indicator for MetaTrader 4 and MetaTrader 5. It prints BUY and SELL signals when a candle closes beyond the last unbroken swing, grades each signal from A to C against seven checks, and draws a plan for it: an entry, a stop, three targets and the zones between them. An adaptive trend ribbon colours the trend and the candles, the ICT zones of the current leg are shaded, and a dashboard rates six timeframes.
It does not place trades and has no access to your account. Every signal is decided on a closed bar.
This manual covers installation, every drawing on the chart, every input, the alerts and the questions that come up most. For the trading method behind it, read the trading guide:
2. Installation
- Buy or rent the indicator on its MQL5 Market page with your MQL5 account.
- In MetaTrader, log in to the same MQL5 account (Tools, Options, Community).
- Open the Toolbox (Ctrl+T), go to the Market tab, find Supreme Power House under Purchased and click Install.
- In the Navigator (Ctrl+N), open Indicators, then Market, and drag Supreme Power House onto a chart.
- Click OK to start with the defaults. You can change any input later with Ctrl+I on the chart.
It runs on any symbol and any timeframe from M1 to monthly. On a terminal that has never opened the symbol's other timeframes, the dashboard and the higher-timeframe filter wait a few seconds for that history and redraw by themselves when it arrives.
3. What You See on the Chart
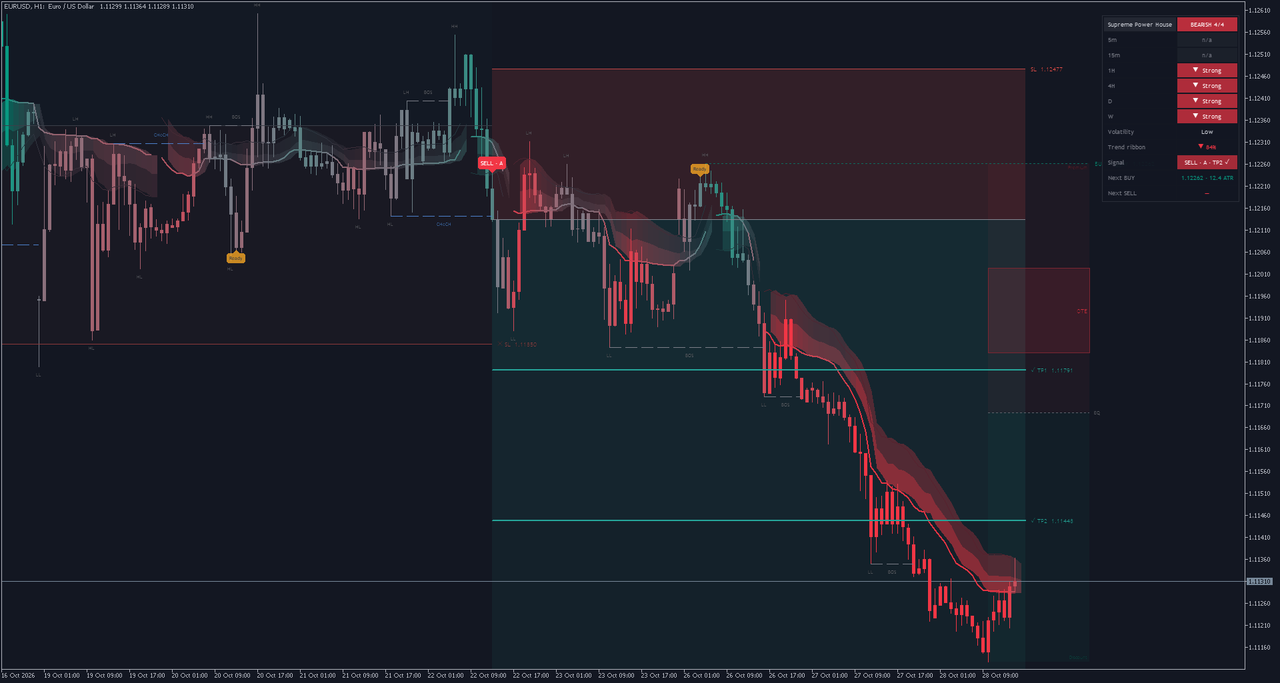
- BUY and SELL plates on the signal bar, with the grade. Hover a plate for its checklist: the kind of break, the entry, the stop and which of the seven checks agree.
- The plan: the entry line, the stop line and its label, a red risk zone, one green reward band per target and a dashed line for each target, labelled with its price. A reached target gets a tick, a reached stop a cross.
- Structure: dashed CHoCH lines (blue) and BOS lines (grey) from the broken swing to the bar that broke it, and HH, HL, LH or LL on every confirmed swing.
- Get Ready plates (amber) before a likely signal, when price is within half an ATR of an unbroken swing and the filters already agree.
- Trigger lines: dotted lines at the swing high and the swing low that the next BUY and SELL need a close beyond, labelled with their prices.
- The trend ribbon: an adaptive moving average with a two-layer band coloured from red through grey to green, and the candles coloured to match.
- ICT zones of the current leg: the OTE zone from 62 to 79 percent, the equilibrium line at 50 percent, and premium and discount shading.
- The dashboard in a corner of the chart.
On MetaTrader 5 the ribbon's band is painted with its real transparency behind the candles. MetaTrader 4 has no way to paint a translucent band, so there the band is drawn in colour steps behind the candles; everything else is the same.
4. The Dashboard, Row by Row
| Row | What it shows |
|---|---|
| Header | The indicator's name and the bias: how many of the timeframes below point the same way, for example BULLISH 3/4. |
| Six timeframes | M5, M15, H1, H4, D1 and W1 by default. Each is rated by its close against its 50-period EMA on closed bars: Strong when the EMA also points that way, Weak when it does not. A timeframe below the chart's own shows n/a. |
| Volatility | Low, Normal or High, from where the current ATR sits among the last 100 bars (below 30 percent, above 70 percent, or between). |
| Trend ribbon | The ribbon's direction and conviction in percent, or Sideways when it is weak. |
| Signal | The newest signal, its grade and its state: live, TP1 to TP3 with a tick, or SL. |
| Next BUY / Next SELL | The trigger prices of the next signals and how far away they are in ATR. |
Every cell has a tooltip. The position and the text size are inputs.
5. When Things Are Calculated
- Signals, grades, plans, structure, Get Ready plates, the trigger lines, the ICT zones and the dashboard are calculated when a bar closes. Nothing of a signal changes while a bar is forming.
- The trend ribbon and the candle colours also follow the forming bar, and settle when it closes.
- A swing is confirmed five bars after it forms (with the default structure length).
- Alerts fire once, for the closed bar, and never for history or in the Strategy Tester.
6. Inputs
The inputs are in nine groups. The first seven are the indicator's own settings; MetaTrader holds the platform settings and Alerts the alert switches.
1. Signals
| Input | Default | What it does |
|---|---|---|
| Signals | CHoCH + BOS | Which breaks may print a signal: both, only changes of character, or only breaks of structure. |
| Structure length (bars each side of a swing, 2-50) | 5 | Bars on each side of a swing. Smaller finds more, smaller swings; larger fewer, bigger ones. |
| One signal per direction until the opposite signal | Yes | After a BUY, the next signal must be a SELL (and the other way round). |
| Get Ready pre-signals | Yes | Draw the Get Ready plates before a likely signal. |
| Get Ready: within ATR of the swing | 0.5 | How close to the unbroken swing price must come for Get Ready, in ATR. |
| Show grade on signals | Yes | Write the grade (A, B or C) on the BUY and SELL plates. |
| Structure lines (CHoCH / BOS) | Yes | Draw the dashed CHoCH and BOS lines with their labels. |
| Swing labels (HH / HL / LH / LL) | Yes | Write HH, HL, LH and LL on every confirmed swing. |
| Next BUY / SELL trigger levels | Yes | Draw the dotted lines at the next BUY and SELL trigger levels. |
2. Filters (every enabled filter must agree)
| Input | Default | What it does |
|---|---|---|
| Momentum | Yes | Momentum filter: the move over the last bars must be large enough. |
| Momentum bars | 5 | How many bars back the momentum filter compares the close with. |
| Momentum ATR | 0.5 | The momentum the filter needs, in ATR. |
| Higher-timeframe trend | Yes | Higher-timeframe filter: the last closed bar of the higher timeframe must sit on the signal's side of its EMA. |
| Higher-timeframe | H1 | The higher timeframe that filter reads. |
| Higher-timeframe EMA | 50 | The EMA length on the higher timeframe. |
| Lower-timeframe trend | No | Lower-timeframe filter: the lower timeframe's close must sit on the signal's side of its EMA. |
| Lower-timeframe | M1 | The lower timeframe that filter reads. |
| Lower-timeframe EMA | 20 | The EMA length on the lower timeframe. |
| Volume | No | Volume filter: the signal bar's tick volume must stand out from its 20-bar average. |
| Volume x average | 1.2 | How many times the average the volume must reach. |
| Breakout (close beyond the recent high / low) | No | Breakout filter: the close must also break the highest high (lowest low) of recent bars. |
| Breakout bars | 20 | How many bars the breakout filter looks back. |
| Order flow (CVD from lower-timeframe candles) | No | Order-flow filter: the cumulative volume delta from lower-timeframe candles must point the signal's way. |
| Order flow bars | 20 | Over how many bars the order-flow change is measured. |
| Trend ribbon (blocks only a clearly opposite ribbon) | Yes | Trend-ribbon filter: blocks a signal only when the ribbon is clearly against it. |
| Session window | No | Session filter: signals only inside the session window. |
| Session (HHMM-HHMM) | 0700-1600 | The session window, start and end in hours and minutes. |
| Session timezone (e.g. America/New_York, Europe/London, UTC) | America/New_York | The timezone of the session window (a city name such as America/New_York, or UTC). |
3. Trend ribbon
| Input | Default | What it does |
|---|---|---|
| Ribbon | Yes | Draw the adaptive trend ribbon and its two-layer band. |
| Candle colours | Yes | Colour the candles with the ribbon's colour. |
| Adaptive length | 10 | The efficiency window of the adaptive average: how many bars it measures trend against noise over. |
| Adaptive slow | 30 | The slowest speed of the adaptive average. |
| Flip band (ATR): a direction change needs a close this far beyond | 0.6 | How far beyond the ribbon (in ATR) a close must go to turn the ribbon's direction. |
| Colour smoothing (bars, 1-50) | 10 | Smoothing of the ribbon's colour. |
4. Trade plan
| Input | Default | What it does |
|---|---|---|
| Stop (Structure: beyond the swing; ATR x: fixed multiple) | Structure | Stop beyond the last opposite swing, or a fixed ATR multiple. |
| Stop ATR x | 1.5 | The ATR multiple of the fixed stop. |
| Stop distance (ATR): min | 0.5 | The structure stop is never closer than this, in ATR. |
| Stop distance (ATR): max | 3.0 | The structure stop is never further than this, in ATR. |
| Targets in | R multiple | The unit of the three targets: risk multiples (R), ATR multiples, or price distance. |
| TP1 | Yes | Use the first target. |
| TP1 value | 1.0 | The first target's distance in the chosen unit. |
| TP2 | Yes | Use the second target. |
| TP2 value | 2.0 | The second target's distance. |
| TP3 | Yes | Use the third target. |
| TP3 value | 3.0 | The third target's distance. |
| Show trade plan | Yes | Draw the trade plan: entry, stop, zones, target lines and labels. |
| Hit rate on targets | No | Add to each target label how often this chart's past plans reached it (after 20 closed plans). |
| Plan length (bars, 5-200) | 20 | How many bars the plan's lines and zones run to the right. |
| Signals kept on chart (1-50) | 5 | How many signals and plans stay on the chart. |
5. ICT
| Input | Default | What it does |
|---|---|---|
| OTE zone of the current leg | Yes | Draw the optimal trade entry zone of the current leg. |
| OTE from | 0.62 | The start of the OTE zone, as a fraction of the leg. |
| OTE to | 0.79 | The end of the OTE zone, as a fraction of the leg. |
| Equilibrium (50%) | Yes | Draw the equilibrium line at the middle of the leg. |
| Premium / discount shading | Yes | Shade the premium half above equilibrium and the discount half below it. |
6. Dashboard
| Input | Default | What it does |
|---|---|---|
| Dashboard | Yes | Show the dashboard. |
| Dashboard position | Top right | The corner the dashboard sits in. |
| Dashboard text size | Small | The dashboard's text size. |
| Matrix 1 | M5 | The first timeframe of the dashboard's trend matrix. |
| Matrix 2 | M15 | The second matrix timeframe. |
| Matrix 3 | H1 | The third matrix timeframe. |
| Matrix 4 | H4 | The fourth matrix timeframe. |
| Matrix 5 | D1 | The fifth matrix timeframe. |
| Matrix 6 | W1 | The sixth matrix timeframe. |
| Matrix EMA | 50 | The EMA length the matrix rates each timeframe against. |
7. Colours
| Input | Default | What it does |
|---|---|---|
| Buy | #089981 | Colour of BUY plates, bullish ribbon and up candles. |
| Sell | #F23645 | Colour of SELL plates, bearish ribbon and down candles. |
| Get Ready | #F5A623 | Colour of the Get Ready plates. |
| CHoCH | #5B9CF6 | Colour of CHoCH lines and labels. |
| BOS | #9598A1 | Colour of BOS lines and labels. |
| Targets | #26A69A | Colour of the target lines, labels and reward zones. |
| Stop | #EF5350 | Colour of the stop line, label and risk zone. |
| Entry | #B2B5BE | Colour of the entry line. |
MetaTrader
| Input | Default | What it does |
|---|---|---|
| Bars to calculate (0 = all) | 20,000 | How many of the newest bars are calculated (0 = the whole chart). Fewer bars load faster. |
| Broker server time zone (for the session window) | Auto (from the broker clock) | Your broker's clock, for the session window. Auto reads it from the terminal. |
| Keep object limits (500 boxes, 500 lines, 500 labels) | Yes | Keep at most 500 boxes, lines and labels, removing the oldest first. Off keeps everything. |
Alerts
| Input | Default | What it does |
|---|---|---|
| Enable alerts | Yes | The master switch of every alert. |
| Alert: BUY signal | Yes | Alert when a BUY signal prints. |
| Alert: SELL signal | Yes | Alert when a SELL signal prints. |
| Alert: Get Ready BUY | No | Alert on a Get Ready BUY. |
| Alert: Get Ready SELL | No | Alert on a Get Ready SELL. |
| Alert: TP1 hit | No | Alert when the newest plan reaches TP1. |
| Alert: TP2 hit | No | Alert when it reaches TP2. |
| Alert: TP3 hit | No | Alert when it reaches TP3. |
| Alert: Stop hit | No | Alert when a plan's stop is reached. |
| Channel: popup window | Yes | Deliver alerts in the terminal's alert window. |
| Channel: sound | No | Play a sound with each alert. |
| Sound file (in the terminal's Sounds folder) | alert.wav | The sound file, from the terminal's Sounds folder. |
| Channel: push notification | No | Send alerts to the MetaTrader app on your phone (set your MetaQuotes ID in the terminal's options). |
| Channel: e-mail | No | Send alerts by e-mail (set up the e-mail tab in the terminal's options). |
7. Setting Up Alerts
- In the indicator's inputs, keep Enable alerts on and switch on the events you want. BUY and SELL are on by default.
- Choose the channels. The alert window is on by default.
- Sound: switch it on and enter a file name from the terminal's Sounds folder (for example alert.wav).
- Push notification: in MetaTrader, open Tools, Options, Notifications, enable push notifications and enter the MetaQuotes ID shown in the MetaTrader app on your phone. Then switch the push channel on in the inputs.
- E-mail: in Tools, Options, Email, enter your mail server and addresses and send a test. Then switch the e-mail channel on in the inputs.
An alert names the event, the kind of break, the grade, the entry and the stop, the symbol, the timeframe and the price, for example:
Supreme Power House: SELL signal (CHoCH, grade A, entry 1.12134, stop 1.12477) on EURUSD H1 @ 1.12134
8. Performance and Long Charts
- Bars to calculate (20,000 by default) limits the calculation to the newest bars, so the indicator loads quickly on charts with a long history. Set 0 to calculate the whole chart.
- Keep object limits keeps at most 500 boxes, 500 lines and 500 labels and removes the oldest first. Switch it off to keep every drawing.
- Signals kept on chart (5 by default) decides how many signals and plans stay drawn.
9. Session Window and Your Broker's Clock
The session filter is off by default. When you switch it on, signals print only inside the session window, which is given in a timezone of your choice (America/New_York by default). MetaTrader charts carry your broker's clock, so the indicator converts that clock to UTC first. Broker server time zone is Auto by default, which reads the offset from the terminal; most brokers run on GMT+2 in winter and GMT+3 in summer (the New York close), and that choice can also be set directly. If your broker uses a fixed offset, choose it.
10. Frequently Asked Questions
The dashboard shows n/a for M5 and M15. Those rows are below the chart's timeframe. On an H1 chart only H1 and higher are rated.
My signals differ from another broker's chart. The filters and the volume checks use your broker's own prices and tick volume. A different feed can grade or time a signal differently.
Nothing appears for a moment on a new chart. The higher timeframes and the lower-timeframe candles of the symbol are loading. The indicator redraws by itself when they arrive.
Why is there no signal after the last break? A break prints a signal only when every enabled filter agrees, and only one signal per direction is printed until the opposite one. The trigger lines and the dashboard show where the next signal would come from.
Grade C never appears. With the three default filters on, a printed signal already has at least three checks behind it, so it is at least a B. C appears only when filters are switched off.
Do the signals repaint? No. Signals, grades and plans are decided on closed bars and are never moved or removed by later bars. Only the ribbon and the candle colours move with the forming bar.
Can I use it in the Strategy Tester? Yes, in visual mode. Alerts never fire in the tester.
11. Version History
- 1.00: first release for MetaTrader 4 and MetaTrader 5.
Risk Disclaimer
Trading leveraged products such as forex and CFDs carries a high level of risk and may not be suitable for all investors. Supreme Power House is an analysis tool, not financial advice. Test it on a demo account before trading real money.