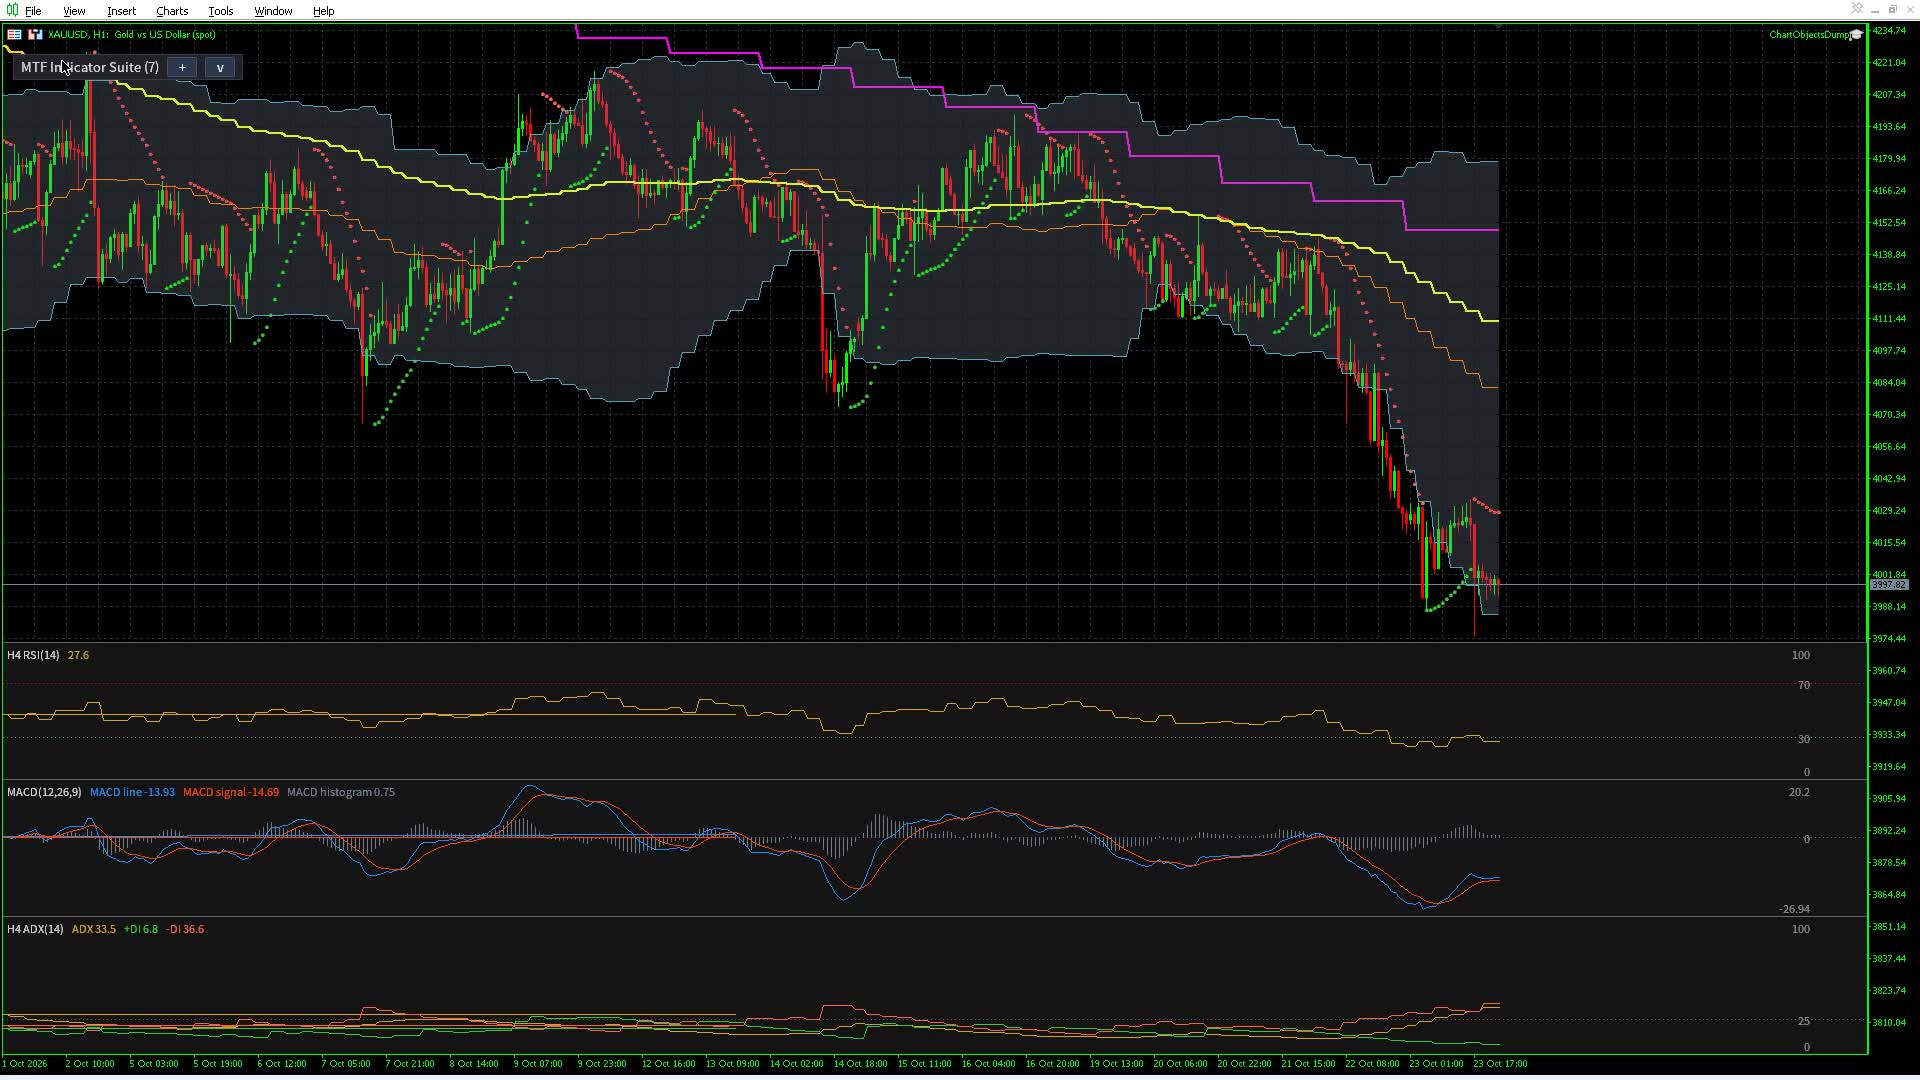
Multi Timeframe Indicator Suite draws indicators from any timeframe on one chart. You pick an indicator, a timeframe and how many bars to draw. Moving averages, bands, channels, VWAP, Supertrend, Parabolic SAR and Ichimoku draw over the candles; oscillators, ATR and volume draw in docks stacked at the bottom of the main chart window, not in subwindows. An H4 SMA on an M15 chart draws as a step line that changes when each H4 bar closes. It places no orders.
It is free on both platforms:
- MT5: https://www.mql5.com/en/market/product/203076
- MT4: https://www.mql5.com/en/market/product/203387
The video tutorial shows everything below on a live chart, in the same order: https://www.youtube.com/watch?v=xzpfciuhA60
Contents
- Install and attach
- Add an entry
- Docks
- What the editor refuses
- Show, hide, order and remove
- The indicators
- VWAP
- Presets
- Theme and panel
- Timeframes, symbols and templates
- Where your settings are saved
- MT4 differences
- Troubleshooting
1. Install and attach
Select Market in the terminal's Navigator, open Multi Timeframe Indicator Suite MT5 (or MT4) and download it. The terminal puts it in MQL5\Indicators\Market (MQL4\Indicators\Market on MT4) and lists it in the Navigator under Market, My Purchase, by its short name, MTF Indicator Suite. Drag it onto a chart. You can remove the chart's other indicators first; this one draws its own.
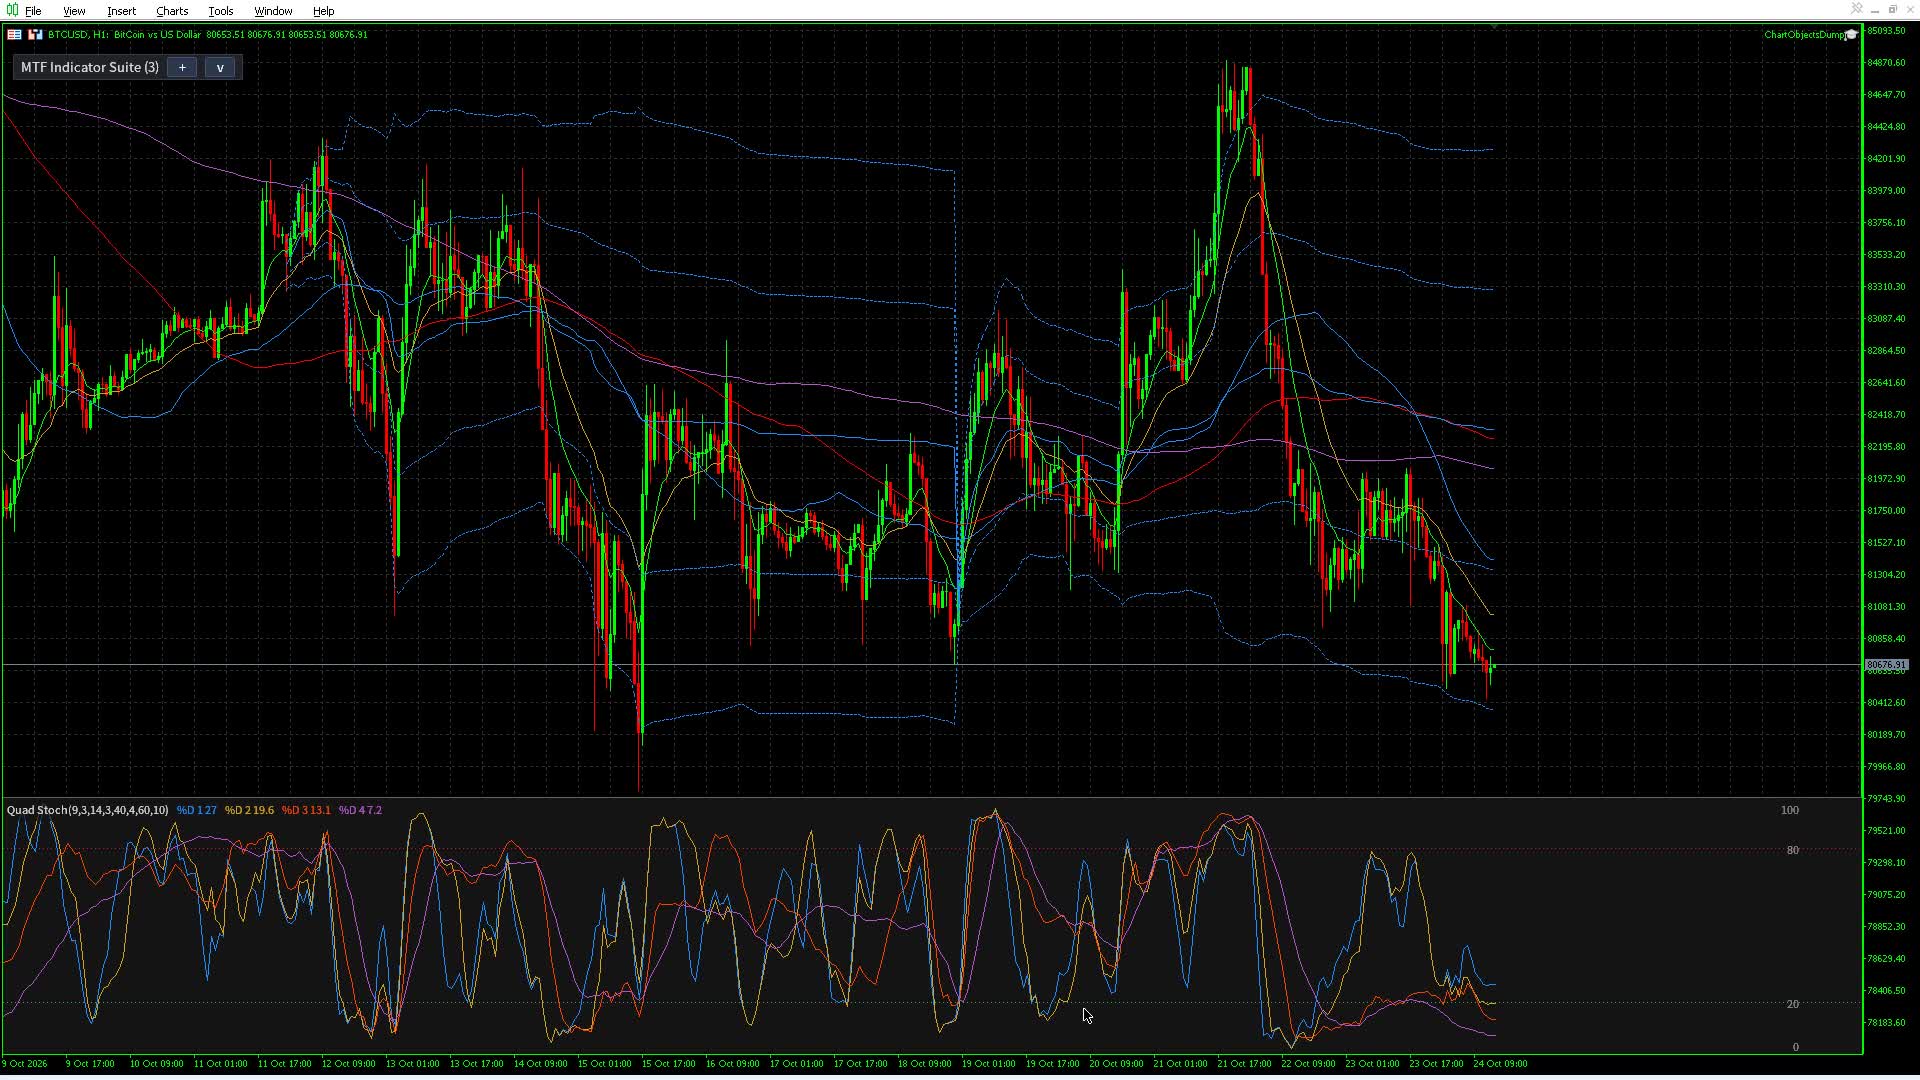
A chart with no saved list starts with the Default preset, the same way MetaTrader opens new charts with its default template: an MA Ribbon (EMA 9 and 21, SMA 50, 100 and 200), a weekly VWAP with its bands, and the quad stochastic in a dock.
The indicator has two inputs: Log level (Warning by default) and Log retention in days (7). Everything else is set in the panel at the top-left of the chart and saved for you.
2. Add an entry
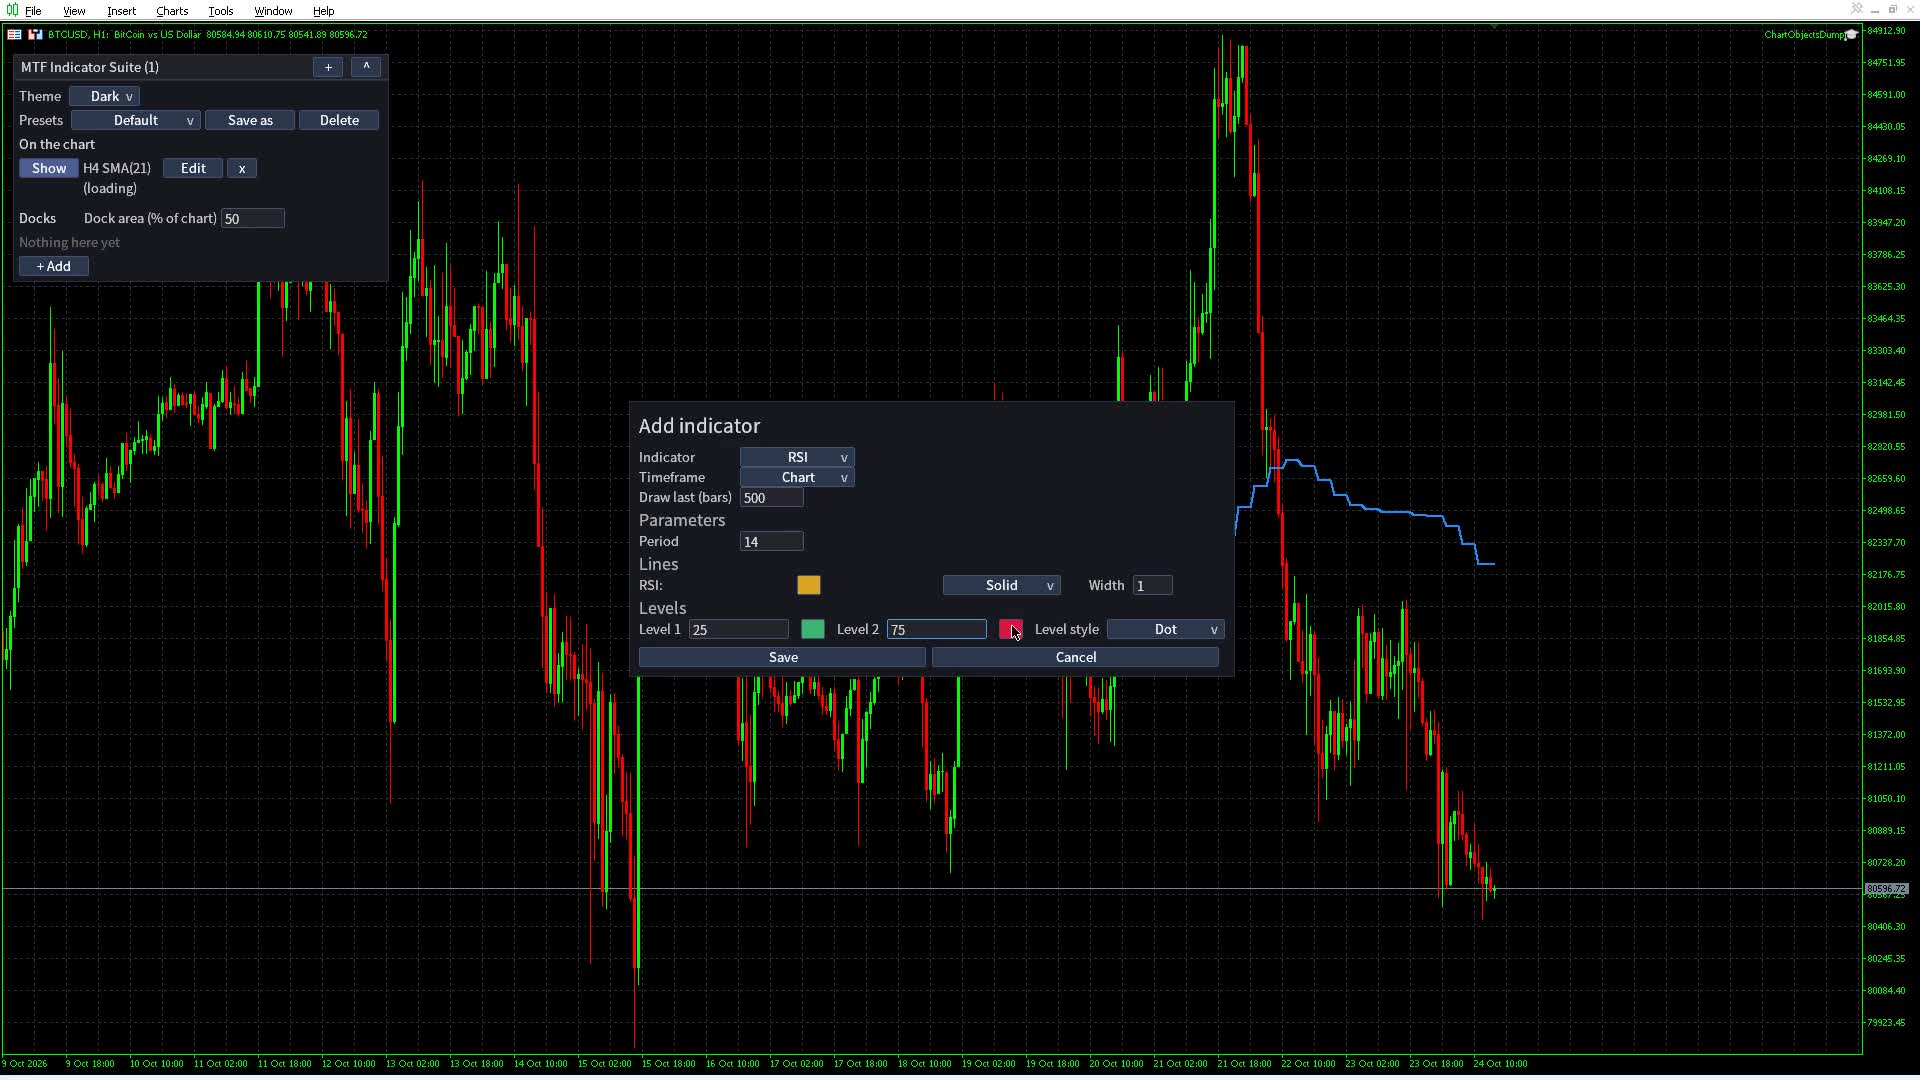
Click + Add at the end of the panel's list. The editor opens on an SMA.
- Pick the indicator. Its fields follow: changing the indicator resets them to that indicator's defaults.
- Pick the timeframe. Chart follows the chart's own timeframe; any other timeframe is fixed.
- Set Draw last (bars): how many bars to draw, counted in bars of the entry's own timeframe. 500 by default, All, or 10 to 100000.
- Set the indicator's parameters, then the color, style and width of each line. A color field is one swatch; clicking it opens the web color grid.
- Click Save. Cancel on a new entry adds nothing.
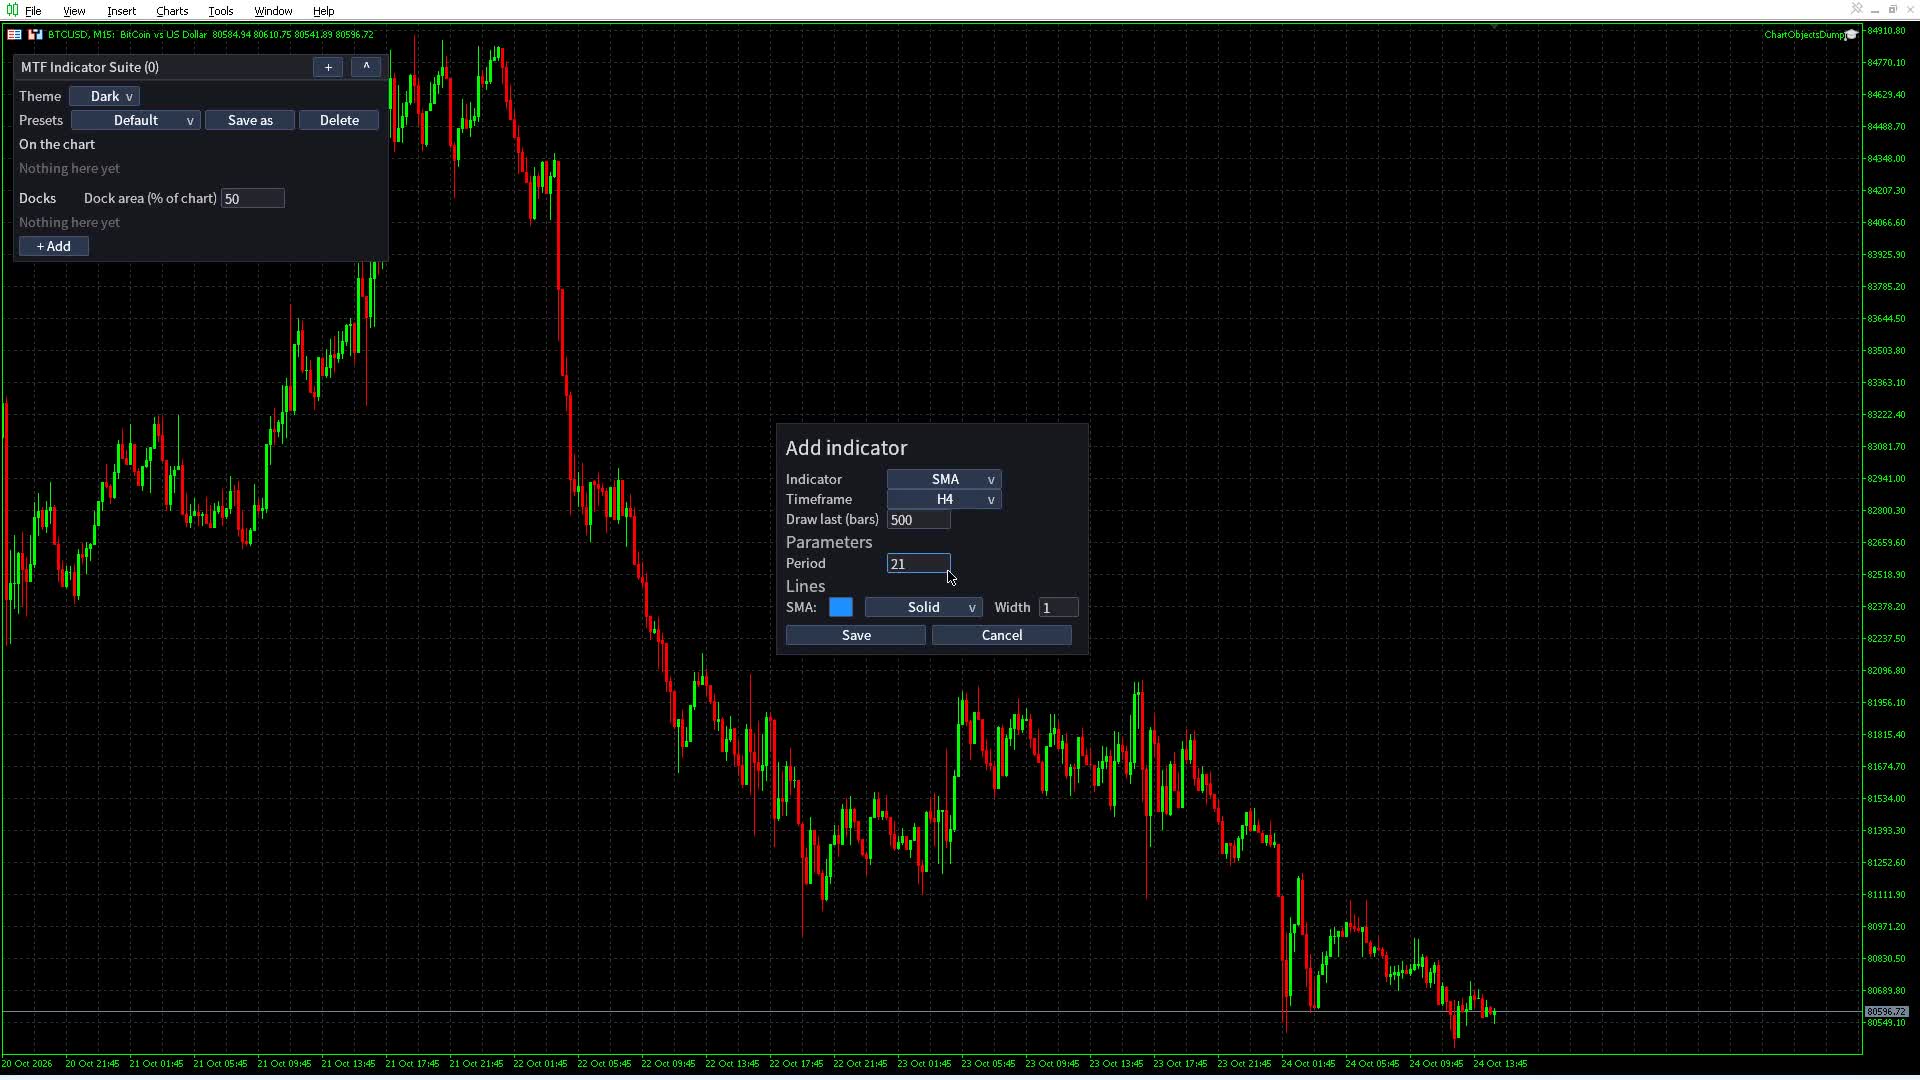
After Save, an H4 SMA 21 on an M15 chart draws as steps. Each step starts when an H4 bar closes, because the indicator draws only values that were known at that time: each chart bar shows the value of the last H4 bar that had closed by the chart bar's close. Values change only when a bar of the entry's timeframe closes, so ticks do not recompute an entry.
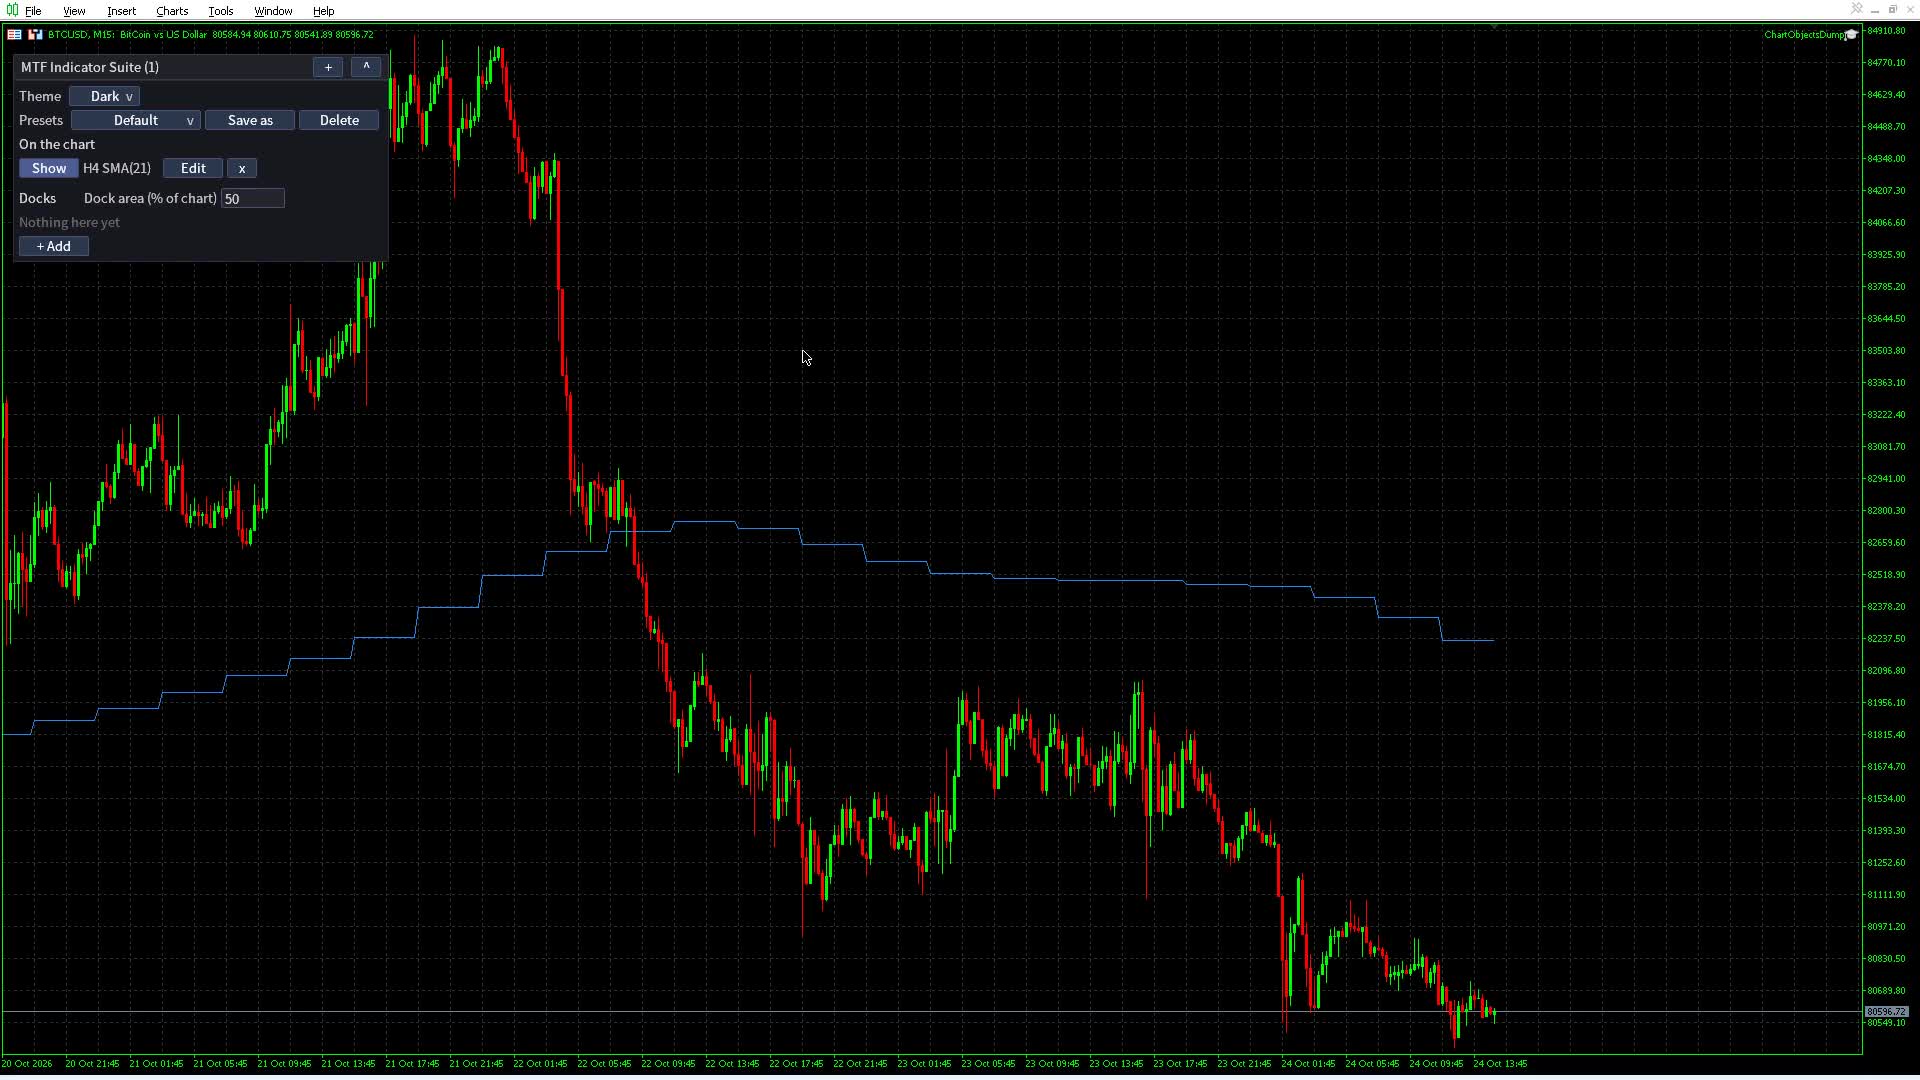
Every timeframe is offered on every chart, and the same indicator can be added more than once (for example an H4 SMA 21 and a D1 SMA 50). A line over the candles on a timeframe below the chart's is skipped: an M5 average is not loaded or drawn on a D1 chart. It keeps its place in the list and comes back when you switch to M5 or lower. Docks draw on every chart, because each dock has its own scale.
Warm-up is not a setting. Each indicator loads the extra bars its formula needs, so the values you see equal the values computed on the full history. Every value matches the pandas-ta library.
3. Docks
RSI, Stochastic, Quad Stoch, Stoch RSI, MACD, CCI, Williams %R, MFI, ADX, ATR, OBV and Volume draw in docks at the bottom of the main chart window. The docks follow the list order from top to bottom and share the dock area together. Each dock shows its title with the timeframe, the current values, its scale and its level lines.
- Level lines are set in the editor (RSI 30 and 70, Stoch 20 and 80, MACD 0 and so on). Each level has its own color. By default the upper line of an overbought/oversold pair is red, the lower one green, and a middle or single line gray.
- Dock area (% of chart) in the Docks header sets how much of the chart the docks take together, 25% on a new chart. One dock fills the whole area.
- Small docks drop the scale labels first, then the level labels, and keep the title and the lines.
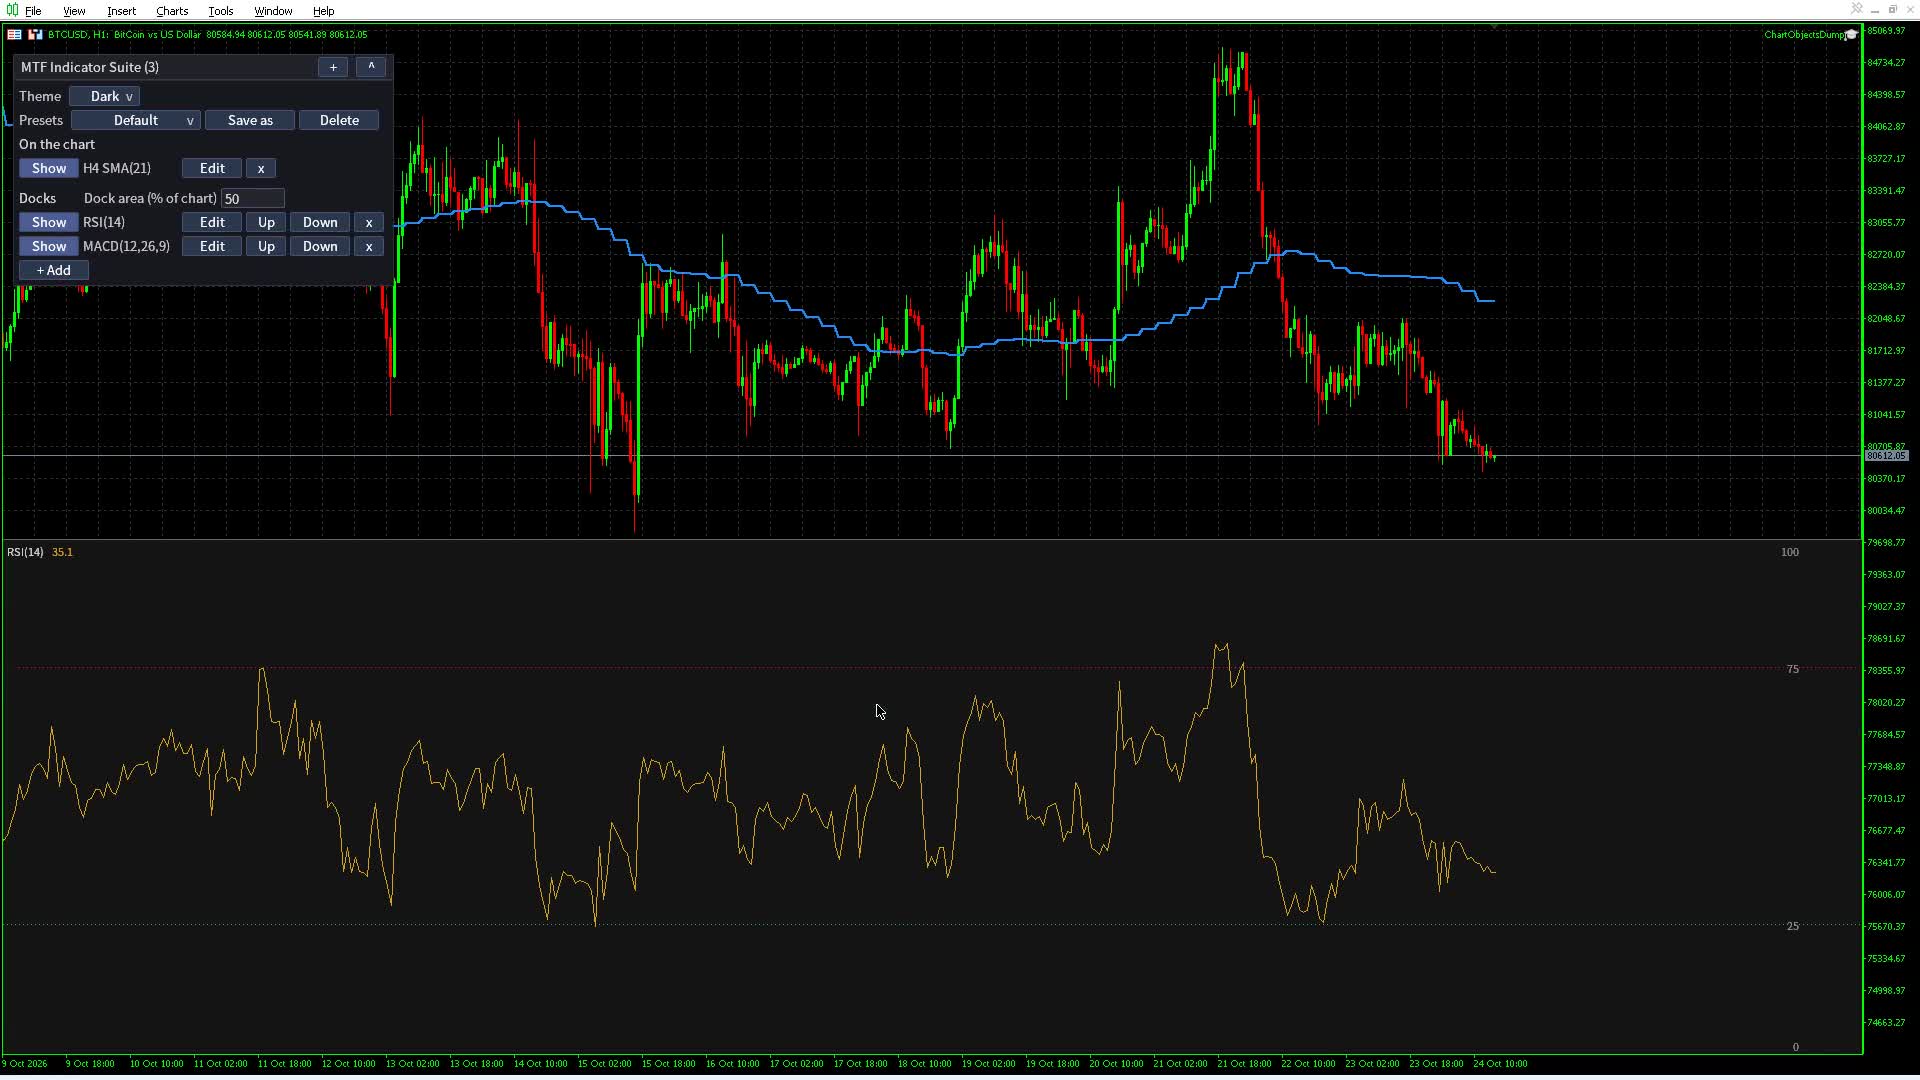
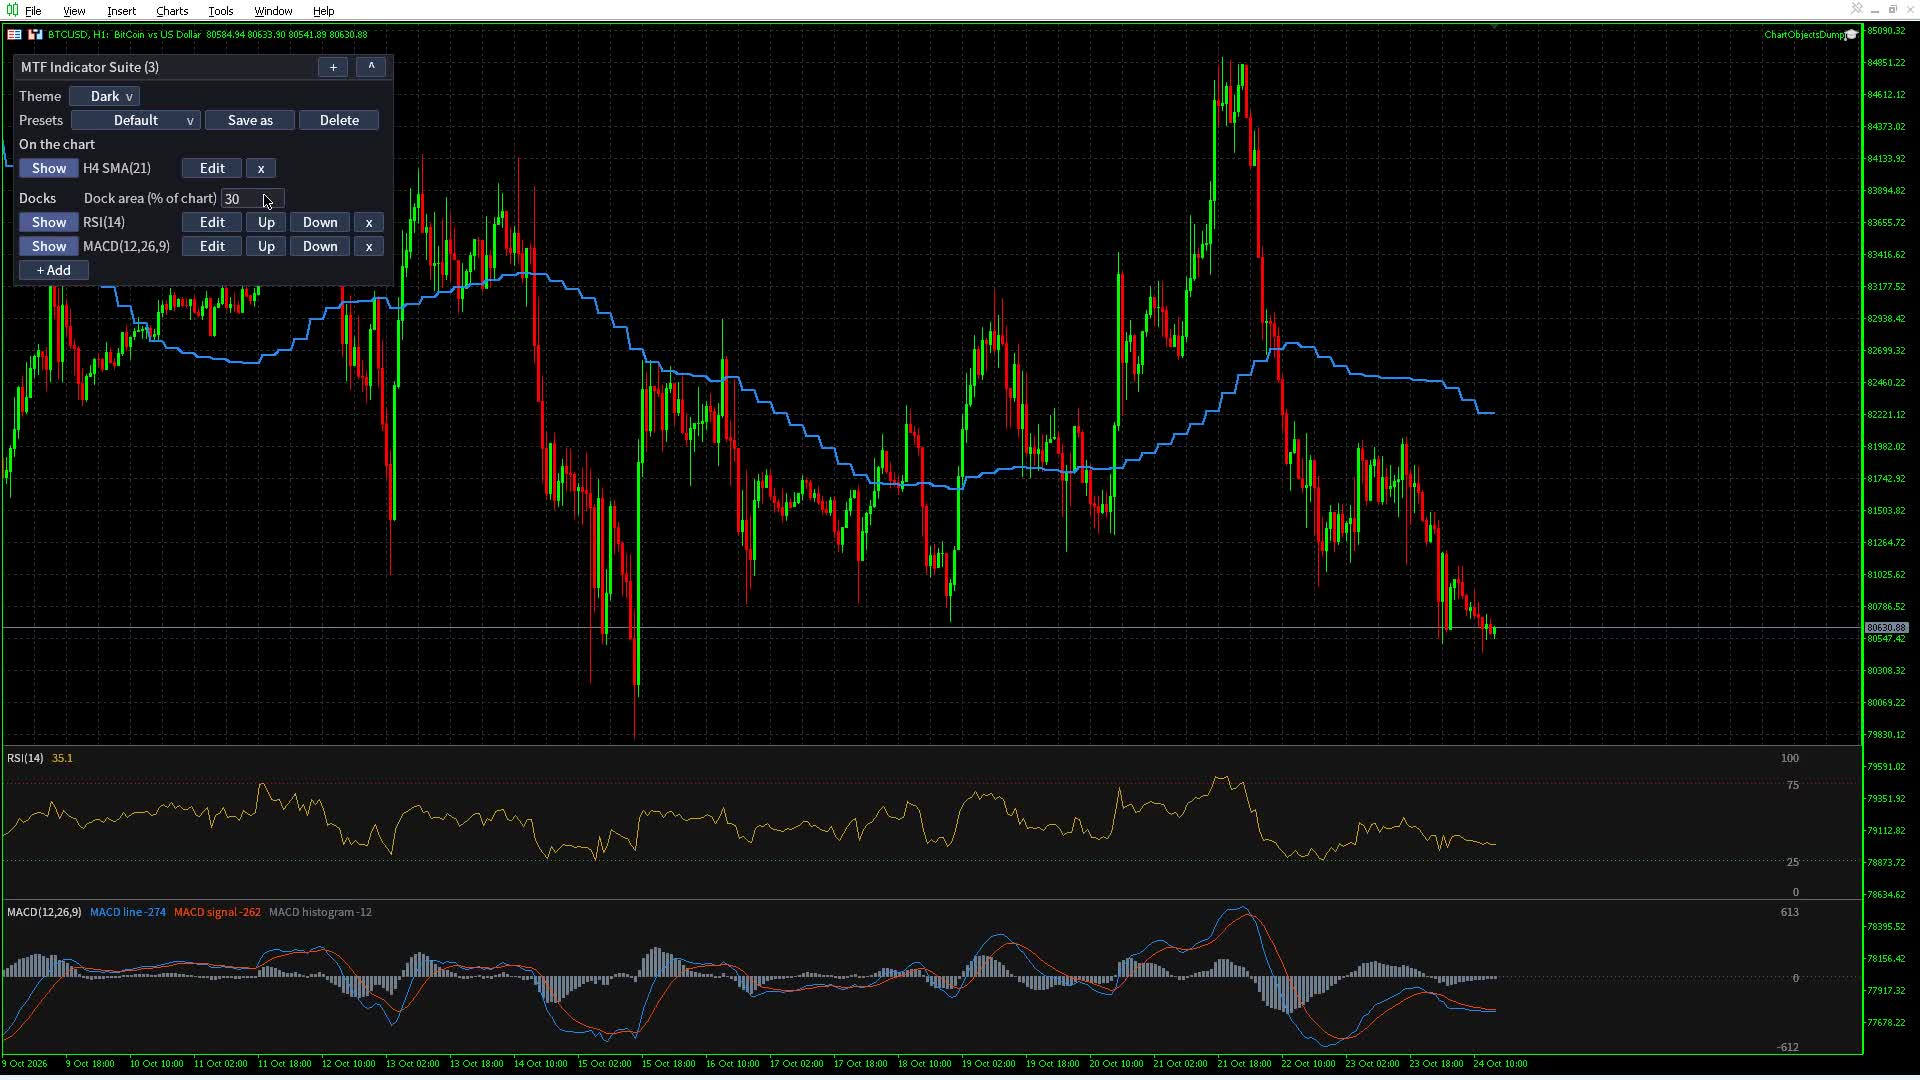
While docks are shown, the indicator keeps the candles above them with a 6-pixel gap. The price scale follows the candles; moving averages, bands and VWAP are drawn where they fall and never squeeze the candles. Scrolling, zooming and new bars update it. If you drag the price scale to zoom out, the indicator keeps your scale until you restore it (double-click the price scale, or keypad 5). Hiding every dock or removing the indicator gives the chart its own scale settings back. MetaTrader's own volume display is off while the indicator holds the scale.
4. What the editor refuses
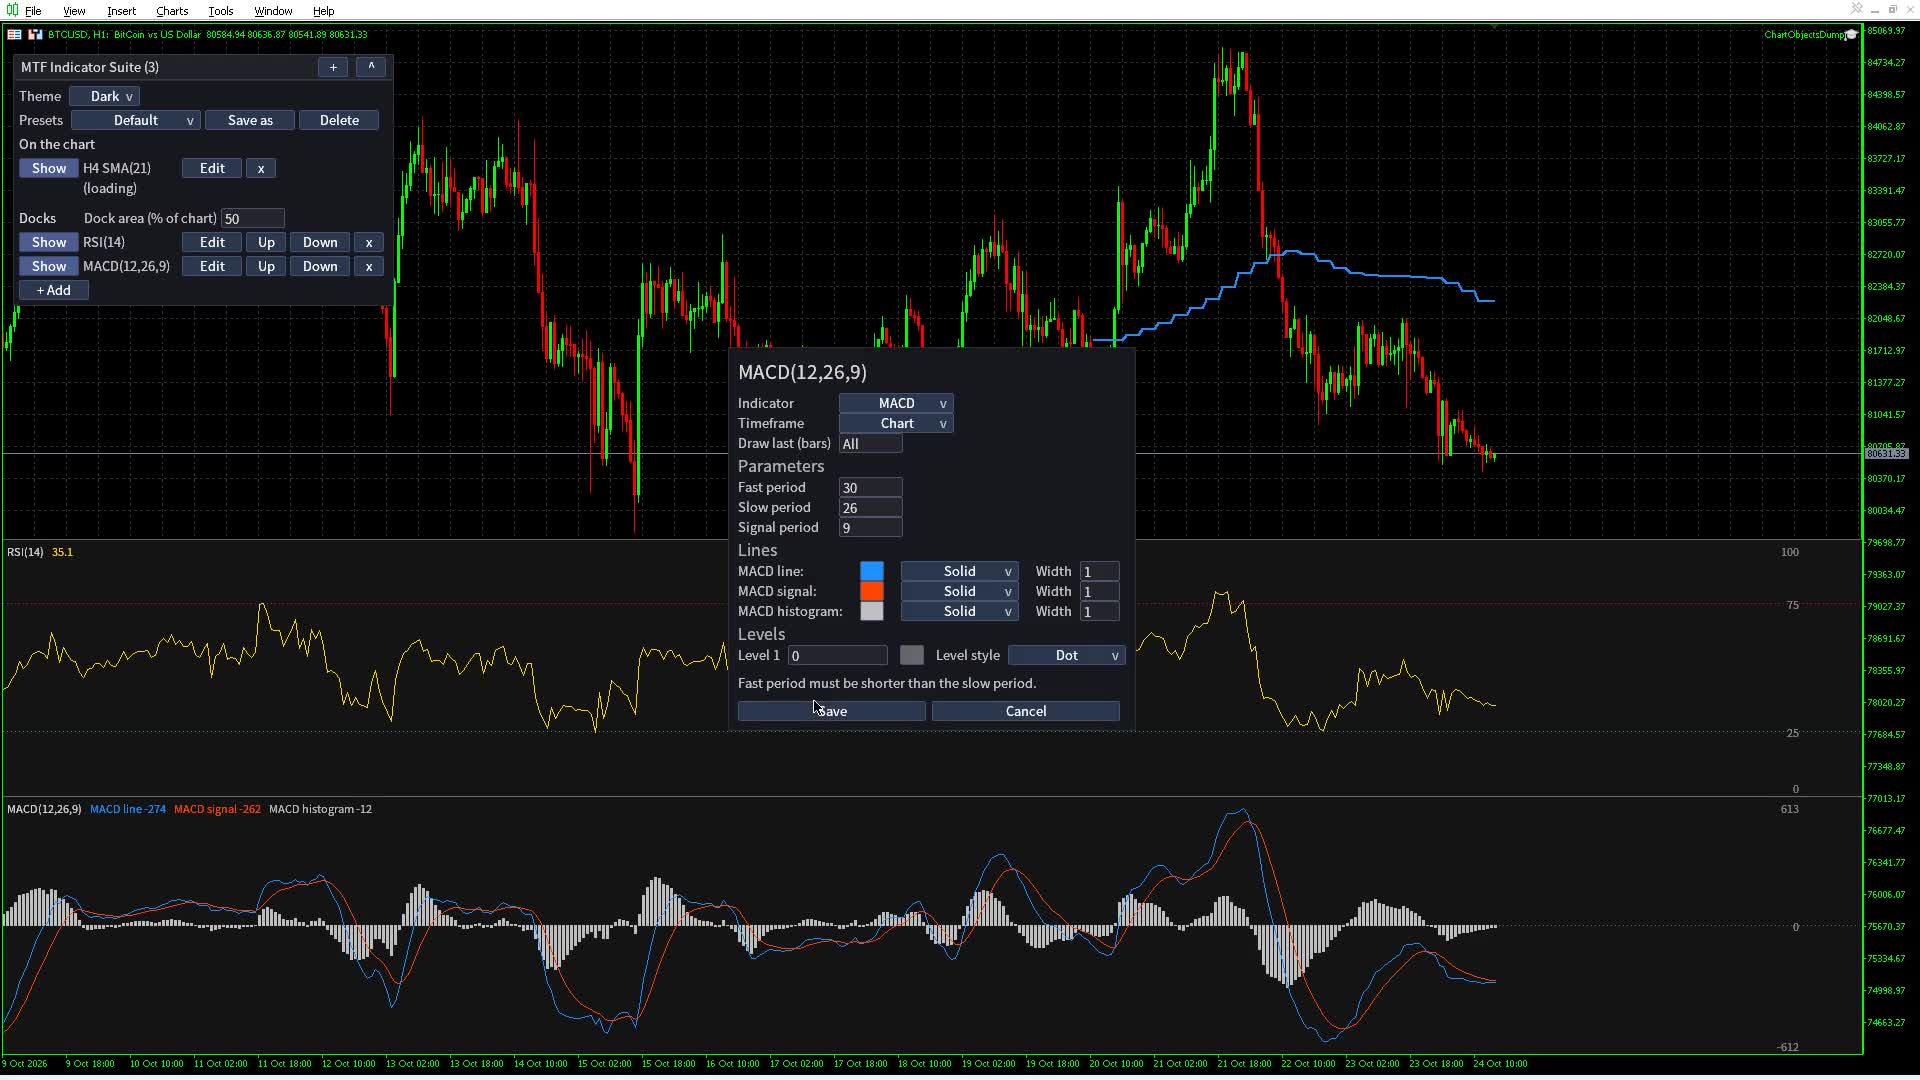
Save checks everything and says what to fix: a period of 0, a MACD fast period that is not shorter than the slow one, a level outside RSI's 0 to 100, an entry that would pass the 32-line limit. Nothing changes until Save passes, and Cancel leaves the entry as it was.
5. Show, hide, order and remove
- Show/Hide shows or hides the whole entry. A hidden entry stays in the list and is saved, but it is not loaded, computed or drawn.
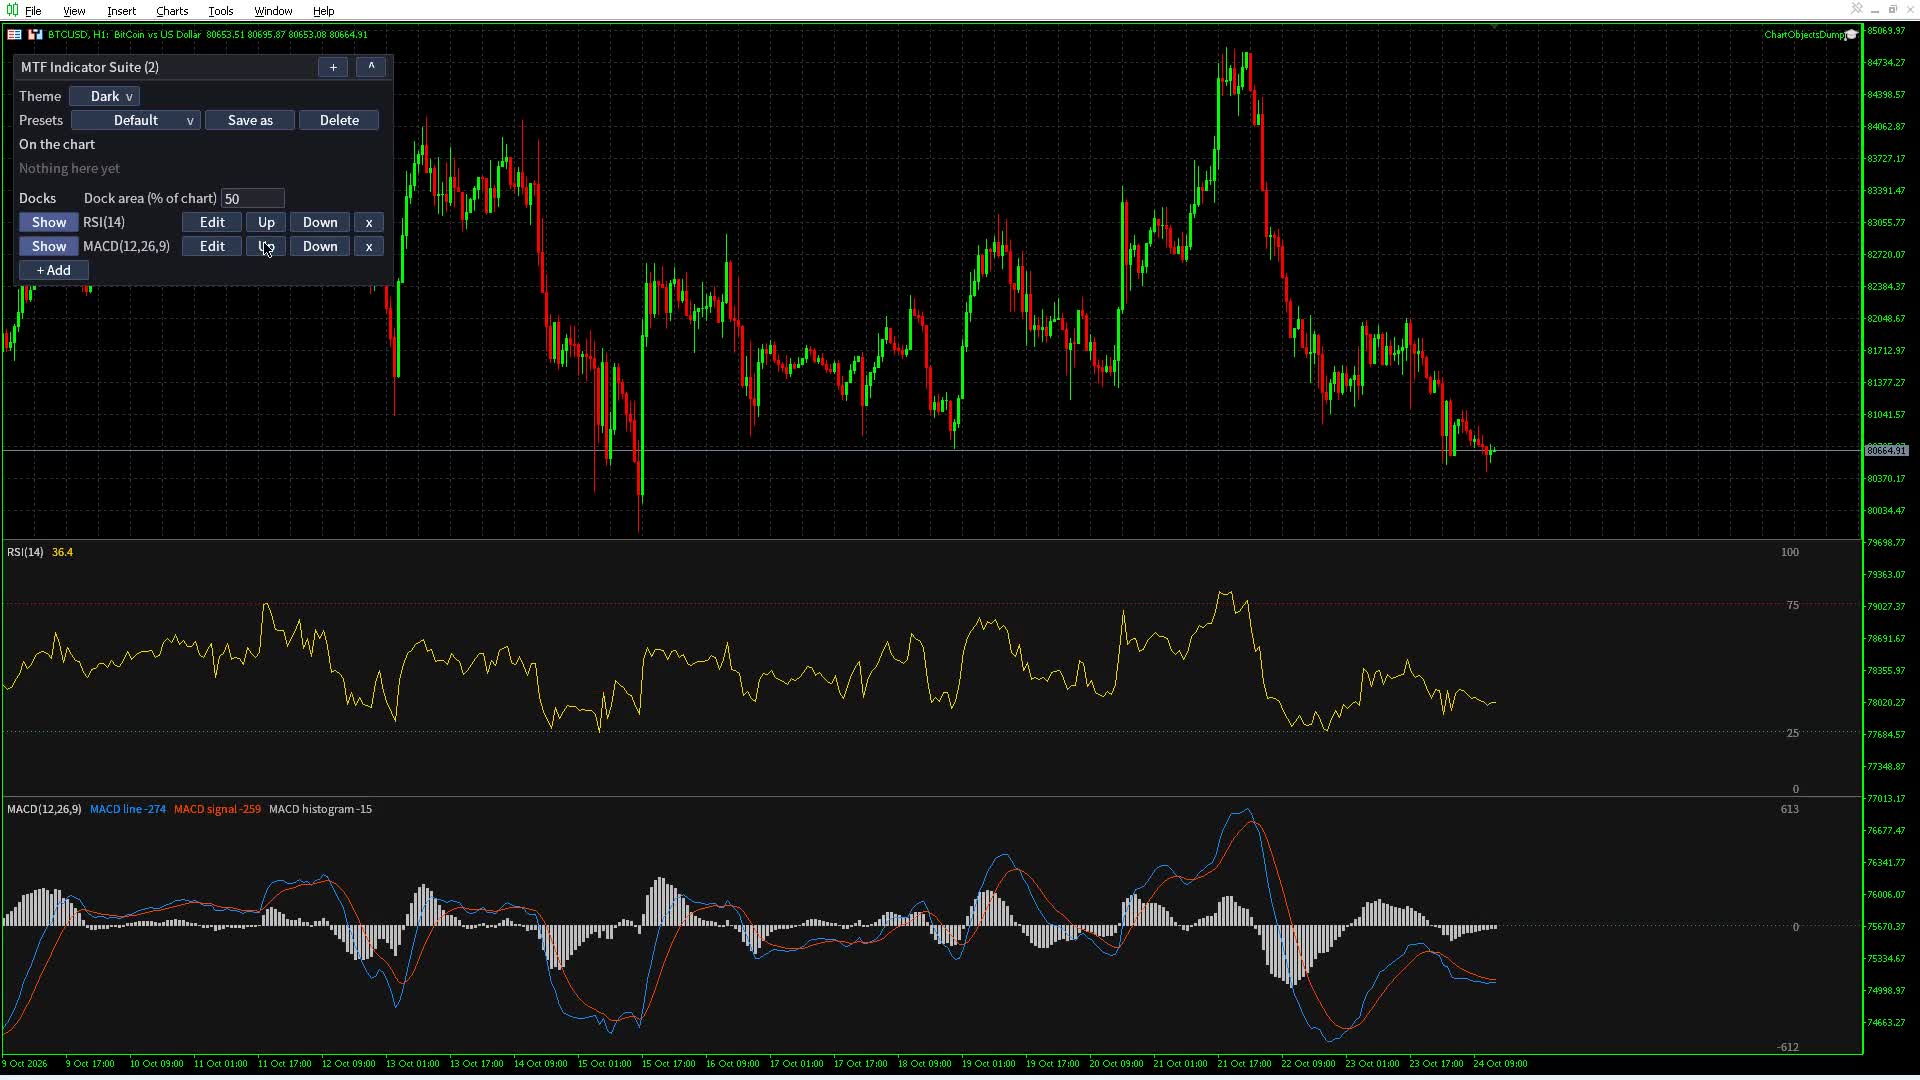
- Up and Down change the order of the docks.
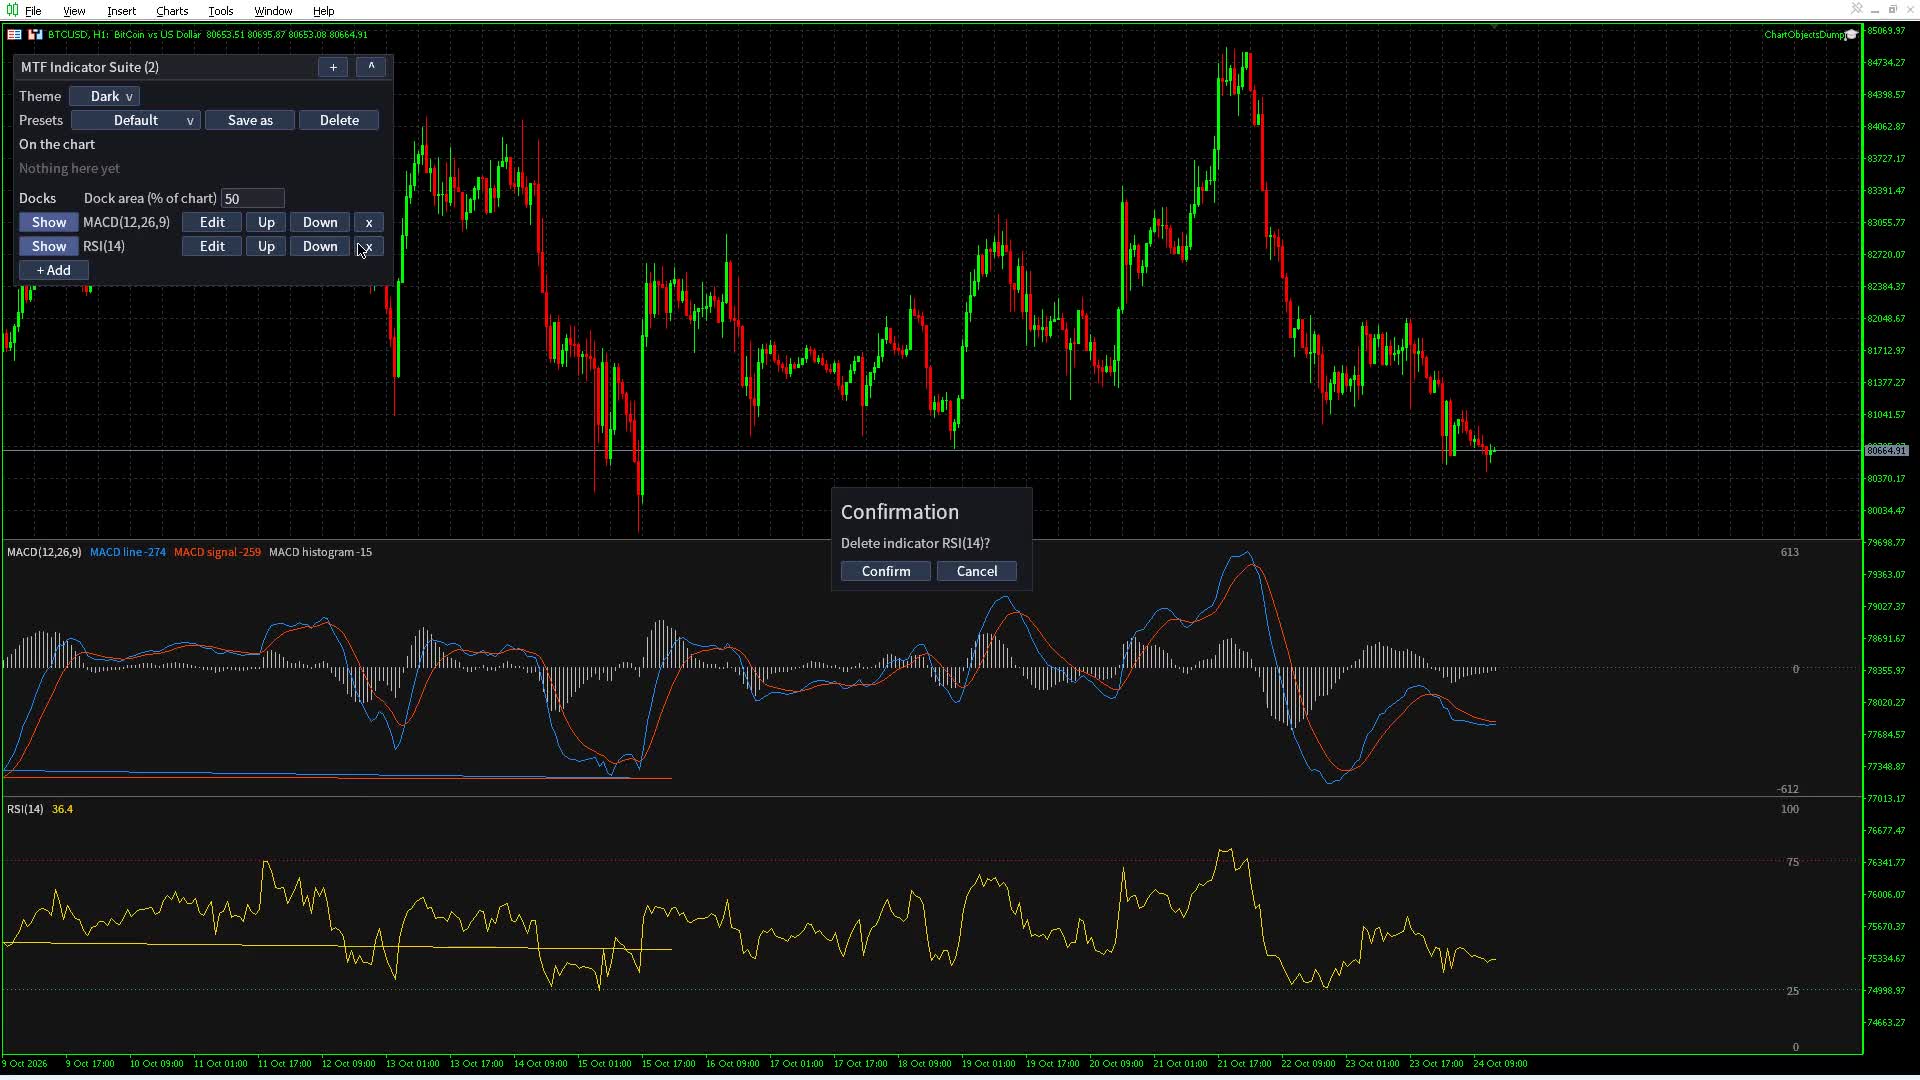
- x asks for confirmation, then removes the entry.
Every change is saved at once and the chart redraws.
6. The indicators
| Indicator | Draws |
|---|---|
| SMA, EMA, WMA, HMA, DEMA, TEMA | one line over the candles |
| MA Ribbon | up to five moving averages, each with On/Off, type and period |
| Bollinger Bands, Keltner Channels, Donchian Channels | upper, middle and lower lines, filled inside on MT5 |
| VWAP | the VWAP with optional deviation bands (section 7) |
| Supertrend | the trend line with the gap to price shaded |
| Parabolic SAR | dots under price in a rise, over it in a fall |
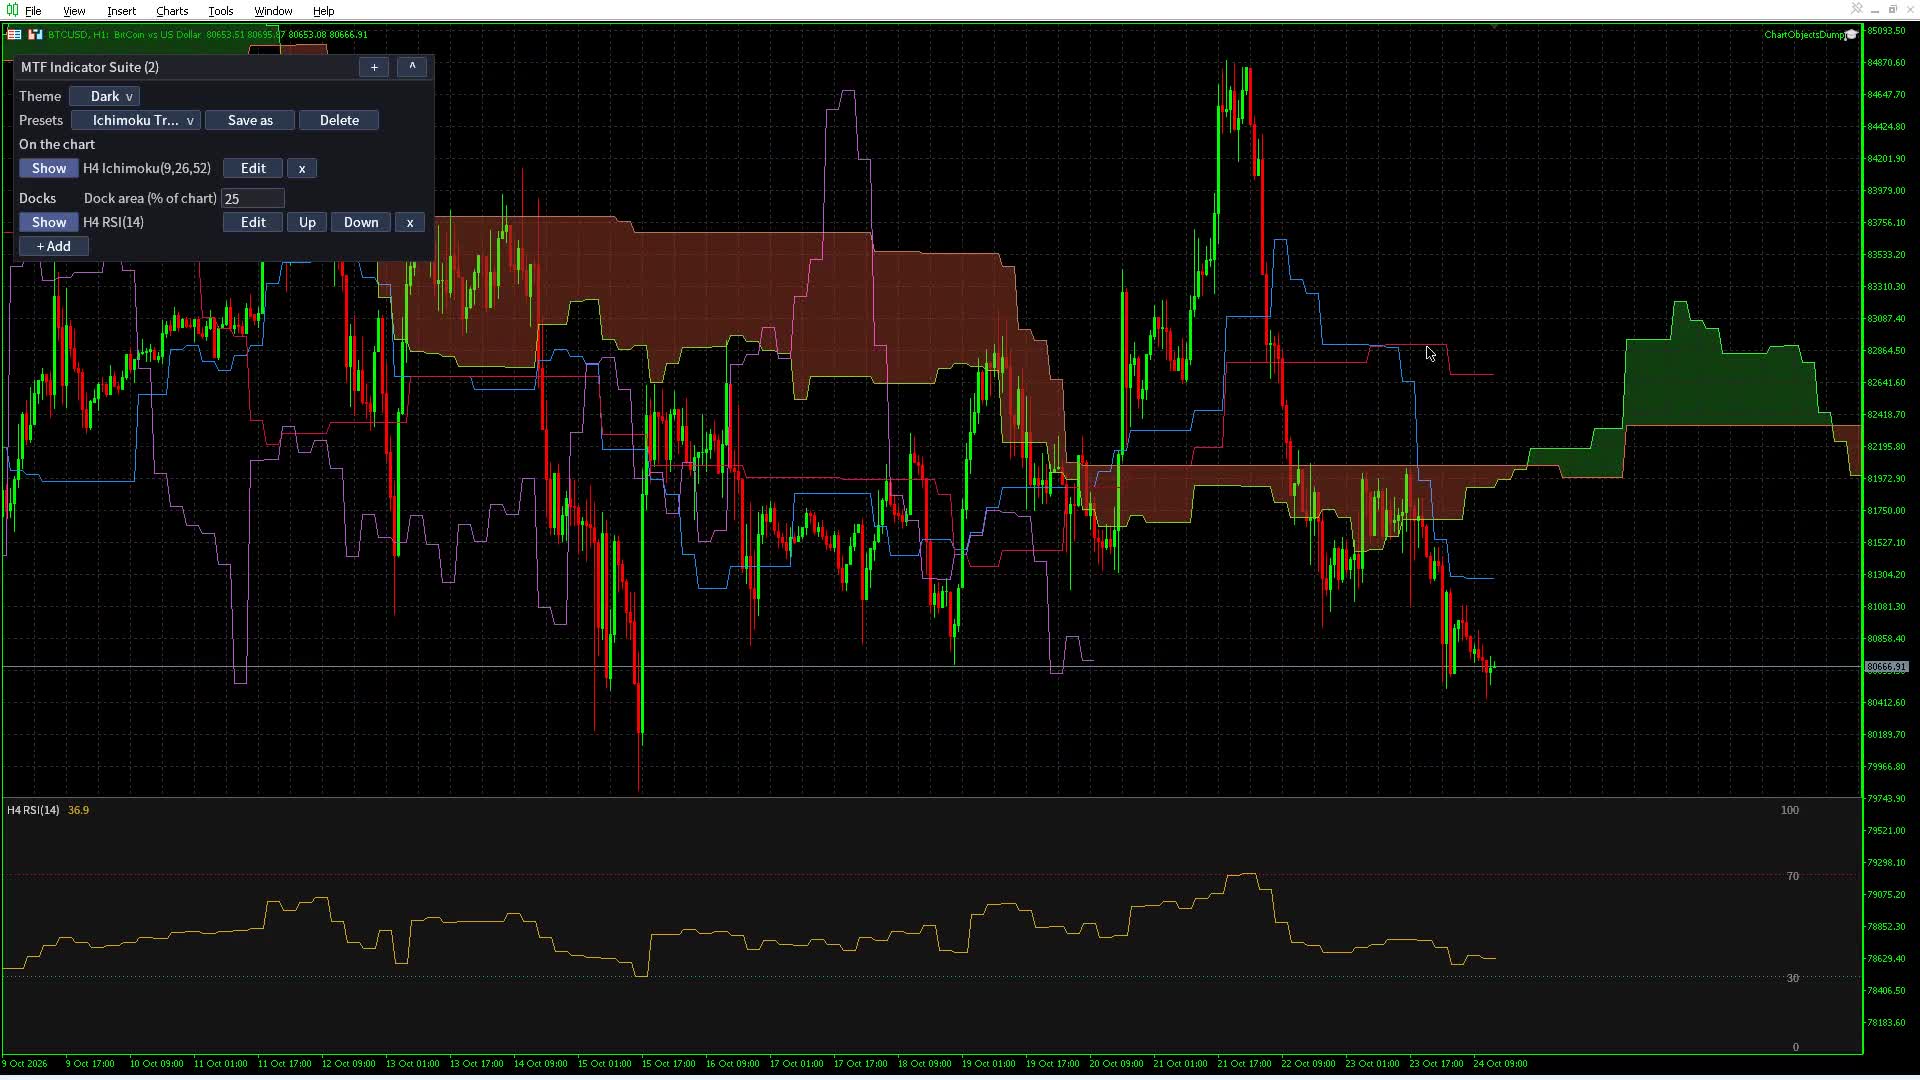
| Ichimoku | Tenkan, Kijun, both spans with the cloud projected ahead, and the lagging span |
| RSI, Stoch, Stoch RSI, Quad Stoch | dock with a 0 to 100 scale |
| MACD | dock with the MACD and signal lines and a histogram |
| CCI, Williams %R, MFI, ADX | dock |
| ATR, Volume | dock; set Average to a length for a second line with their simple average over that many bars (0, off, by default) |
| OBV | dock |
Quad Stoch draws four stochastics in one dock (9/3, 14/3, 40/4 and 60/10 by default). In the MA Ribbon, a line switched Off is not computed or drawn.
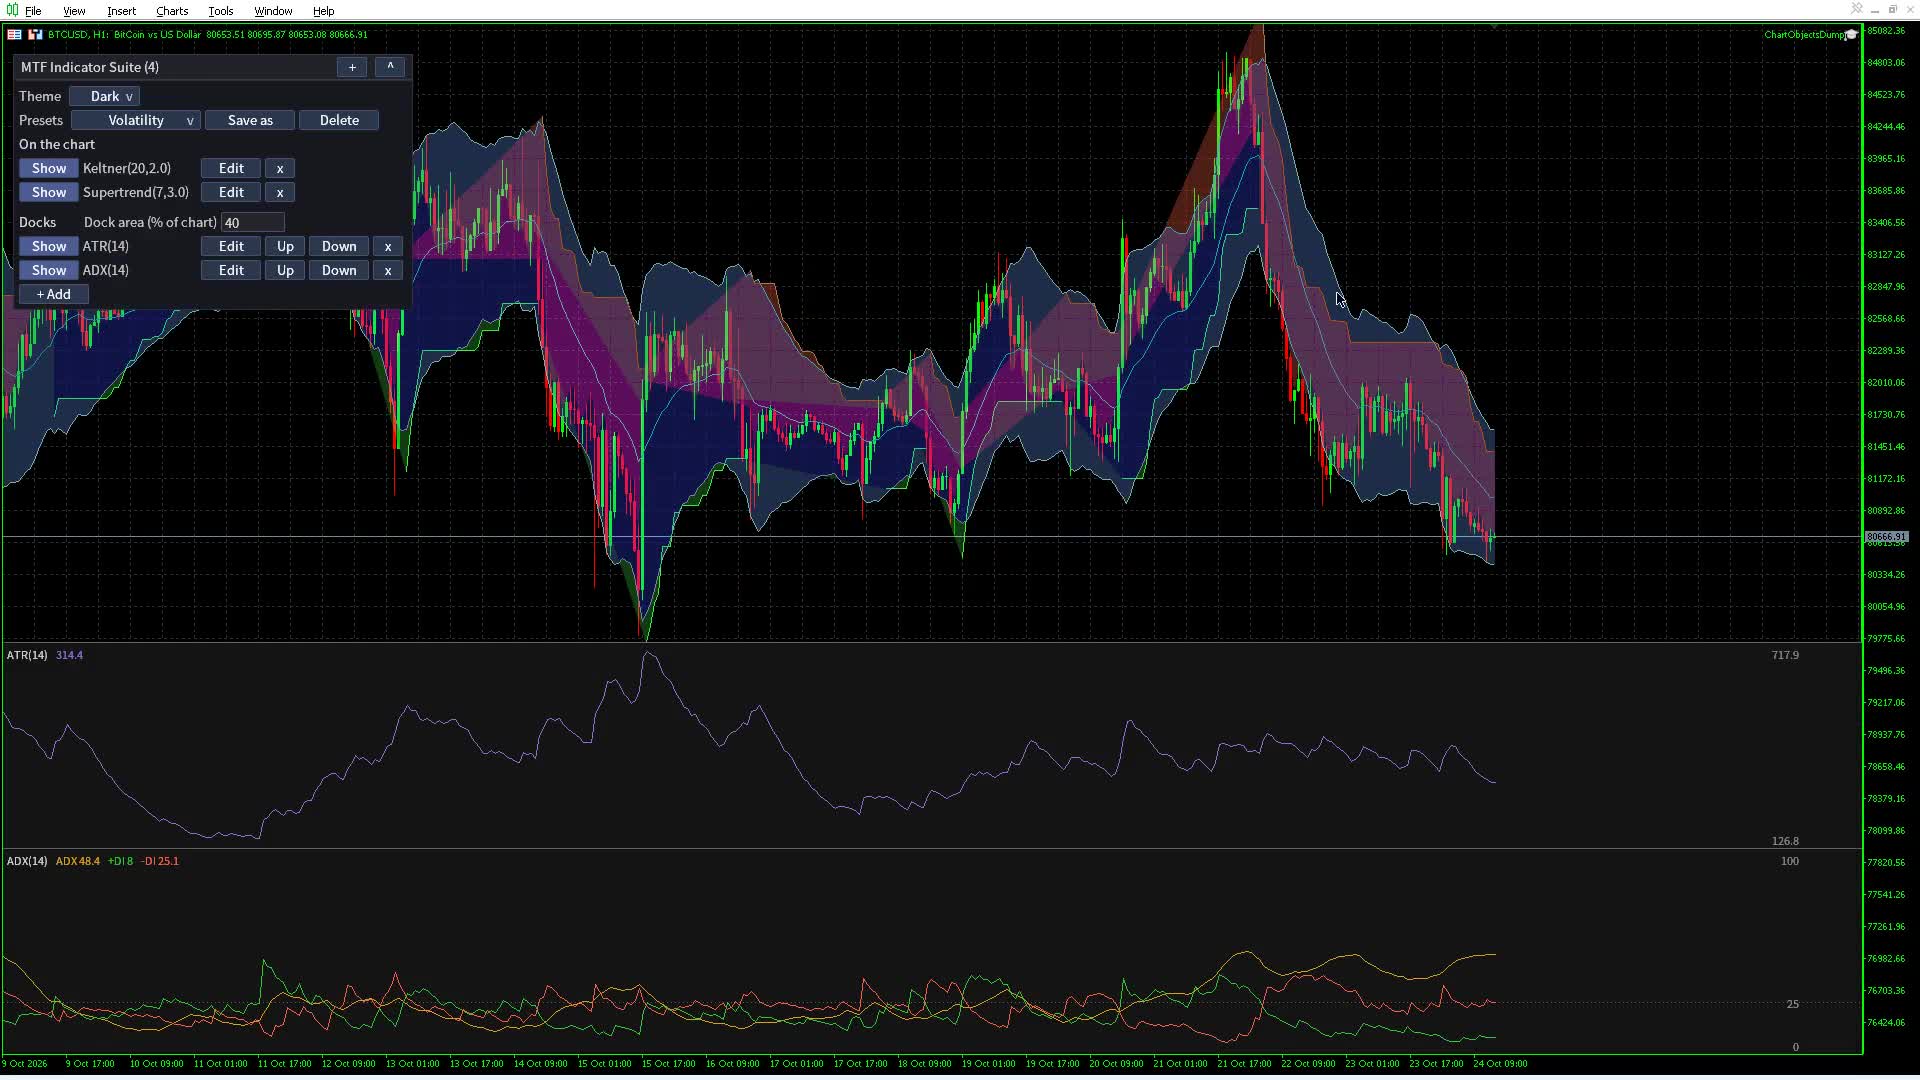
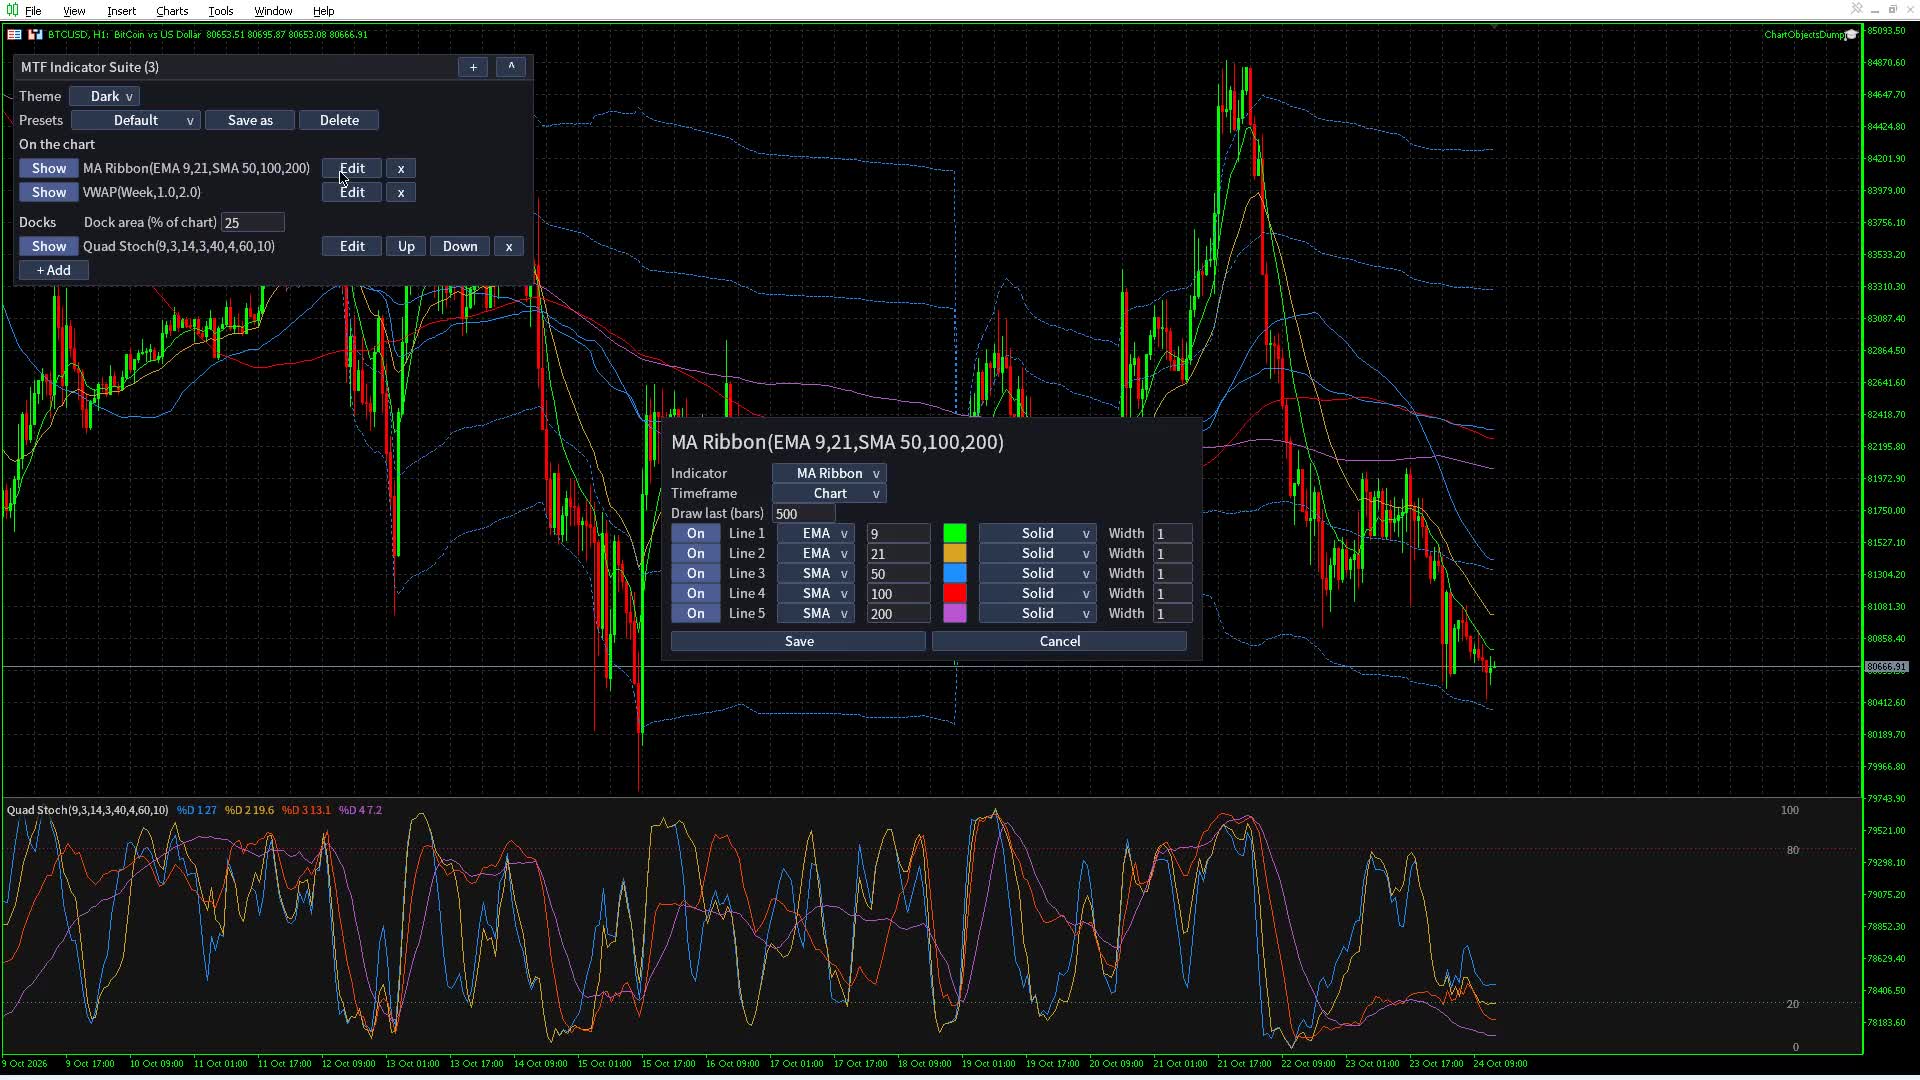
The chart holds up to 32 lines over the candles at once. Bollinger Bands count 3, a VWAP with bands counts 5, docks count none.
7. VWAP
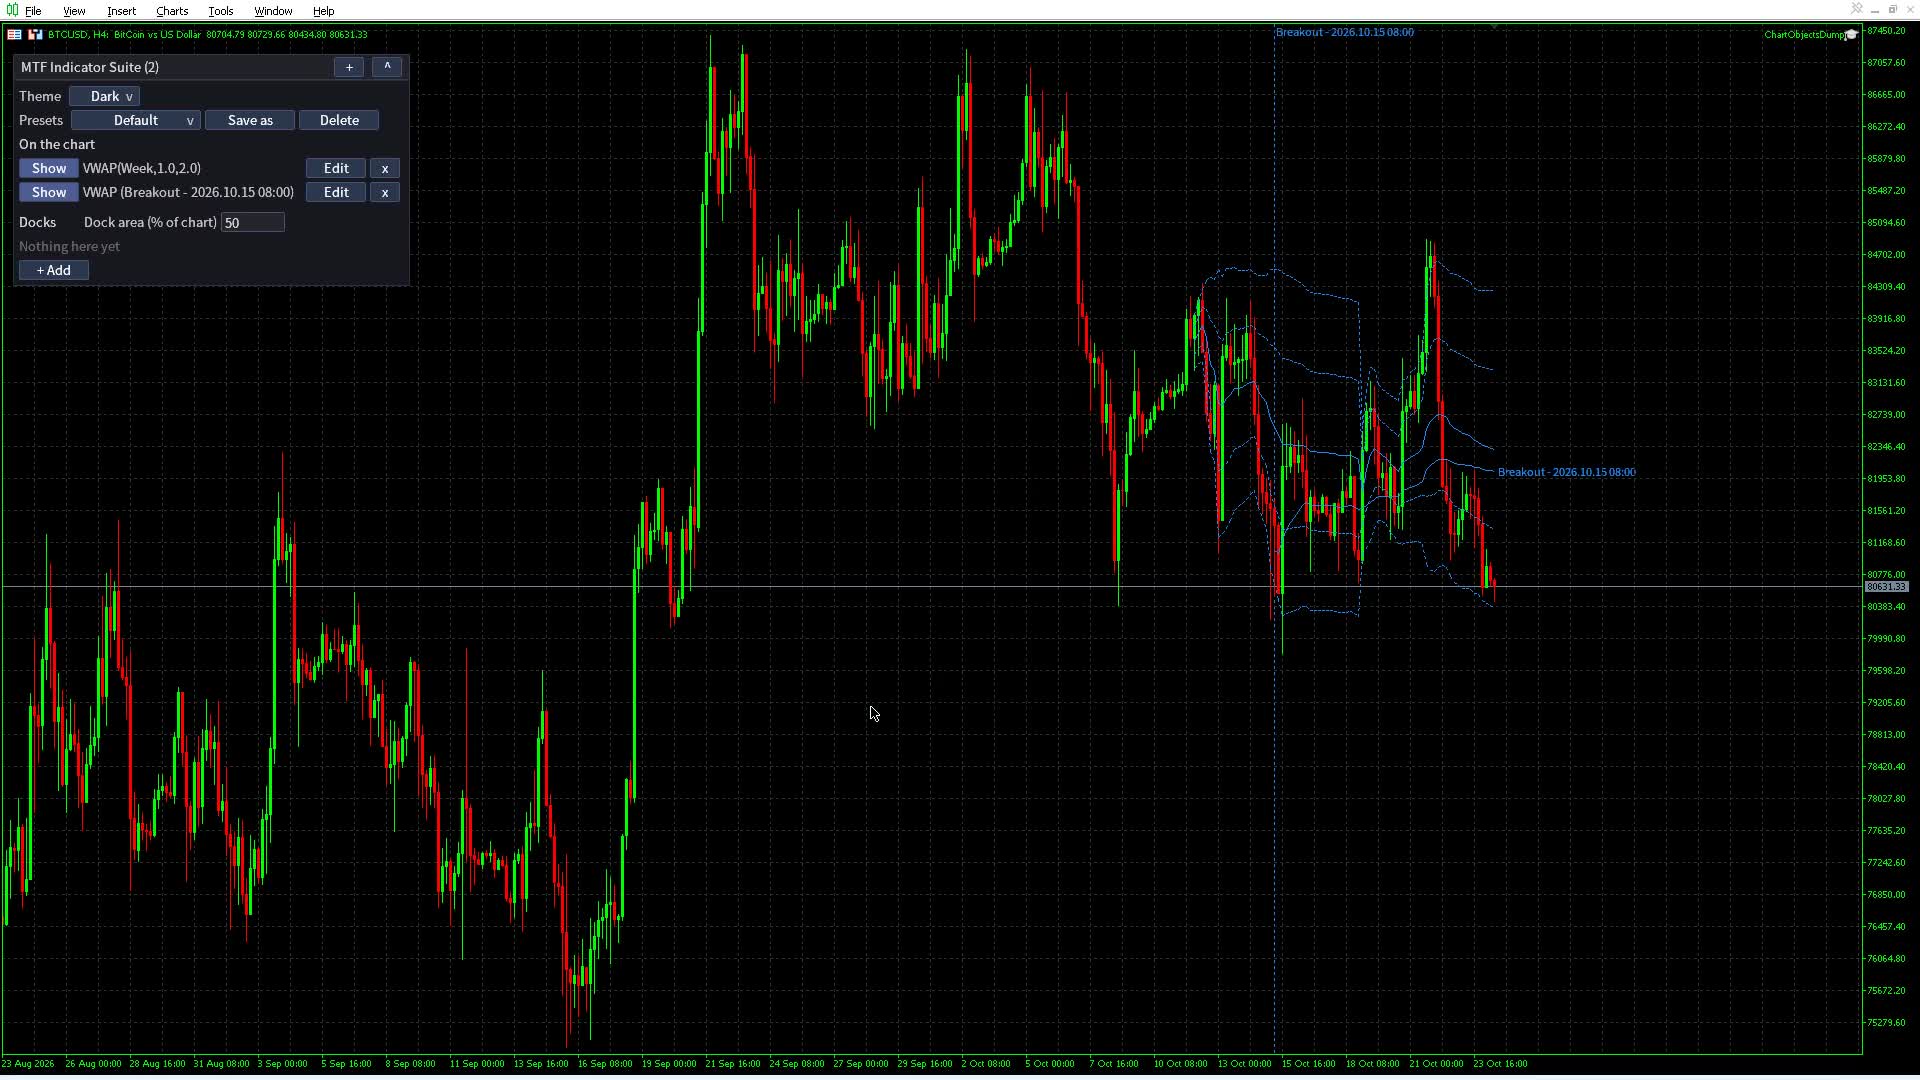
A VWAP entry has no timeframe field. Pick an anchor:
- Day, Week, Month, Quarter or Year: the VWAP resets at each period start, in broker time. Weeks start Monday 00:00.
- Custom: a classic anchored VWAP. Type a start date (YYYY.MM.DD) and time (HH:MM) in server time and an optional name. It starts there and never resets. With "Show anchor and label" On, a dotted vertical line marks the start, with the name and start time at the top of the chart.
Periods shown (1 to 10) sets how many periods to draw: 1 is only the current day, week, month, quarter or year. Switch Bands On for two deviation bands on each side, with their widths set in the editor (1.0 and 2.0 by default).
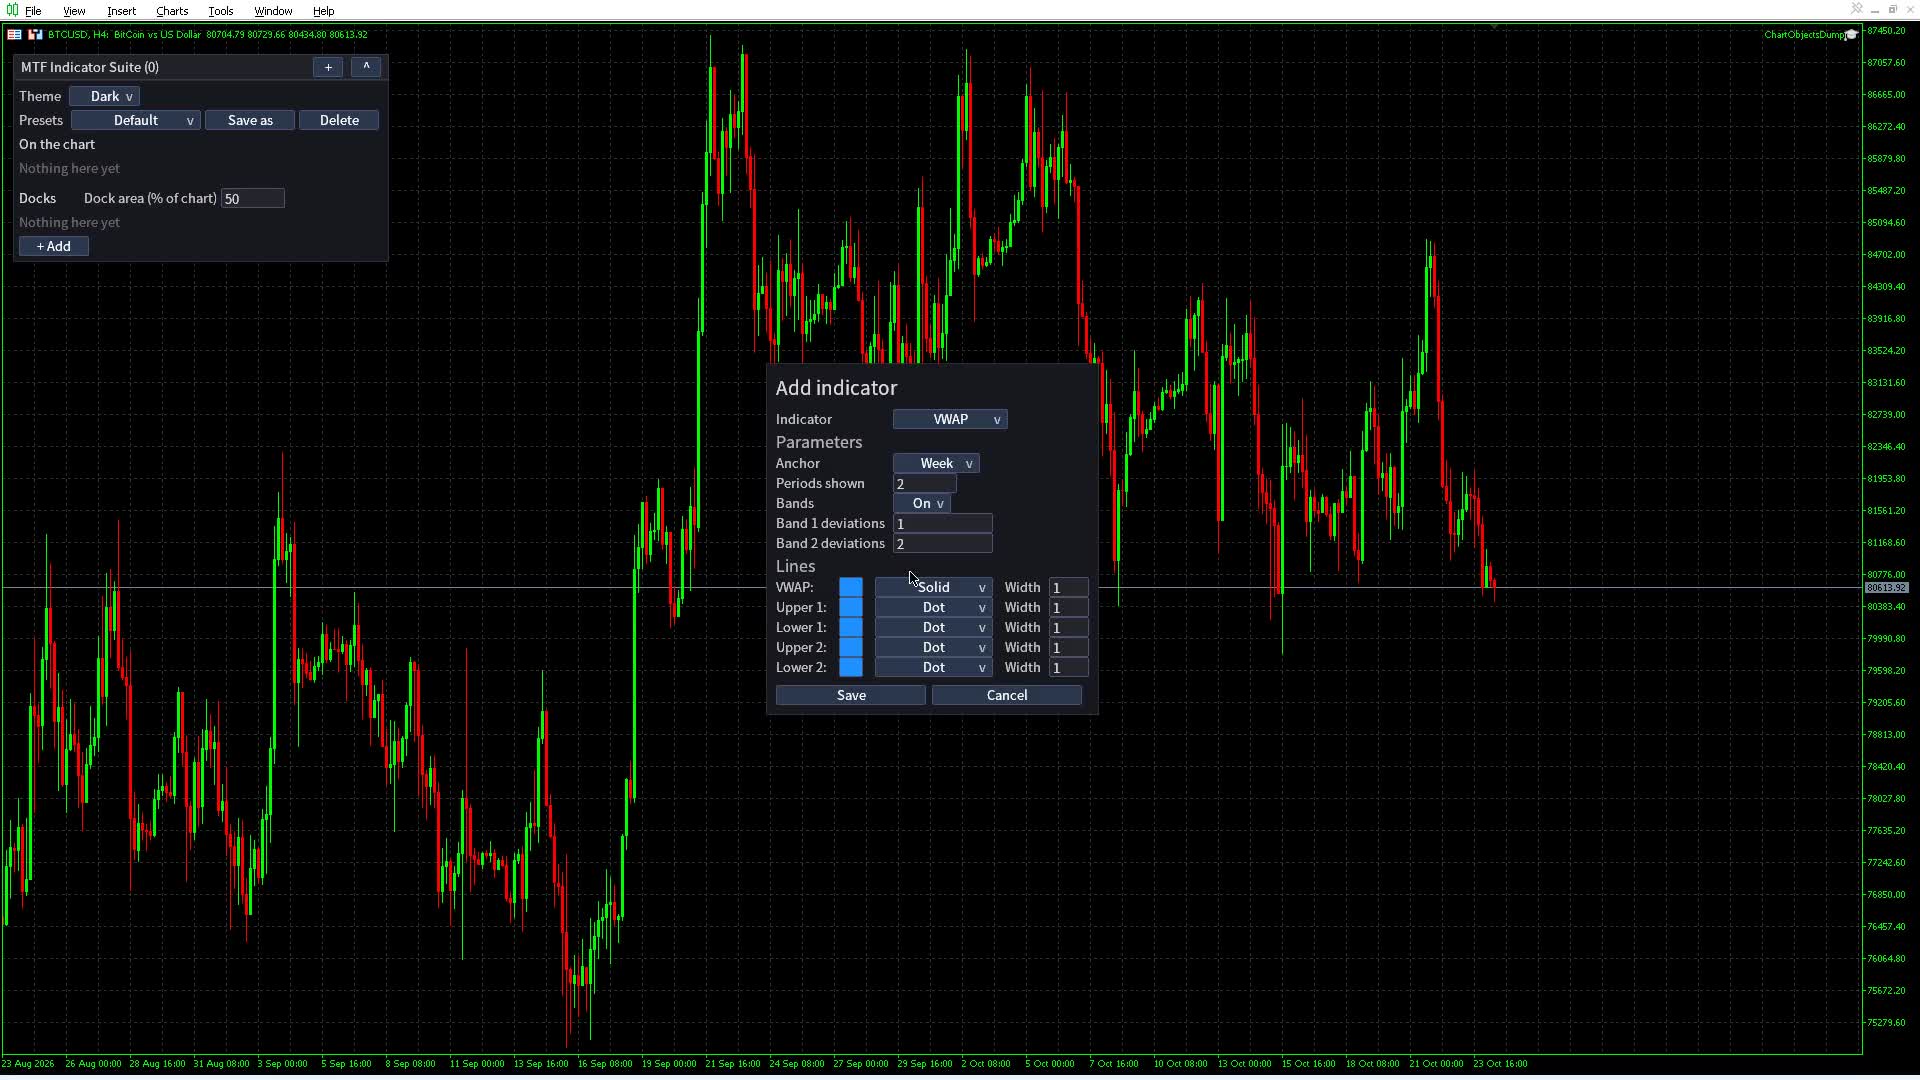
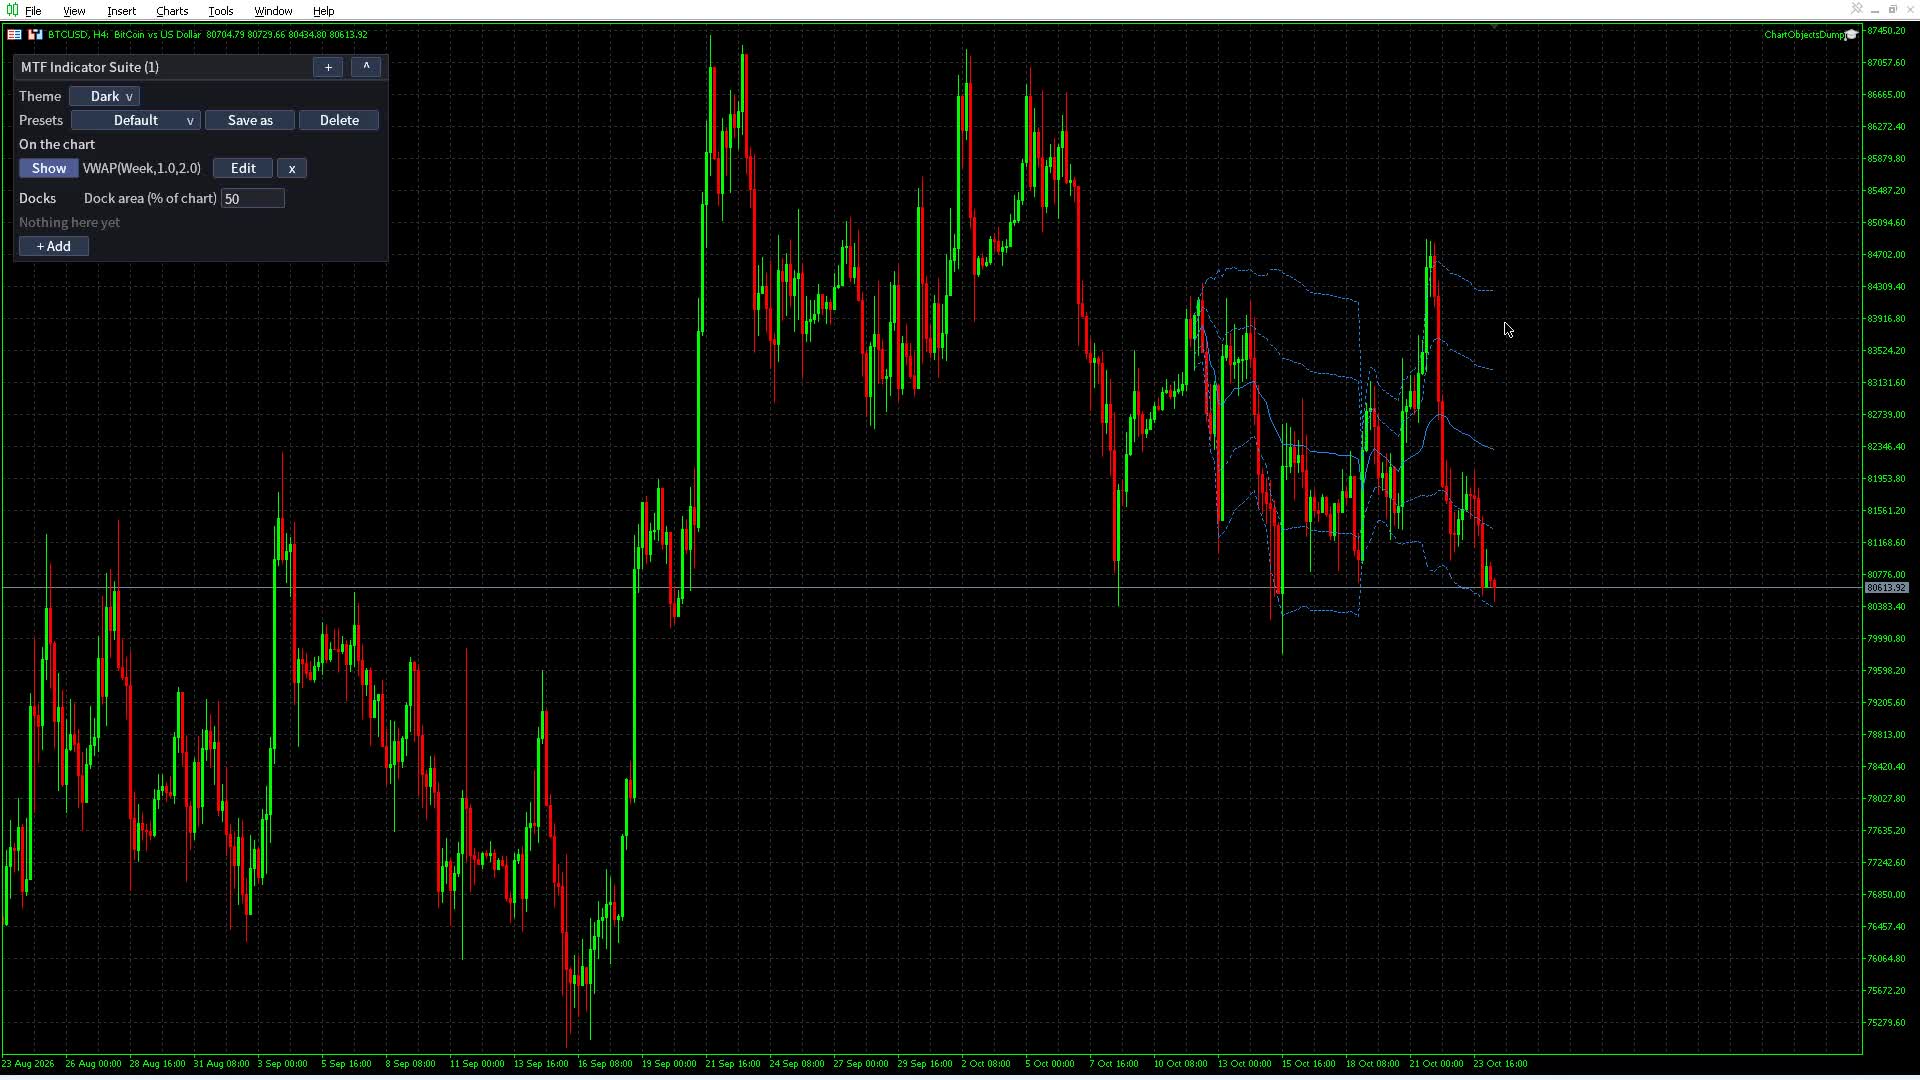
The VWAP computes on the finest timeframe from M1 to D1 whose bars over the shown periods fit the terminal's Max bars in chart, so it is the same on every chart.
8. Presets
A preset is a whole layout: the entry list with every setting, the dock area and, for presets you save, the theme.
| Built-in preset | What it holds |
|---|---|
| Default | the same layout as MA Ribbon + VWAP + Quad Stoch |
| MA Ribbon + VWAP + Quad Stoch | MA Ribbon, weekly VWAP with bands, quad stochastic |
| Ichimoku Trend | H4 Ichimoku and H4 RSI |
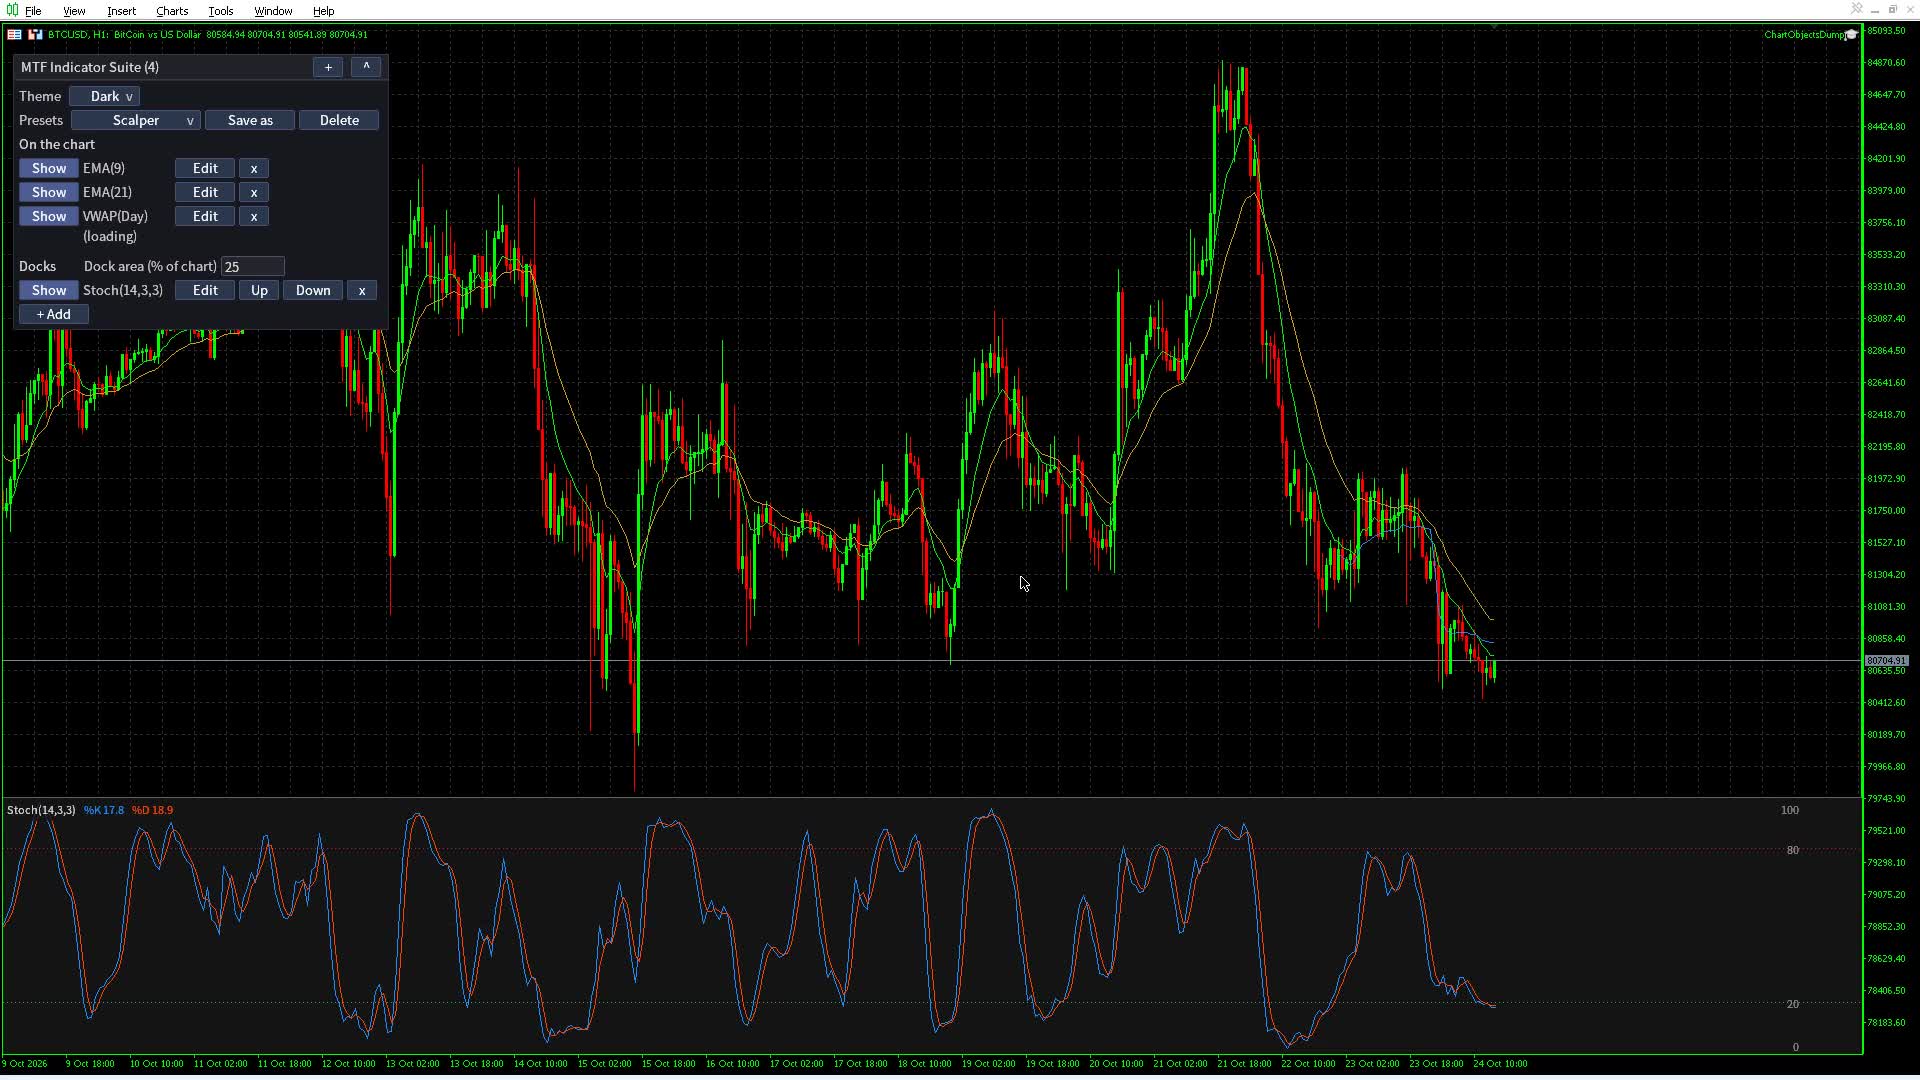
| Scalper | EMA 9 and 21, daily VWAP and a Stochastic |
| Swing | D1 SMA 50 and 200, H4 Bollinger Bands and MACD |
| Volatility | Keltner Channels, Supertrend, ATR and ADX |
| Donchian Quad Stoch Stack | a Donchian channel and the quad stochastic on W1, D1, H4 and H1 |
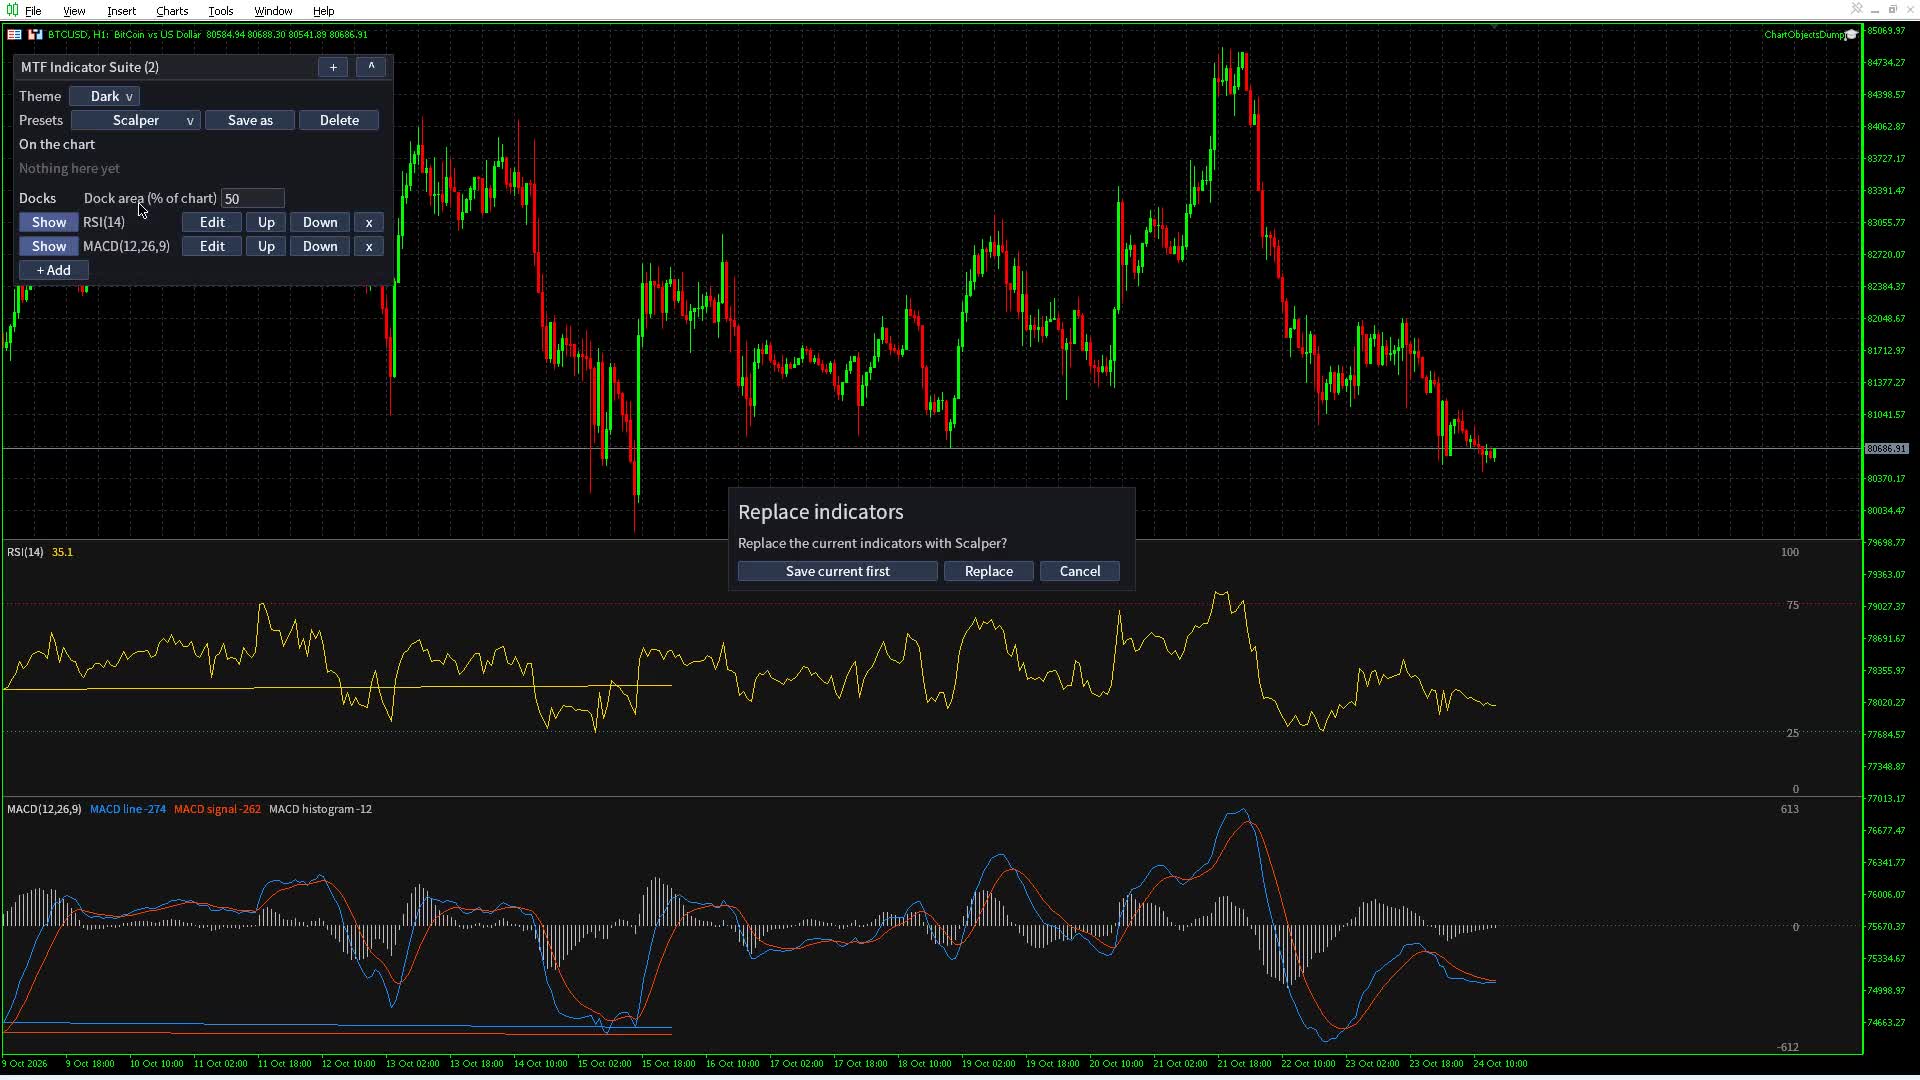
- Picking a preset on a chart you have not edited applies it at once. On an edited chart it asks Replace the current indicators with <name>?: Replace, Save current first, or Cancel.
- Save as saves the chart's layout under a name. Saving under an existing name asks before overwriting.
- Delete removes the preset shown in the dropdown, after a confirmation. Built-ins cannot be deleted.
- Save your own preset named Default and every new chart starts with your layout. Delete it to get the built-in back.
- Your presets are shared by every chart and symbol. A chart follows the preset it was last set to: when you save over that preset on another chart, an unedited chart takes the new layout within a few seconds, and an edited chart asks first.

9. Theme and panel
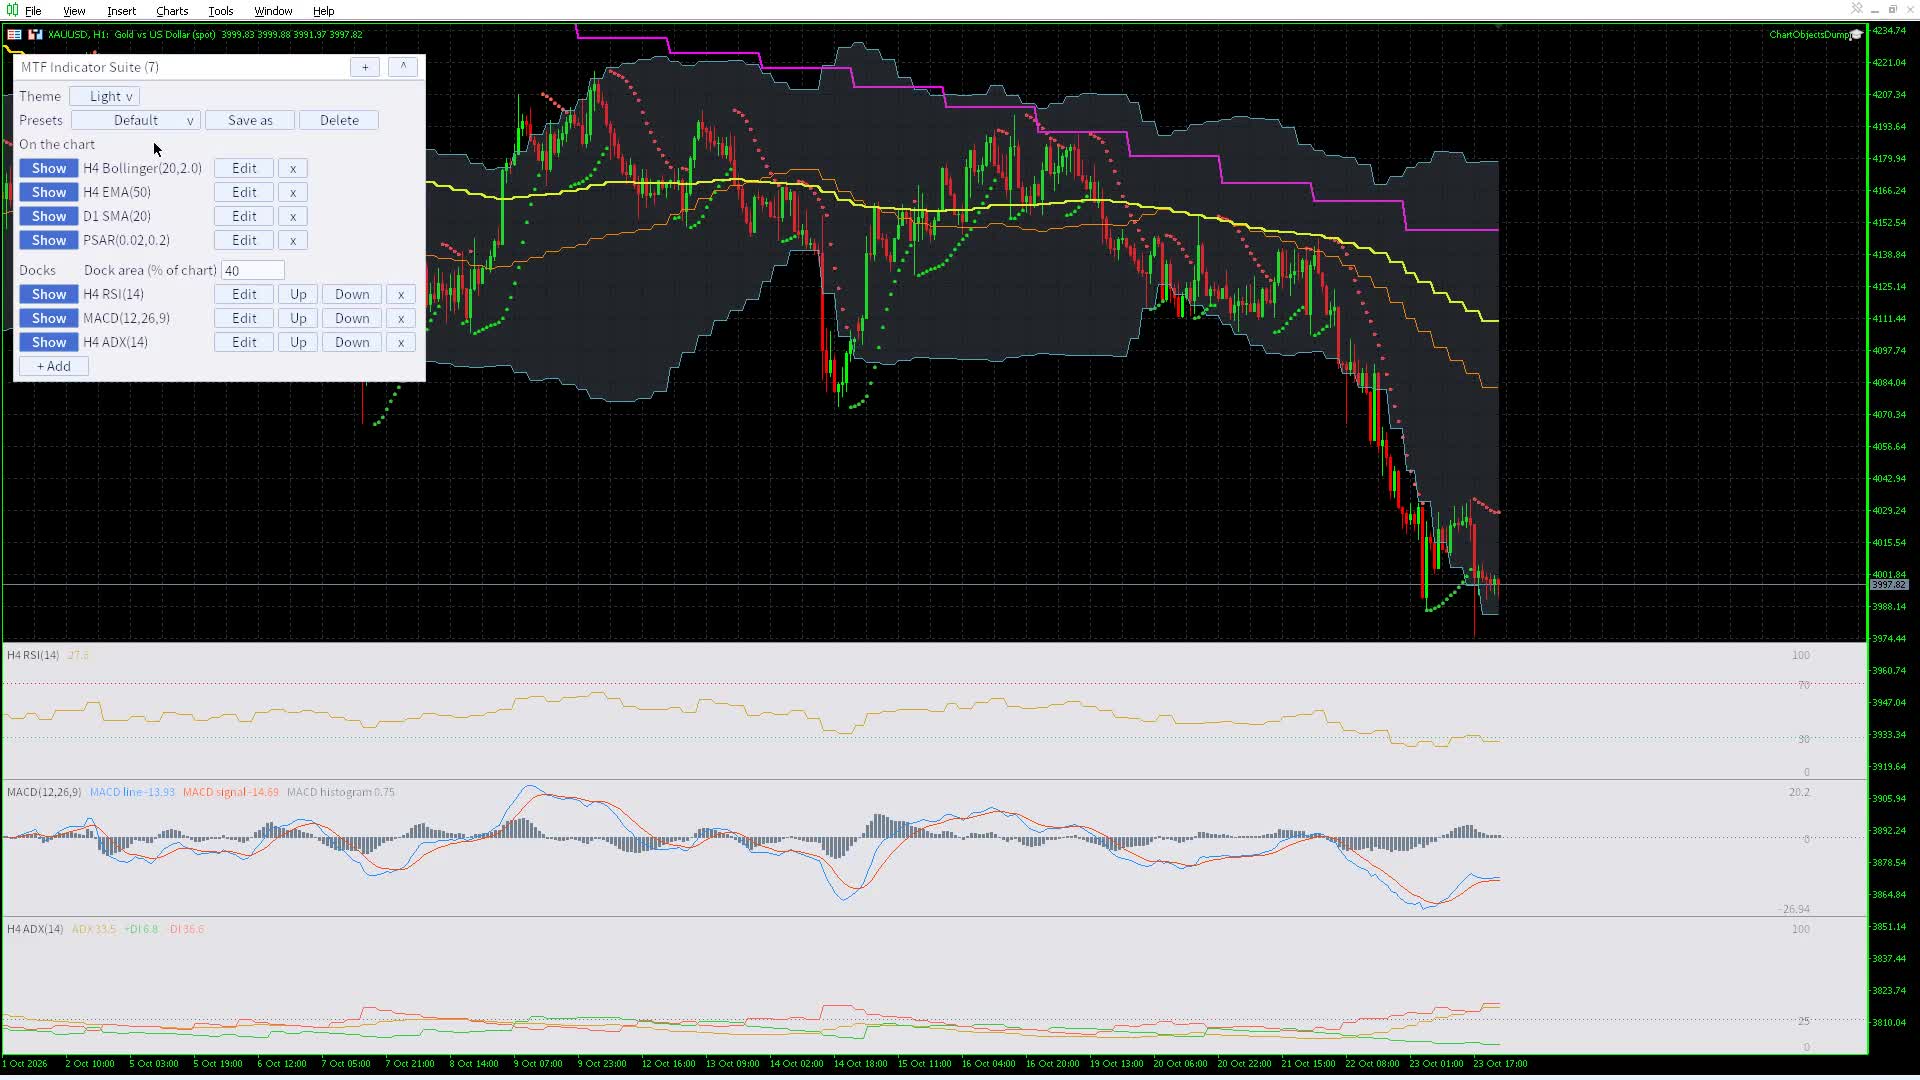
The panel sits at the top-left of the chart under a title bar that reads MTF Indicator Suite (n), with n the number of entries.
- Theme switches the panel, its editor and the docks between Dark and Light.
- The Presets row holds the preset dropdown, Save as and Delete (section 8).
- On the chart lists the entries drawn over the candles: [Show/Hide] name [Edit] [x].
- Docks lists the entries drawn in docks: [Show/Hide] name [Edit] [Up] [Down] [x]. Its header holds the Dock area (% of chart) field.
- + Add at the end opens the editor for a new entry.
- The button at the right end of the title bar (^ open, v folded) folds the panel to the bar alone and unfolds it again.
- The + button next to it picks the panel up: it follows the mouse until your next click drops it. The chart does not scroll meanwhile, and the panel stays inside the chart.
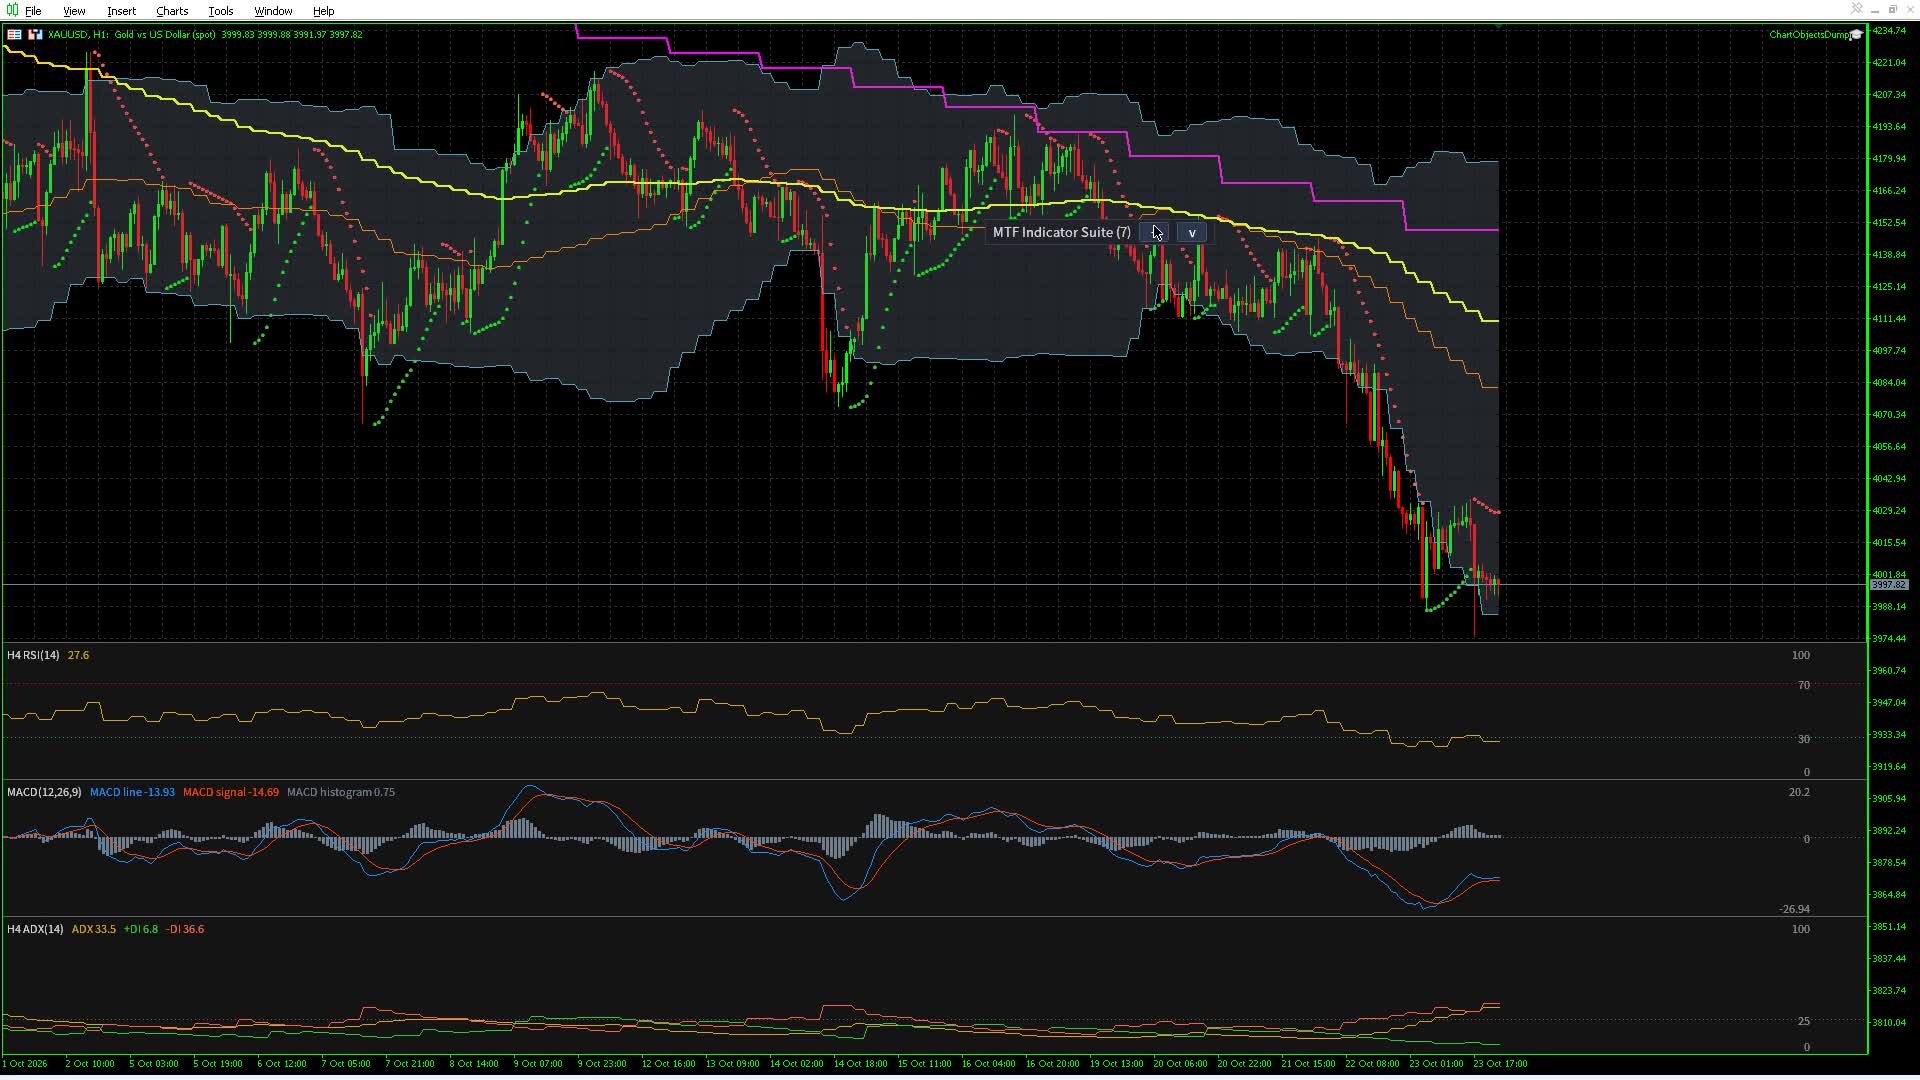
The panel remembers whether it was folded, where you put it, the list page and an open editor with its unsaved text, across timeframe changes and terminal restarts.
10. Timeframes, symbols and templates
- Switching the chart's timeframe keeps the list, the panel and an open editor. Price lines below the new timeframe are skipped until you switch back down.
- Each symbol has its own list. Switching the chart to another symbol loads that symbol's list.
- A chart saved as a template with the indicator on it, default.tpl included, opens cleanly on any symbol.
- History for another timeframe can take a moment to download. The entry shows (loading) and fills in by itself, even when the market is closed.
- Some brokers keep a short history on a timeframe (W1, MN1 or M1 often). Once the terminal has all the broker holds, the entry draws the bars there are with (only N bars of history), or shows (not enough history: N of M bars) when they do not cover what its formula needs, and looks again every minute.
11. Where your settings are saved
Under the terminal's data directory, MQL5\Files (MQL4\Files on MT4):
- MTFIndicatorSuite_0_<symbol>\entries.json: the list for that symbol.
- MTFIndicatorSuite_0_<symbol>\dock_clearance.json: the dock area and the theme.
- MTFIndicatorSuite_presets\presets.json: your presets.
Removing the indicator keeps these files, so putting it back restores your layout.
12. MT4 differences
The indicators, panel, docks and presets are the same on MT4. MT4 has no filled drawing, so the Ichimoku cloud, the inside of the bands and the Supertrend shade show as lines only.
13. Troubleshooting
- (loading): the terminal is still downloading or building history for that timeframe. The entry fills in by itself; the indicator retries every second without waiting for a tick.
- (only N bars of history): the broker keeps fewer bars on that timeframe than Draw last asks for, and the entry draws the ones there are (section 10).
- (not enough history: N of M bars): the broker's bars on that timeframe do not cover what the formula needs. Shorter periods need fewer bars, or pick a timeframe the broker keeps more of.
- (needs more history: raise Max bars in chart) on a VWAP: raise "Max bars in chart" in Tools, Options, Charts.
- (history from <date> only): the broker's history starts later; the VWAP draws what exists.
- (needs edit: <reason>): open the entry with Edit and fix what the reason says.
- A line over the candles is missing after a timeframe switch: its timeframe is below the chart's. Switch to that timeframe or lower.
- More detail: set the Log level input to Debug and read the Experts tab.