
News Impact Statistics (MT5): User Manual, the Three Tabs, Inputs and How to Read the Numbers
14 October 2026, 00:40

0
36
News Impact Statistics is an indicator for MetaTrader 5 that measures how far the chart symbol moved after each economic release, on your broker's own prices, and shows the usual move of the releases coming up. It helps you size stops and positions before a release, choose which events an EA's news filter should avoid, and know what a normal reaction looks like. It never trades. This manual applies to version 1.00.
What it measures
- It reads the economic calendar built into MetaTrader 5 and the M1, M5 and M15 price history in your terminal. No web requests, no DLL, no external calendar feed: nothing has to be added to the WebRequest list.
- Size: for every past release, the distance from the price at the release time (the open of the first bar at that time) to the close 5, 15 and 60 minutes later. It uses the finest bars available for that date: M1, else M5, else M15. The 15-minute swing is the largest distance from the release price, up or down, within those 15 minutes.
- Direction: the calendar rates each actual value as good or bad for its currency. The indicator checks whether the price moved that way after 15 minutes. Good for the symbol's base currency counts as up, good for its profit (quote) currency as down. On XAUUSD, good for USD counts as down.
- Spread: the highest spread from 2 minutes before to 2 minutes after the release, divided by the median spread from 10 to 2 minutes before it. Only releases of the last 30 days (by default) are checked, from tick data. Older ones are skipped on purpose, so the terminal does not download years of ticks.
- Events without an exact time are skipped. All times are the broker's server time.
Installation
- Buy the indicator on the product page, then install it in MetaTrader 5: Toolbox > Market > Purchased > Install. Updates are in the same place (Update).
- Open a chart of the symbol you want to study. Any timeframe works; the indicator reads the M1, M5 and M15 bars by itself.
- Drag News Impact Statistics from Navigator > Indicators > Market onto the chart and click OK. The panel appears at the top left of the chart.
First steps
- On the first start the terminal loads the calendar and the price history in the background. Until then the panel shows a status line such as "Reading the economic calendar..." or "Loading price history..." (no M5 or M15 bars yet). The indicator retries every 2 seconds. Keep the terminal connected and check that Toolbox > Calendar shows events.
- With Currencies left empty, it uses the chart symbol's base and profit currencies: EURUSD gives EUR and USD, XAUUSD gives USD. XAU, XAG, BTC and ETH are skipped; if nothing is left, USD is used. The panel title shows the currencies used.
- It works on any symbol with M5 or M15 history in the terminal. To measure other currencies, type them in Currencies, for example USD,CNY . Direction is measured only for the symbol's own base and profit currencies.
- How far back the bars go depends on your broker and on "Max bars in chart" (Tools > Options > Charts).
- It reads the calendar again every hour while the chart stays open.
The three tabs
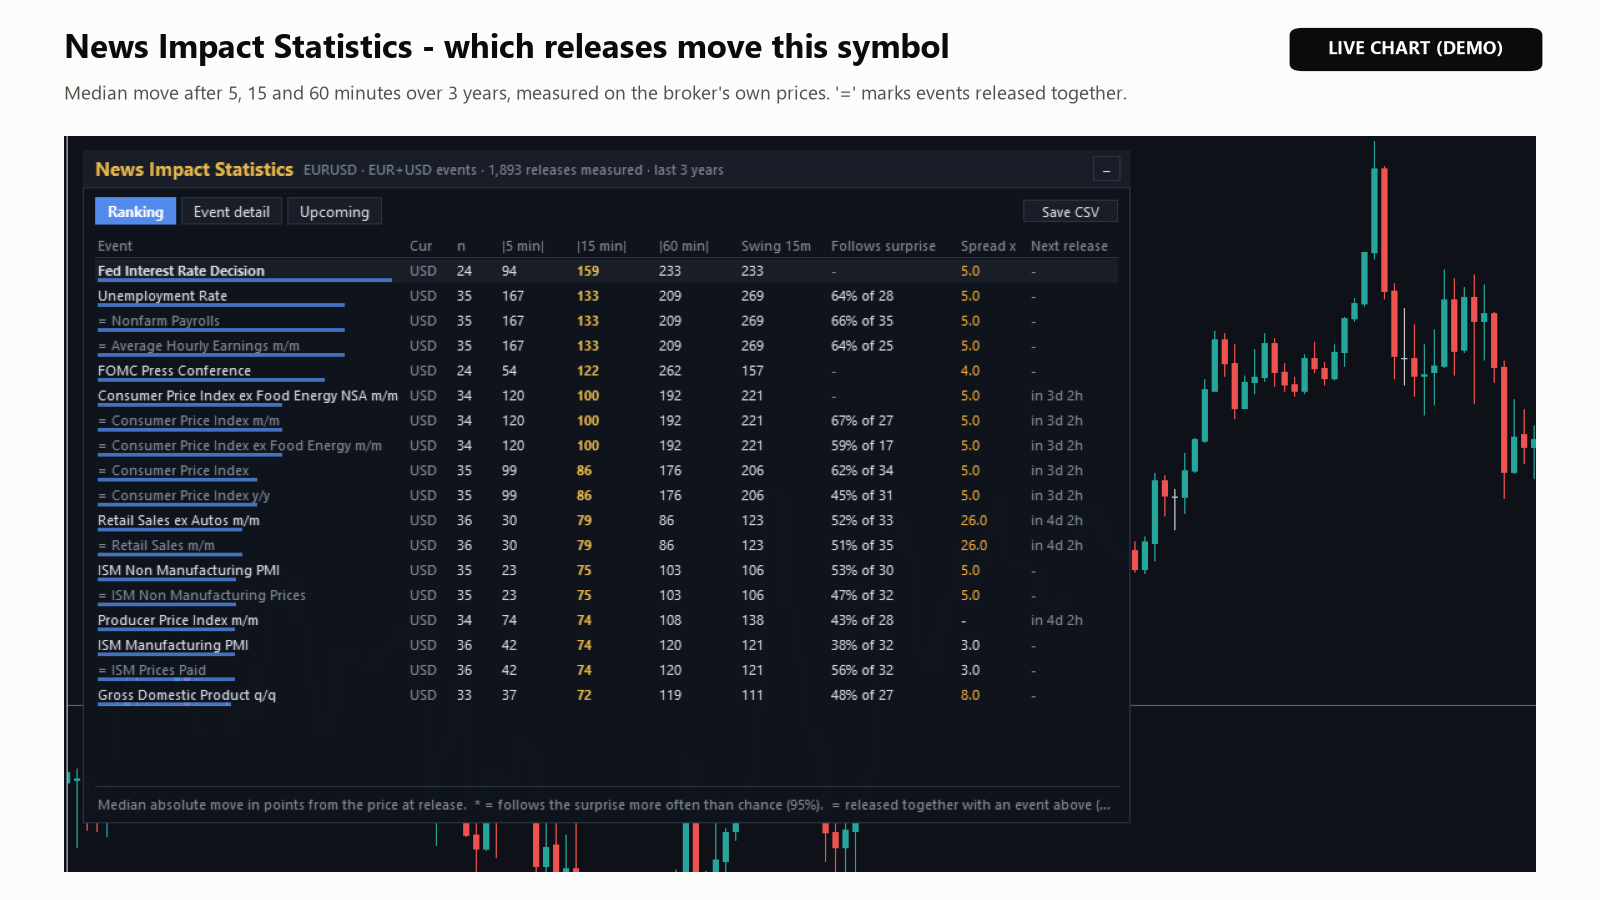
- Ranking: one row per event, sorted by the median move after 15 minutes, largest first. Columns: Cur, n (releases measured), |5 min|, |15 min| and |60 min| (median move in points, direction ignored), Swing 15m, Follows surprise, Spread x and Next release (a countdown, highlighted when less than 24 hours away). The bar under each name shows the 15-minute move to scale.
- A row starting with "=" comes out at the same time as an event above it in at least 80% of its releases, for example Nonfarm Payrolls with the Unemployment Rate. The moves are the same releases, so do not count them as two signals.
- The tab lists the first 18 events. Click a row to open it in Event detail.
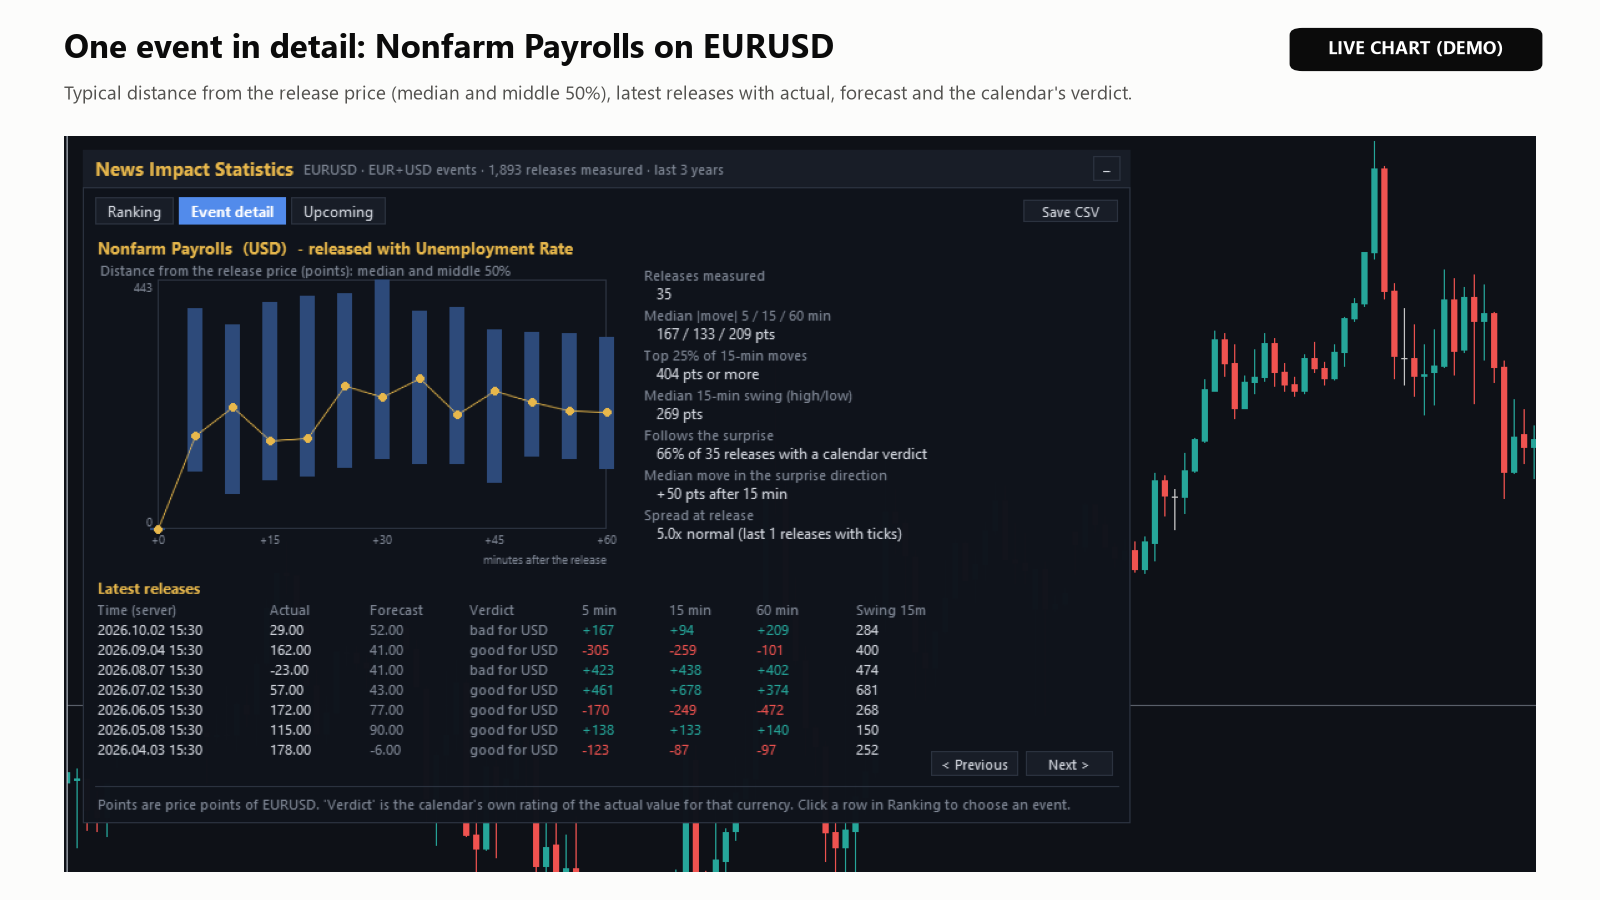
- Event detail: the graph shows the distance from the release price every 5 minutes during the first hour. The line is the median, the bars are the middle 50% of releases.
- Latest releases: the last 7 releases with server time, actual, forecast, the calendar's verdict, the moves after 5, 15 and 60 minutes (+ up, - down) and the 15-minute swing. < Previous and Next > step through the events in ranking order.
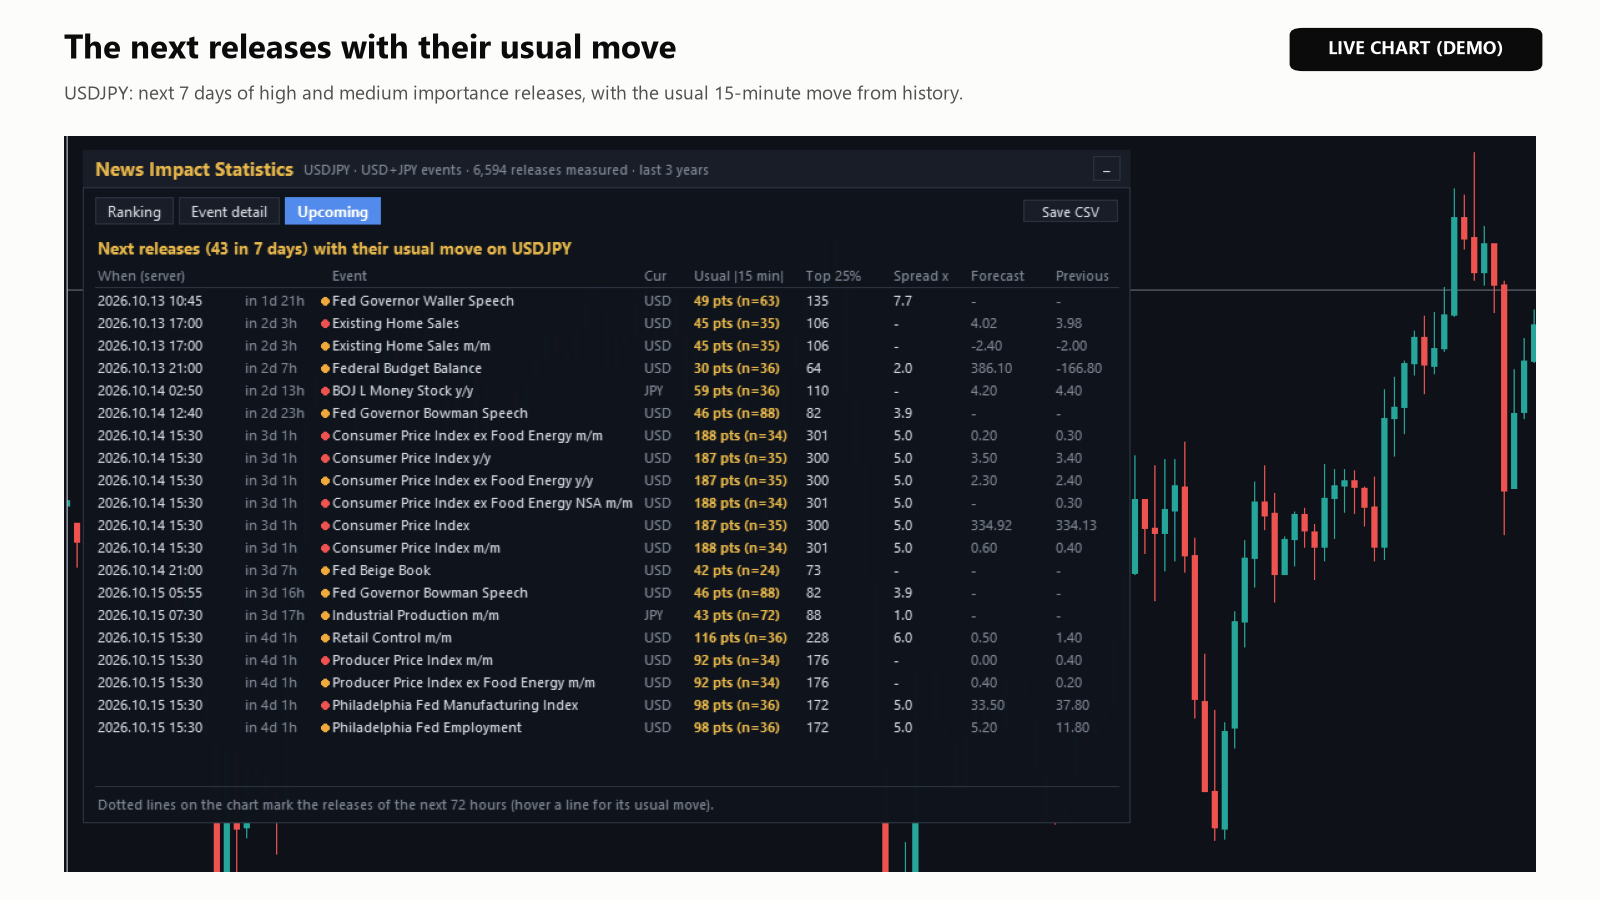
- Upcoming: the coming releases, about a week ahead (up to 20 rows), with server time, a countdown, an importance dot (red high, orange medium), the usual 15-minute move with its number of releases, Top 25%, Spread x, forecast and previous value. "new / no history" means nothing has been measured for that event.
- Releases of the next 72 hours are also drawn on the chart as dotted vertical lines. Hover a line to see the event and its typical 15-minute move.
- Save CSV (top right) writes <symbol>_events.csv (all events) and <symbol>_releases.csv (every measured release, with server and UTC time) to MQL5\Files\NewsImpactStatistics\ . The Experts tab shows the path.
- The – button at the top right folds the panel to its title bar. The panel remembers the open tab and the folded state for each chart.
How to read the numbers
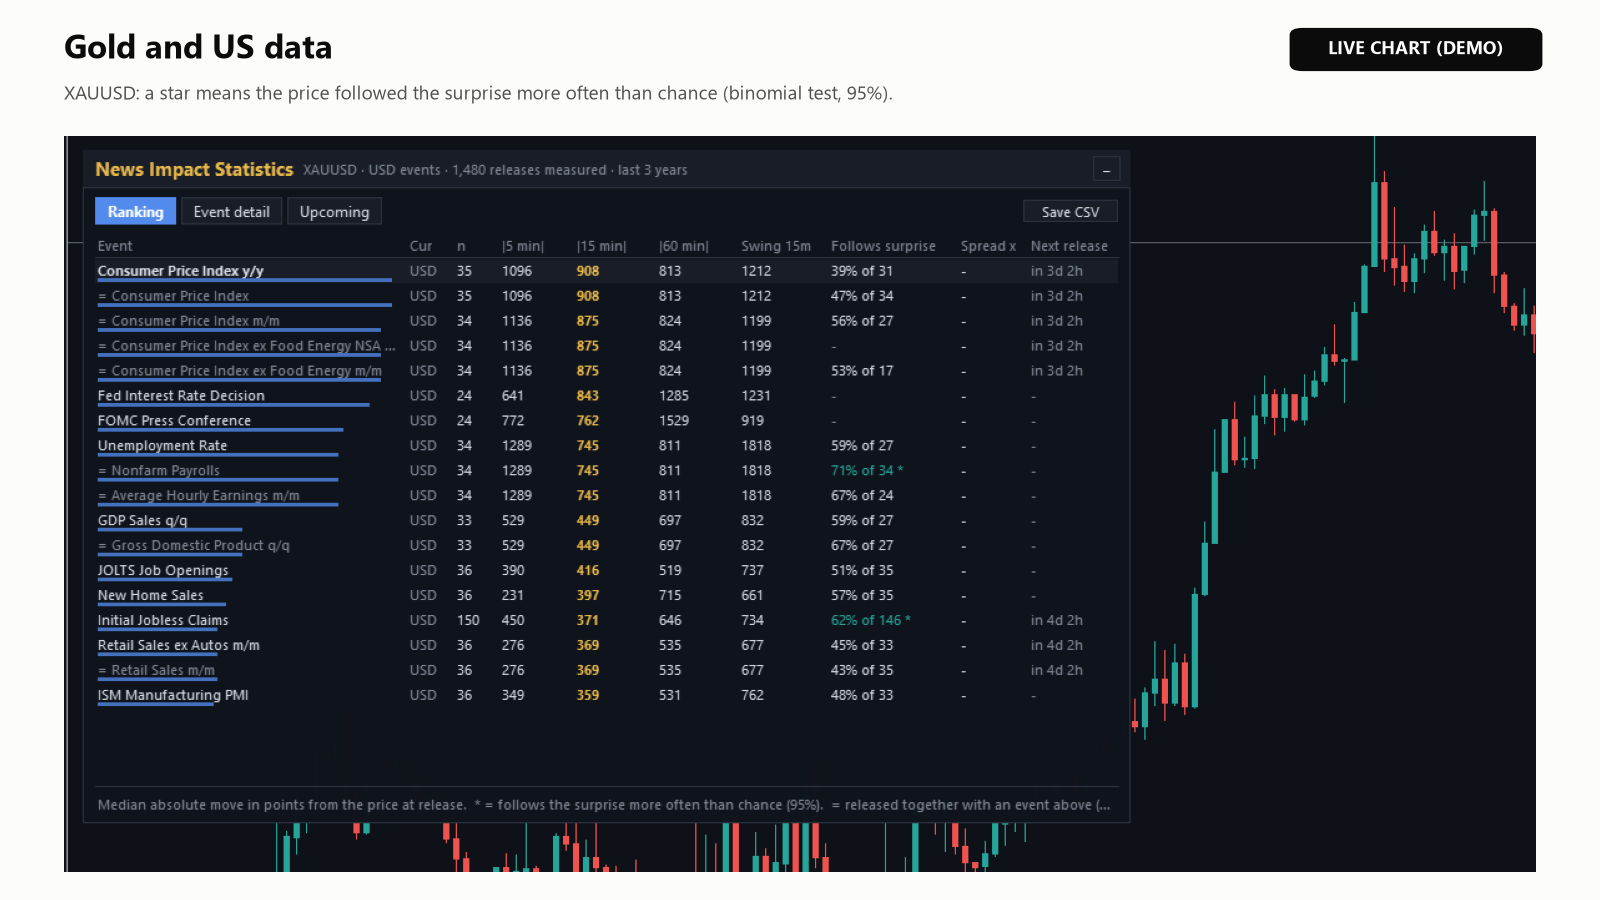
- Points are price points of the chart symbol. On a 5-digit EURUSD quote, 10 points are 1 pip. On XAUUSD quoted with 2 decimals, 908 points are 9.08 USD.
- A median of 133 in |15 min| means half of the releases were less than 133 points away after 15 minutes. Top 25% is the size that one release in four reached or exceeded.
- Swing 15m is never smaller than |15 min|, because it includes spikes that came back before the 15 minutes were over. For stop distances it is the more useful number.
- Follows surprise, for example "64% of 28": of 28 releases with a verdict and a 15-minute move, 64% moved the way the verdict points. It is shown from 8 such releases. A star (*) means more than chance would explain (binomial test against 50/50, 95%). Without a star, the direction may be chance.
- Median move in the surprise direction (Event detail): positive means the typical release moved with the verdict, negative against it.
- Spread x is the average over the releases with tick data: 5.0 means the spread rose to about 5 times its normal level.
- In the picture (XAUUSD, demo account), Nonfarm Payrolls followed the verdict in 71% of 34 releases (*); Consumer Price Index y/y moved most but followed it in only 39% of 31. These are past reactions on one broker's prices, not forecasts.
Inputs
The inputs are in two groups, Events and Chart and panel. The names are as they appear on the Inputs tab.
| Input | Default | What it does |
|---|---|---|
| Importance | High importance only | Or High and medium importance. |
| Currencies (empty = the chart symbol's currencies, e.g. EUR,USD) | (empty) | Calendar currencies, separated by commas. |
| Years of history | 3 | From 1 to 10. Limited by the price history in the terminal. |
| Only events whose name contains (optional) | (empty) | Not case-sensitive, for example payrolls . |
| Event names | Terminal language | Or English (from the calendar event code). |
| Spread at release: use tick data of the last N days (0 = off) | 30 | Only releases of the last N days get a Spread x. |
| Draw the next releases on the chart (vertical lines) | true | Red for high, orange for medium importance. |
| ... for the next N hours | 72 | How far ahead the lines go. |
| Tab to open first | Ranking | Or Event detail or Upcoming. Once you click a tab, the chart reopens on the last one used. |
| Event to show first in 'Event detail' (part of its name) | (empty) | For example nonfarm . Combine it with Tab to open first = Event detail. |
| Server GMT offset in hours (-99 = detect automatically) | -99 | Used only for the UTC time in the releases CSV. The panel always shows server time. |
| Panel X (pixels) | 12 | From the left edge of the chart. |
| Panel Y (pixels) | 28 | From the top edge. |
Strategy Tester
- The economic calendar is not available in the Strategy Tester, so there the indicator shows built-in sample data, and the panel title reads "SAMPLE DATA - the economic calendar is not available in the Strategy Tester". The free demo runs in the tester and shows this sample.
- The sample has 8 typical events, such as Nonfarm Payrolls, CPI m/m and two rate decisions, with made-up numbers for trying the three tabs. They are not measurements.
- Use visual mode to see the panel. No lines are drawn on the chart in the tester. For real numbers, attach the indicator to a normal chart.
Questions users ask
- "No releases found." Check that the symbol's currencies have events of the chosen importance in Toolbox > Calendar, that Currencies and the name filter are not too narrow, and that enough price history is loaded.
- Some cells show "-". |5 min| needs M1 or M5 bars for that date; older dates may have only M15. Follows surprise needs 8 releases with a verdict. Spread x needs tick data, so it is empty for releases older than 30 days (the default) or when the input is 0.
- The numbers differ from another broker. They are measured on your broker's prices, and spreads and slippage around releases differ between brokers.
- Can an EA read the results? The indicator has no buffers, so iCustom cannot read them. Use Save CSV and read the files in MQL5\Files\NewsImpactStatistics\.
- Can I use it on several charts? Yes, one copy per chart. A purchase includes 10 activations.
- Will the next release move as much? Not necessarily. The numbers describe past reactions; they are not forecasts.
Product page: News Impact Statistics. If something is unclear, send me a private message on MQL5 with a screenshot of the panel and the last lines of the Experts tab.

Files:
01_ranking.png
235 kb
02_detail.png
220 kb
04_upcoming.png
304 kb
03_gold.png
222 kb
newsimpact_widget.png
13 kb


