Expert Advisor Live Audit (MT5): User Manual, Status, Backtest Comparison and Execution Costs

Expert Advisor Live Audit is an indicator for MetaTrader 5 that checks the Expert Advisors on your account. It reads this account's trade history, groups it by magic number and helps you answer three questions for each EA: is it broken, just unlucky, or eaten by costs? It is for anyone who runs EAs and wants to check their live results and costs against the backtest. This manual applies to version 1.00.
What it measures
- Live statistics per EA: win rate, profit factor, net result, maximum drawdown and the 90% interval of the average trade, with a status.
- Backtest comparison (optional): are the live results inside the range the backtest allows?
- Execution costs: entry and exit slippage, spread at entry, server execution time, commission, fees and swap.
- It reads the whole account, not only the chart symbol. Only positions opened and fully closed inside the look-back period count.
- It is read-only: it never places, modifies or closes an order. No DLL, no web requests, nothing to add to the WebRequest list.
Installation
- Buy the indicator on the product page.
- In MetaTrader 5: Toolbox > Market > Purchased > Install. Updates appear in the same place (Update).
- It appears under Navigator > Indicators > Market.
First steps
- Drag the indicator onto any chart, any symbol and timeframe. One chart is enough.
- The panel opens at the top left. The header shows the trade server, the number of EAs and closed trades, and the period.
- Costs are worked out gradually in the background, and the terminal may first load tick history. On a long history this takes a while.
- New deals are checked every 10 seconds; the panel updates itself.
- SAMPLE DATA in the header means you see the built-in sample, not this account. Set "Show built-in sample data" to false.
The – button at the top right folds the panel and + opens it again. Panel X and Panel Y move it.
The four tabs
The screenshots show the built-in sample data.
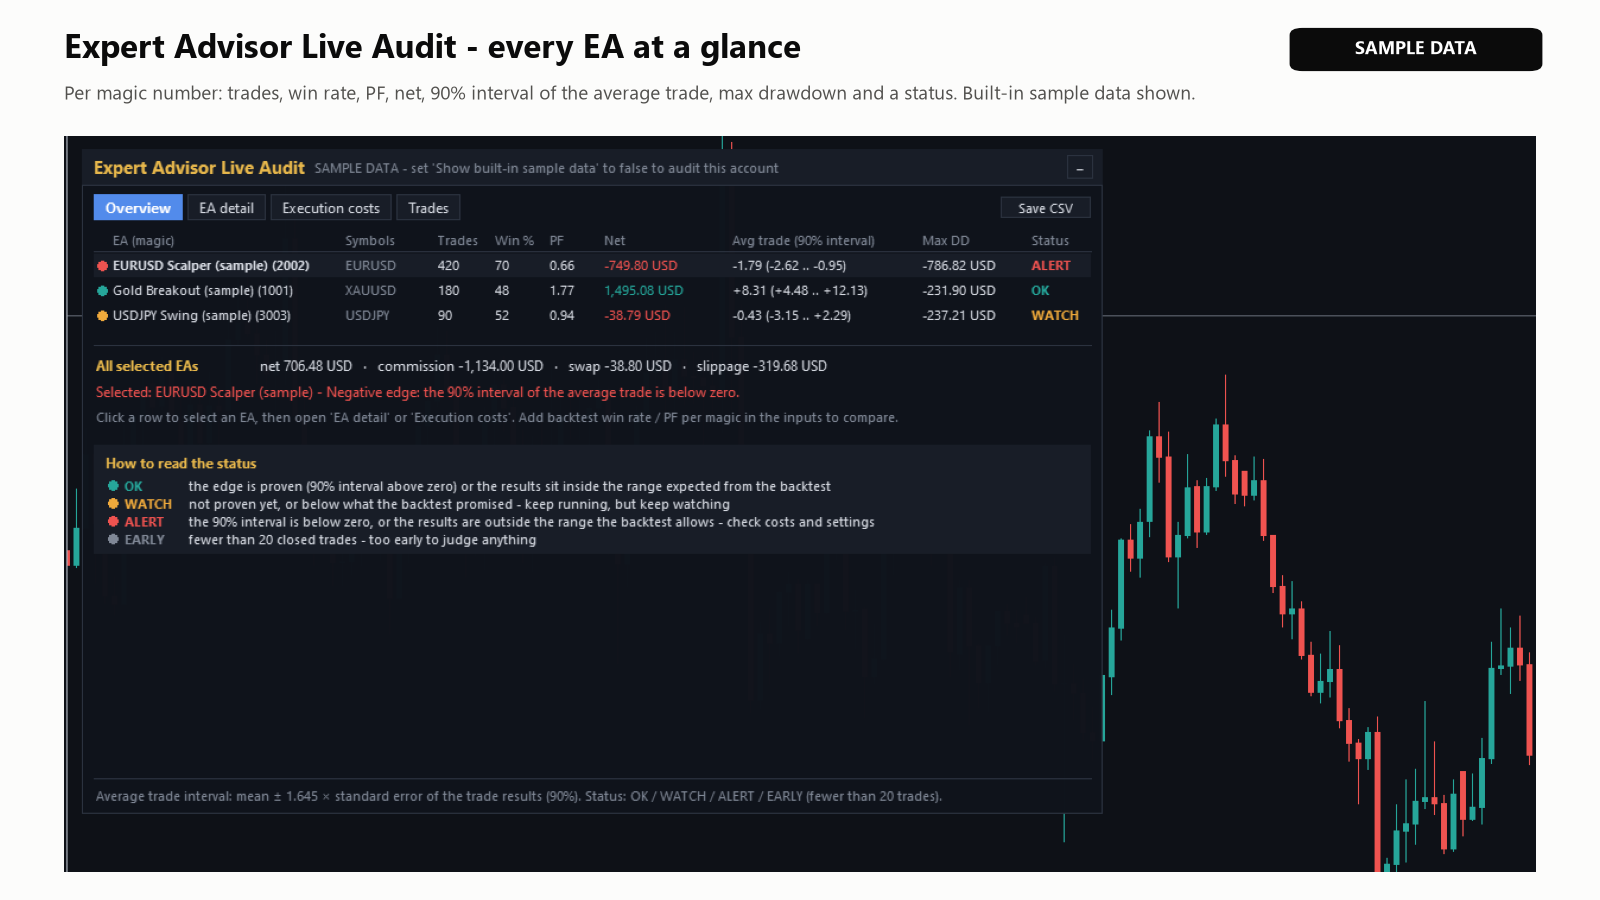
Overview: one row per EA, most trades first, with Trades, Win %, PF, Net, Avg trade (90% interval), Max DD and Status. The figures use each trade's net result after commission and swap; a win is a result above zero. Max DD is the deepest fall of the closed-trade equity. Up to 14 EAs fit; with more, use the magic filter. Below: "All selected EAs" (net, commission, swap, slippage), the verdict of the EA you selected and a status key. Click a row to select an EA for the other tabs.
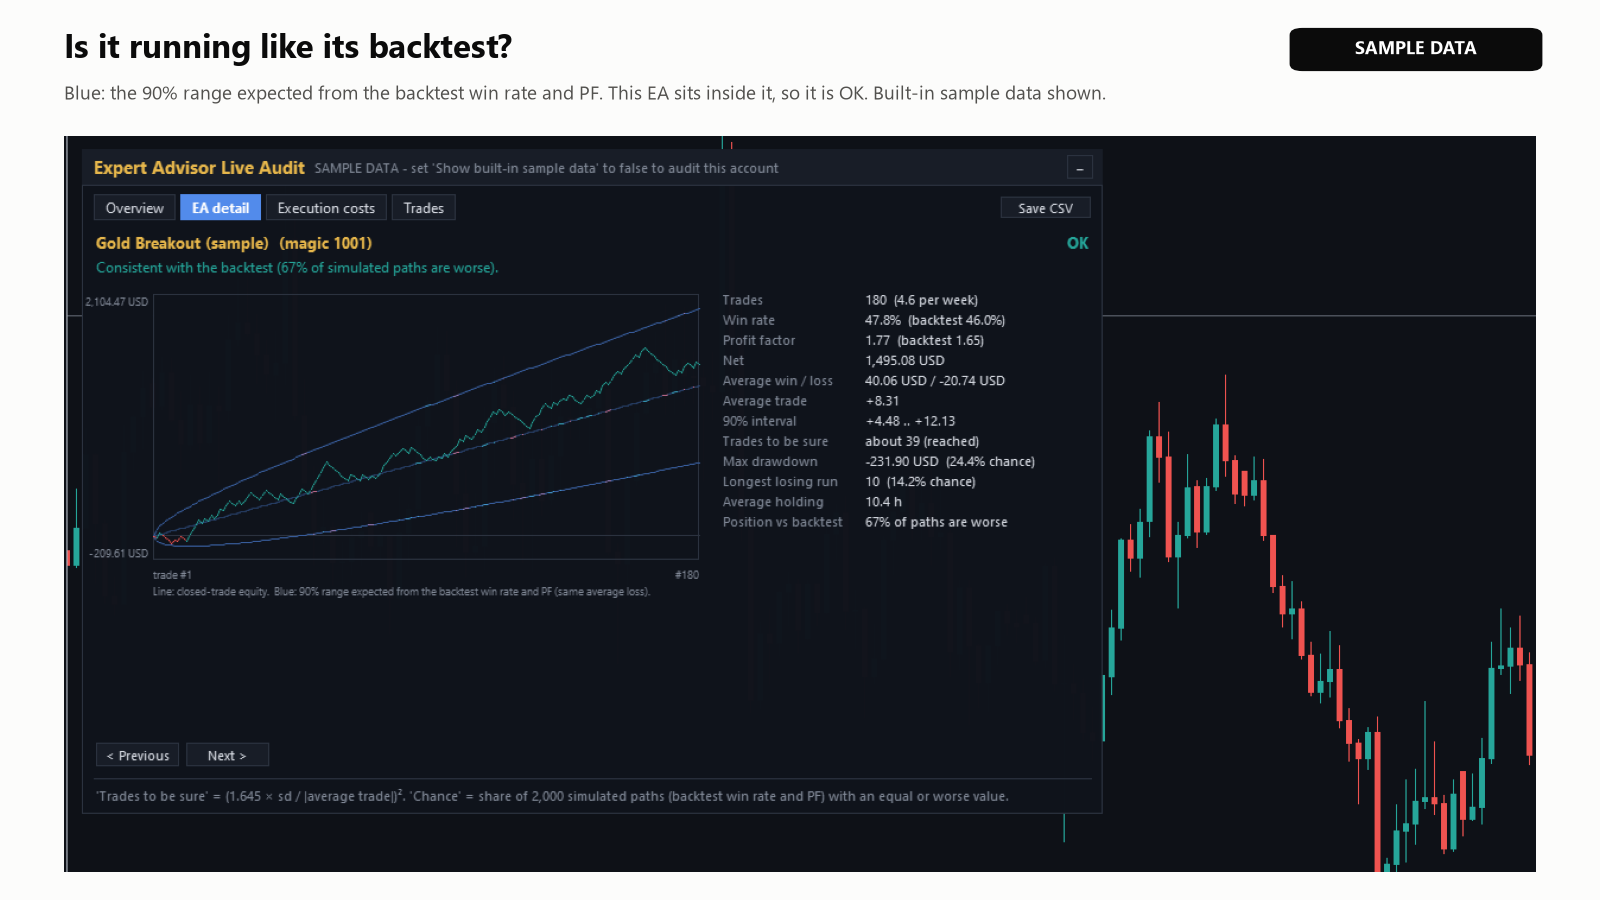
EA detail: the verdict, the closed-trade equity line and the figures of the selected EA, from Win rate and Profit factor to Trades to be sure, Max drawdown and Longest losing run. "< Previous" and "Next >" step through the EAs.
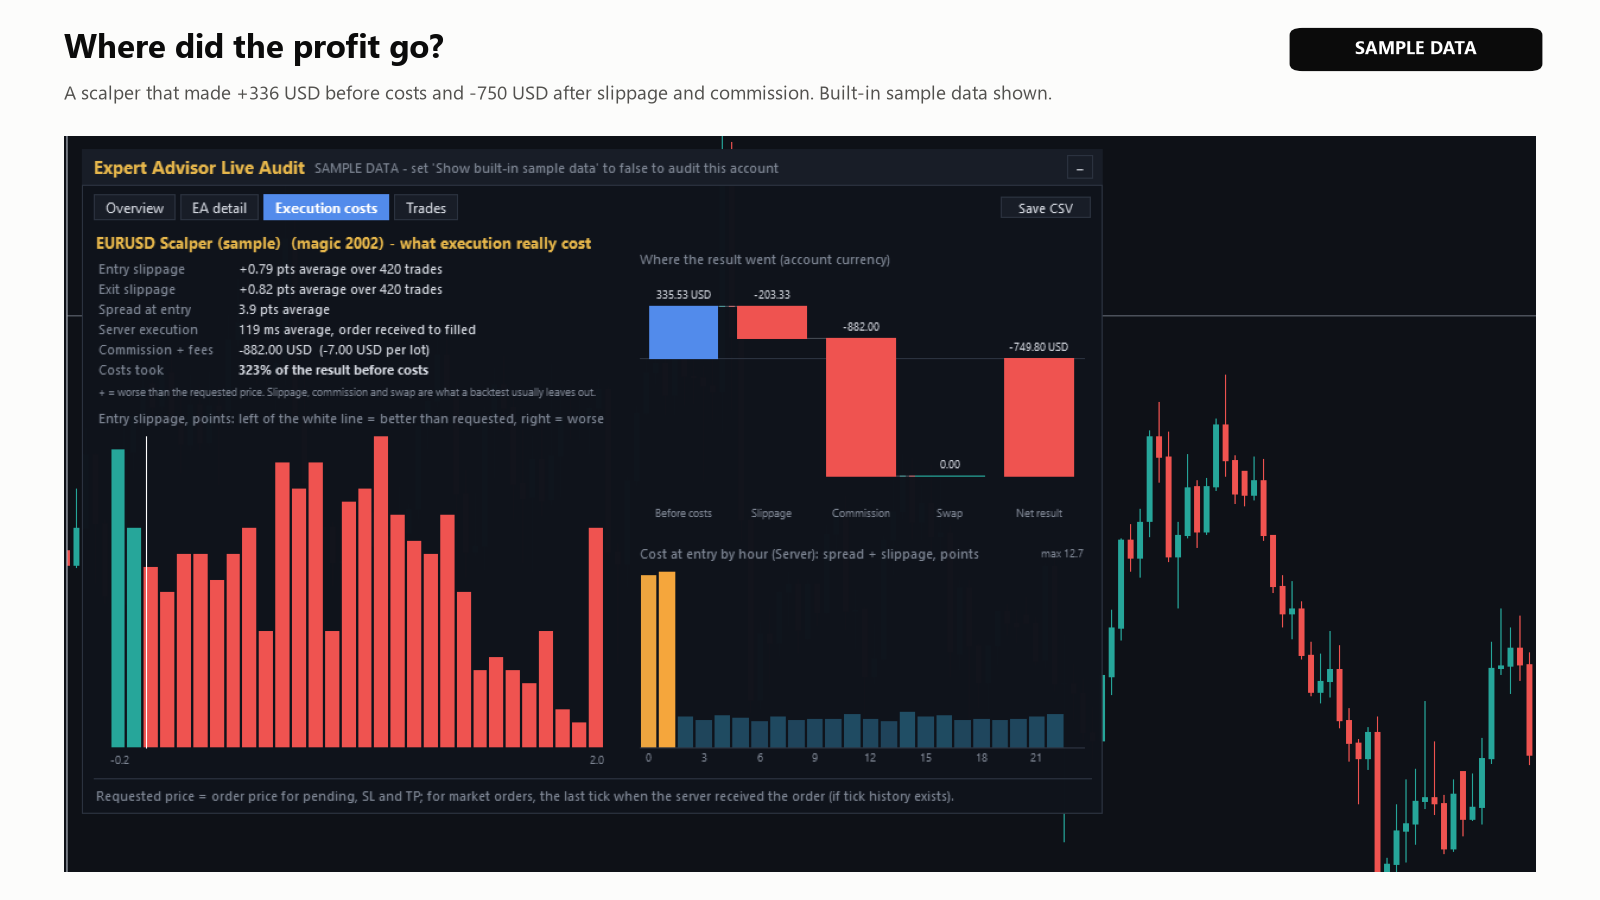
Execution costs: Entry and Exit slippage (average points; + = worse than requested), Spread at entry, Server execution (ms), Commission + fees, and "Costs took": the share of the result before costs lost to slippage, commission and swap (it can exceed 100%). A waterfall goes from Before costs through Slippage, Commission and Swap to Net result. Two charts show the entry slippage (left of the white line = better than requested) and the cost at entry by hour (spread + slippage; point at a bar for details).
How costs are measured: pending orders, stop-loss and take-profit compare the fill with the order price. Market orders use the order price in the history if there is one, otherwise the last tick when the server received the order (only with tick history for that time). Spread at entry: from ticks, otherwise from the 1-minute bar. Server execution: "order received" to "filled".
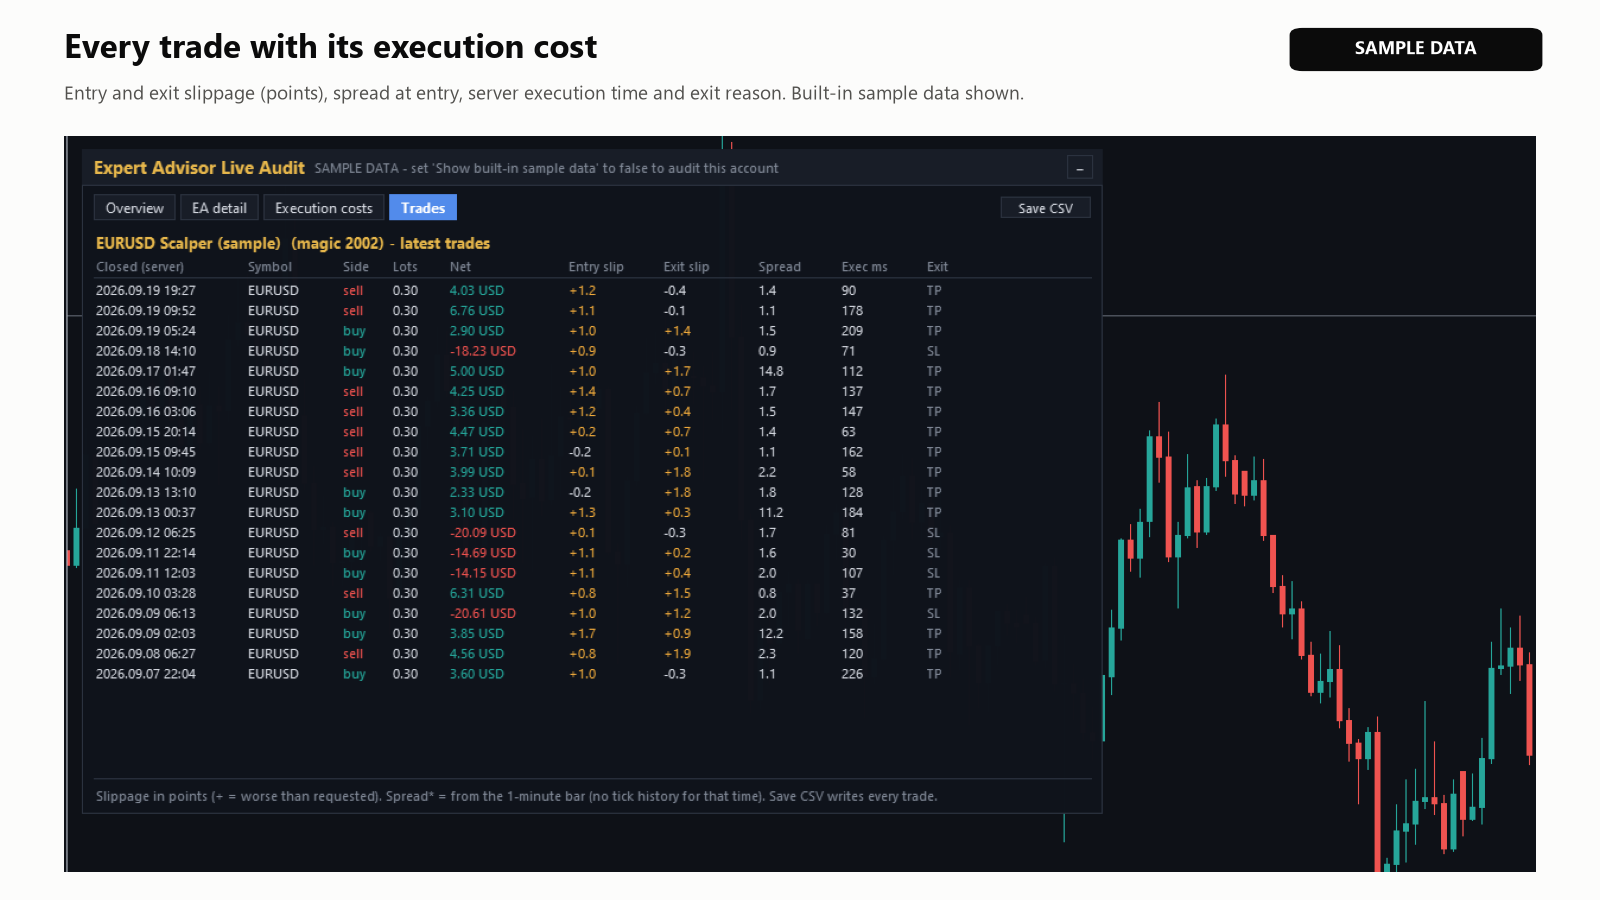
Trades: the latest 20 trades of the selected EA with Entry slip, Exit slip, Spread (* = from the 1-minute bar), Exec ms and Exit (SL, TP, stop out, EA, manual, mobile, web).
How to read the status
EARLY (grey): fewer than 20 closed trades, too early to judge. Otherwise, without backtest expectations:
- OK (green): the whole 90% interval of the average trade is above zero.
- WATCH (orange): the interval includes zero. Not proven yet.
- ALERT (red): the whole interval is below zero.
The 90% interval is the average trade (mean net result per trade) ± 1.645 × standard error (standard deviation of the trade results / √trades). In plain words: with this much scatter, the true average trade lies in this range with about 90% confidence. Above zero, the profit is unlikely to be luck alone; across zero, the trades so far cannot tell. Trades to be sure = (1.645 × standard deviation / |average trade|)²: about how many trades it takes, at the current average and scatter, until the interval no longer includes zero.
With backtest expectations, the status comes from the backtest comparison instead: OK when 10% or more of the simulated paths are worse than the live net result, WATCH at 2.5% to 10%, ALERT below 2.5%. When the EA is shown in EA detail, its drawdown is checked too: if a drawdown that deep occurs in fewer than 2.5% of the paths, OK becomes WATCH ("Drawdown is unusually deep").
All numbers describe the past. A status of OK does not mean that an EA will stay profitable.
Comparing with your backtest
Take the win rate (%) and the profit factor from the EA's Strategy Tester report. In the input "Per EA: magic=winrate/PF" (group "Backtest expectations (optional)") write one entry per EA, separated by ";", for example 1001=62/1.45; 2002=48/1.8 . Write the win rate in percent (62, not 0.62), above 1 and below 99, with a profit factor above 0.05, or the entry is ignored.
The live average loss is the scale and the average win follows from the backtest win rate and profit factor, so lot size does not matter. EA detail then shows the blue band (the 90% range expected from the backtest), the backtest values next to Win rate and Profit factor, "Position vs backtest" (the share of simulated paths worse than the live result) and a "chance" for Max drawdown and Longest losing run (the share of up to 2,000 simulated paths with an equal or worse value). Only the drawdown can change the status.
Inputs
Names as shown in the Inputs tab.
| Input | Default | What it does |
|---|---|---|
| Look back N days (0 = all history) | 365 | Positions opened and closed in the last N days. 0 = all history. |
| Only these magic numbers, comma separated (empty = all) | (empty) | For example 1001, 2002. Add 0 to keep manual trades. |
| Include manual trades (magic 0) | true | Magic 0 is shown as "Manual trades". |
| Names for magic numbers: 1001=Gold breakout; 2002=Scalper | (empty) | Separated by ";". Without a name: the most common entry comment, or "Magic" and the number. |
| Per EA: magic=winrate/PF, e.g. 1001=62/1.45; 2002=48/1.8 | (empty) | Backtest win rate (%) and profit factor per EA. Turns on the comparison. |
| Tab to open first | Overview | Used the first time on a chart; later the panel reopens the tab used last there. |
| Time zone for 'cost by hour' | Broker server time | Or UTC, New York, London (both DST aware), Tokyo. Affects only that chart. |
| Server GMT offset in hours (-99 = detect automatically) | -99 | Only for another time zone. Automatic: the current offset for the last 7 days, before that GMT+2 (GMT+3 in US summer time). If hours look shifted, enter your broker's offset. |
| Panel X (pixels) | 12 | Distance from the left edge of the chart. |
| Panel Y (pixels) | 28 | Distance from the top edge of the chart. |
| Show built-in sample data (preview the panels) | false | true = the sample instead of this account. |
| EA to select first (magic, 0 = the one that needs attention) | 0 | 0 = ALERT first, then WATCH, OK, EARLY; then the most trades. |
Saving CSV
Save CSV (top right) writes two UTF-8 files to MQL5\Files\ExpertAdvisorLiveAudit\ in the terminal's data folder and prints the path in the Experts tab. The names start with the last three digits of the account number (for example 123_trades.csv ), or with sample_ . Each click replaces them. Times are server time, slippage and spread are in points, win_rate is a fraction (0.62 = 62%), commission includes fees, and an empty cell means not measurable.
- trades.csv, every trade: magic,label,position,symbol,side,volume,open_time,close_time,open_price,close_price,gross,commission,swap,net,entry_slip_pts,exit_slip_pts,entry_spread_pts,spread_source,exec_in_ms,exec_out_ms,exit_reason,pending_entry
- summary.csv, one row per EA: magic,label,trades,win_rate,profit_factor,net,avg_trade,ci90_low,ci90_high,trades_to_be_sure,max_drawdown,max_losing_run,entry_slip_avg_pts,exit_slip_avg_pts,spread_avg_pts,exec_avg_ms,slippage_money,commission,swap,status,verdict
In the Strategy Tester
The tester has no account history, so there, including the free demo, the indicator always shows built-in sample data marked SAMPLE DATA. The panel is drawn in visual mode. The sample has three made-up EAs (magic 1001, 2002, 3003). Gold Breakout (sample), 1001, has a built-in backtest expectation (win rate 46%, PF 1.65), so its EA detail shows the blue band. The sample numbers say nothing about any real EA or broker.
Questions users ask
- "No closed trades in the selected period". Only positions opened and closed inside the look-back period count; open positions appear once they are closed. Check that "Only these magic numbers" is empty or lists the right numbers. Manual trades appear only with "Include manual trades" on.
- Slippage says "not measurable for these trades". Market orders without an order price in the history need the terminal's tick history for the moment the order was received.
- My EA is called "Magic 1001". Set your own names in "Names for magic numbers".
- The status changed after I opened EA detail. The drawdown check runs there; an unusually deep drawdown turns OK into WATCH.
Product page: Expert Advisor Live Audit. If something is unclear, send me a private message on MQL5 with a screenshot of the panel and the last lines of the Experts tab.