Seasonality and Session Lab (MT5): User Manual, Tabs, Statistical Tests and Inputs

Seasonality and Session Lab is an indicator for MetaTrader 5 that shows how the chart symbol behaves by hour, weekday, day of month, month and on special days (gotobi, month end, first Friday), and which of those patterns pass a strict statistical test. It is for traders who plan stops, targets and trading hours by the clock, and for anyone who wants to check a time pattern before building a strategy on it. It does not trade. This manual applies to version 1.00.
What it measures
- From H1 bars (5 years by default): the average range (high minus low), spread and move (close minus open) of every hour and every weekday-hour cell.
- From daily bars: the mean daily move by day of month and by month. In a window you choose: the move on gotobi days, month ends, first Fridays, Mondays and Fridays against all other days.
- All values are in points. Any symbol and timeframe. No orders, no DLL, no web requests.
Installation
- Buy the indicator on the product page, then install it in MetaTrader 5: Toolbox > Market > Purchased > Install. Updates are in the same place (Update).
- Drag it from Navigator > Indicators > Market onto a chart of the symbol you want to study (any timeframe) and click OK. It loads the bars it needs by itself.
First steps
- Wait for the first result. While history downloads, the panel shows a loading message and tries again every second.
- Check the title line: symbol, period used, number of H1 bars and time zone.
- Choose the time zone on the panel (Server, UTC, NY, London or Tokyo). Hours, weekdays and day types are recalculated in that zone.
- Point at a bar or a cell: the bottom line of the panel shows its details (n, mean move, t, share of up bars, range, spread, after cost).
- The – button minimizes the panel and + opens it again. To move it, change Panel X and Panel Y.
The tabs
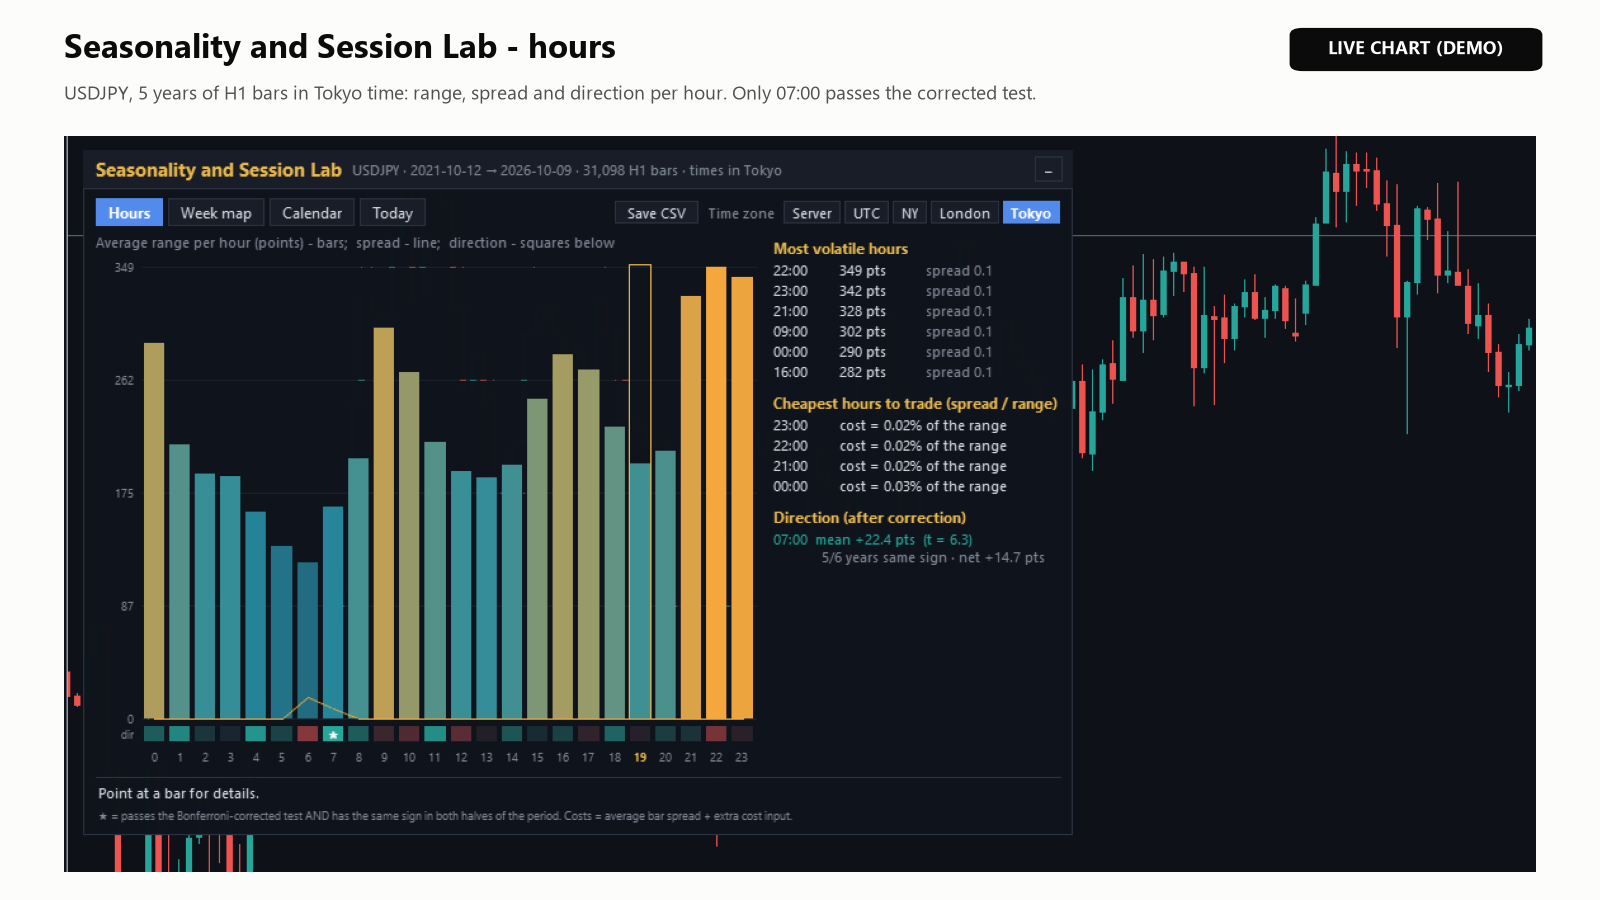
- Hours: bars for the average range of each hour, a line for the average spread on the same scale, and squares for the direction (green up, red down, a star when it passes the test). The current hour is framed. On the right: Most volatile hours, Cheapest hours to trade (spread / range) and Direction (after correction), with the years of the same sign and the result after cost.
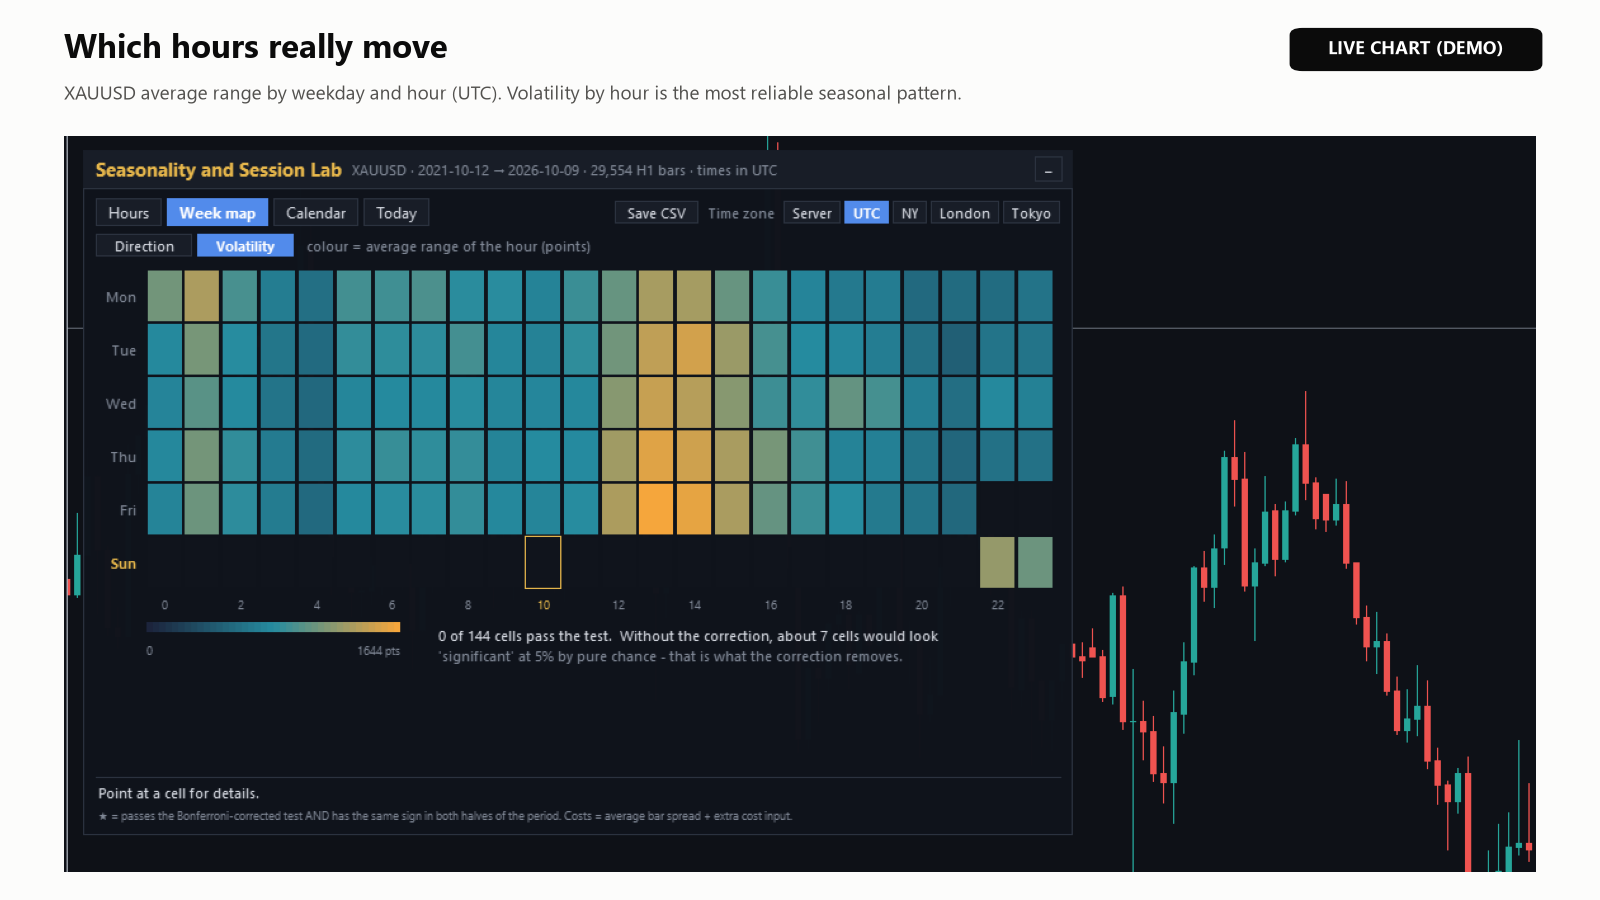
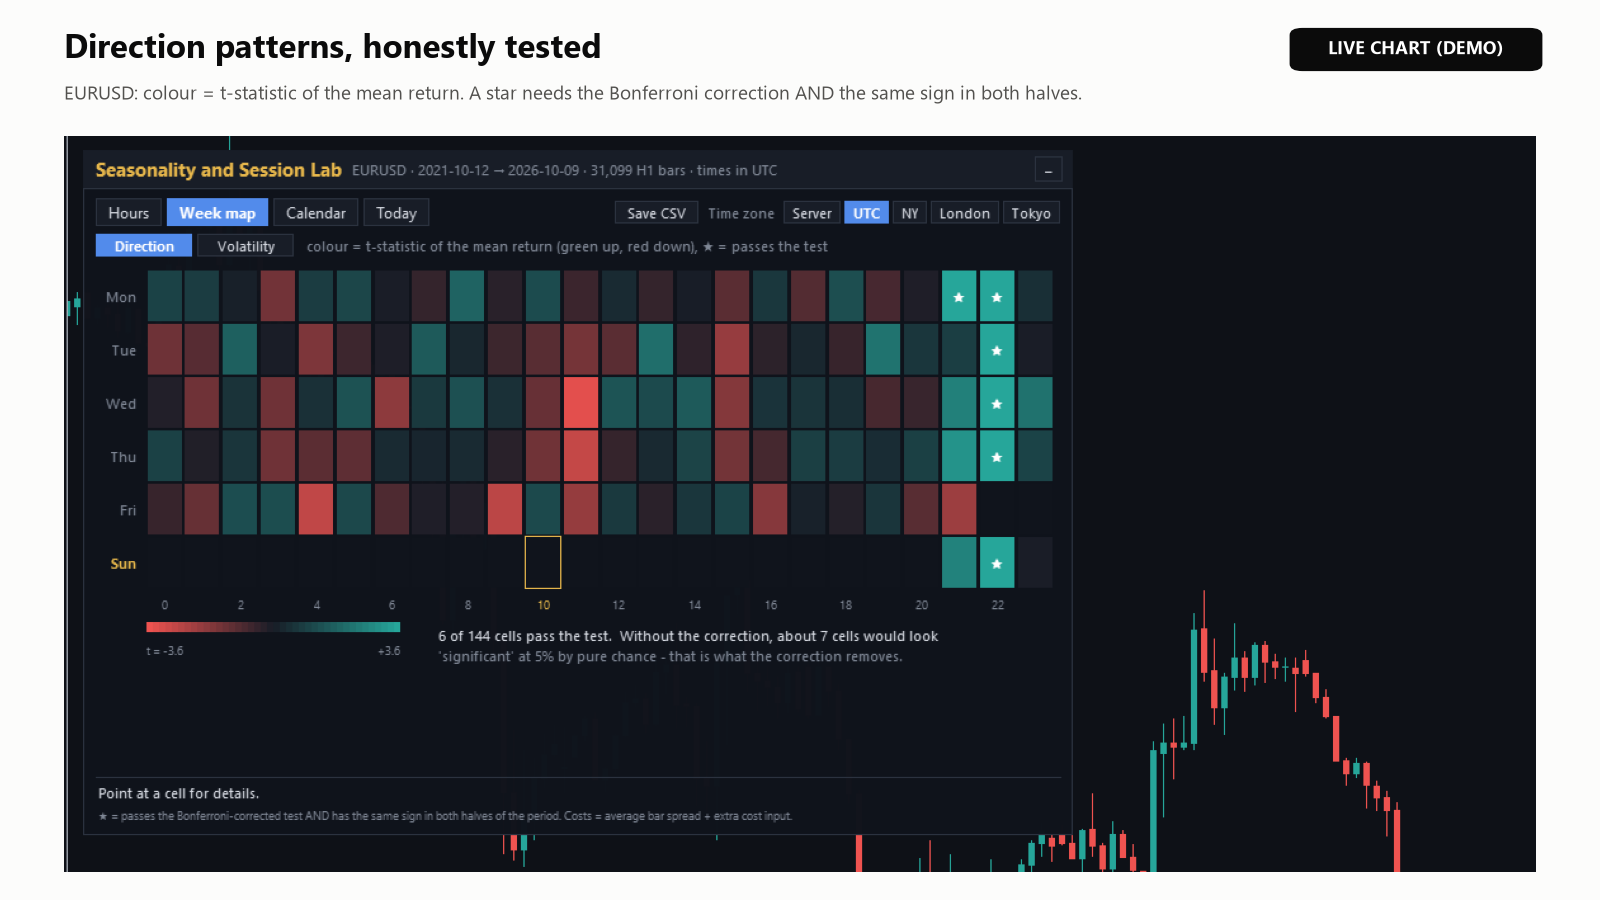
- Week map: weekday x hour cells coloured by the t-statistic (Direction) or by the average range (Volatility), with how many cells pass and how many would pass by chance without the correction.
- Calendar: the mean daily move by day of month and by month, and the day-type table (see below).
- Today: today's range so far against past days, the typical range from this hour to the end of the day, this hour's volatility rank and the next high-volatility hours.
How to read the results
Range and spread are plain averages; only the direction is tested. When you compare many cells, some look special by chance alone: at the usual 5% level, about 8 of 168 weekday-hour cells pass even in random data. So a cell gets a star (★) only when all three checks pass:
- Corrected test. The t-statistic (the mean move divided by its standard error), up or down, reaches the Bonferroni threshold for the number of cells compared instead of 1.96: about 3.08 for the 24 hours, 3.53 to 3.62 for the week map (120 to 168 cells), 3.15 for the days of the month and 2.87 for the months.
- Both halves. The period is split at its middle date, and the mean has the same sign in both halves.
- Enough data. At least 30 observations, and at least 10 in each half.
- After cost is the size of the mean move minus the average spread of that cell and your extra cost. "none" or "eaten by cost" means nothing is left.
- Years same sign (Hours tab) counts the years with at least 20 bars at that hour whose total move had the same sign as the overall mean; information only, not part of the star.
Example: on USDJPY in Tokyo time only 07:00 passed (mean +22.4 points, t = 6.3, the same sign in 5 of 6 years, +14.7 points after the spread of that hour). A star describes your broker's past prices, not a promise that the pattern continues.
Gotobi and calendar effects
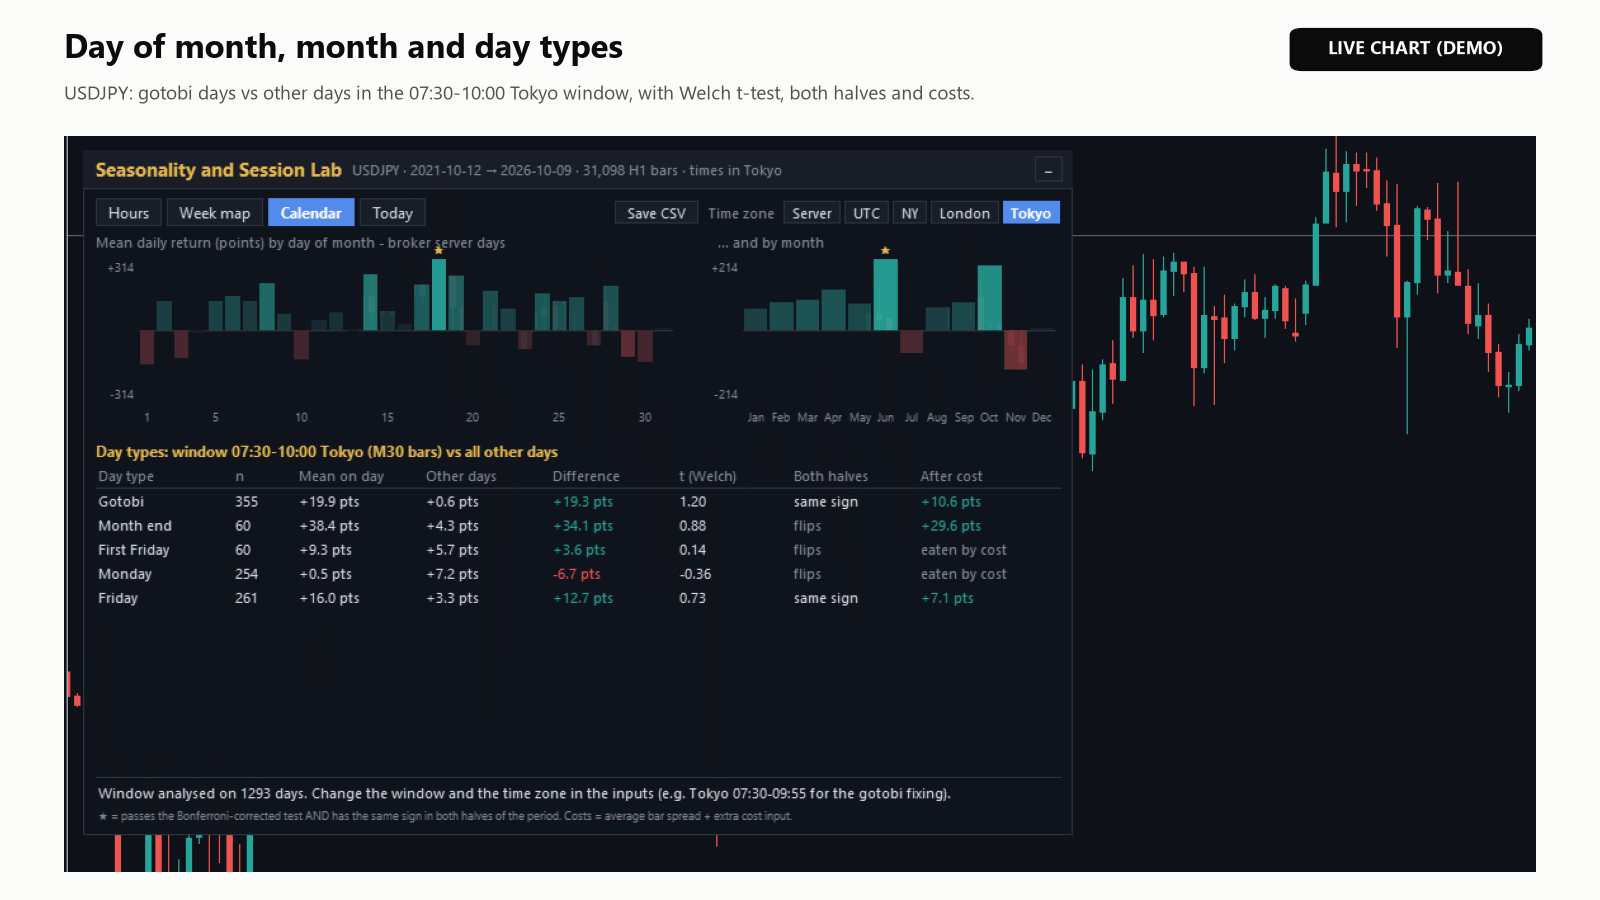
- The day-of-month and month bars use the broker's daily bars (server days) in every time zone.
- The day-type table compares the move from Window start to Window end (selected time zone) on Gotobi days (5th, 10th, 15th, 20th, 25th and month-end, moved to the previous Japanese business day), Month end (last business day, Monday to Friday), First Friday (US jobs report day), Monday and Friday with all other days.
- Gotobi uses the Japanese date. Japanese bank holidays (31 December to 3 January included) are calculated inside the indicator; no calendar file is needed.
- A day type gets a star when t (Welch) is at least 2.58 in size (Bonferroni for 5 day types), the difference has the same sign in both halves (at least 5 such days in each) and there are at least 20 such days. After cost is the mean move on those days minus the average spread at the window start and your extra cost.
- The window is rounded to the finest bars (M5, M15, M30 or H1) whose history covers the period; the table title shows the window used. Start and end must be on the same day.
For the Tokyo fixing, choose Tokyo and 07:30 to 09:55. In the screenshot (USDJPY, 5 years, rounded to 07:30-10:00 with M30 bars) gotobi mornings rose 19.3 points more than other mornings, but t = 1.20 is far below 2.58, so there is no star: this data cannot tell the difference apart from chance, which is not proof that the effect is absent.
Time zones and the broker clock
- Server is the broker's chart time. New York and London follow daylight saving time; Tokyo is always UTC+9.
- At -99, Server GMT offset is detected for every week from the Friday 17:00 New York close of a forex symbol (the chart symbol or a major pair such as EURUSD), so the server's daylight-saving changes are handled. Undetected weeks use GMT+2 in winter and GMT+3 in US summer. The Today tab footer shows the offset in use, for example "server GMT+3.0 (live + weekly close)".
- A whole number from -12 to 14 fixes the offset by hand for the whole period. Leave -99 if your broker changes its offset with daylight saving.
Inputs
The inputs are in three groups: Data, Day-type comparison (Calendar tab) and Panel.
| Input | Default | What it does |
|---|---|---|
| Years of history (limited by 'Max bars in chart') | 5 | 1 to 30. The title line shows the period actually used. |
| Time zone for hours and days | UTC | Broker server time, UTC, New York (DST aware), London (DST aware) or Tokyo. |
| Server GMT offset in hours (-99 = detect automatically) | -99 | Or a fixed offset from -12 to 14. |
| Extra cost per round trip in points (commission + slippage) | 0.0 | Added to the average bar spread. |
| Window start in the selected time zone (HH:MM) | 00:00 | Start of the day-type window. |
| Window end (HH:MM) | 23:59 | Later than the start, same day. 23:59 = to the end of the day. |
| Tab to open first | Hours | Hours, Week map, Calendar or Today. |
| Week map colour | Direction (t-statistic) | Or Volatility (average range). |
| Panel X (pixels) | 12 | From the left edge of the chart. |
| Panel Y (pixels) | 28 | From the top edge of the chart. |
Once you click a tab, a time-zone button or Direction/Volatility, the panel keeps that choice for this chart, and it wins over the matching input.
Saving results
Save CSV writes three files to MQL5\Files\SeasonalitySessionLab\, named after the symbol and the time zone, for example USDJPY_Tokyo_hours.csv, _weekmap.csv and _daytypes.csv. The Experts tab shows the path; saving again replaces the files. Columns:
- hours: hour, n, mean_ret_pts, t, significant, up_pct, avg_range_pts, avg_abs_ret_pts, avg_spread_pts, first_half_mean, second_half_mean, after_cost_pts
- weekmap: weekday, hour, n, mean_ret_pts, t, significant, avg_range_pts, avg_spread_pts
- daytypes: day_type, window, n_in, mean_in_pts, n_out, mean_out_pts, diff_pts, welch_t, first_half_diff, second_half_diff
Strategy Tester behaviour
- It places no orders, so a test gives no trades. Use visual mode; without it the panel is not drawn. The statistics use the bars before the test date.
- The tester cannot report the broker's time zone, so only the chart symbol's last bar before each weekend is used, otherwise GMT+2 in winter and GMT+3 in US summer. If your broker's clock differs, enter its offset in Server GMT offset.
Questions users ask
- It stays on "Loading H1 history...". It needs at least 480 H1 bars; the number in brackets is the count so far. Detecting the server time zone can take up to about 40 seconds.
- It shows fewer years than I set. History is limited by "Max bars in chart" (Tools > Options > Charts). 100,000 H1 bars cover more than ten years.
- No star anywhere. That is the normal result: most direction patterns are noise. The range and spread of each hour still help with stops, targets and trading hours.
- The hours look shifted. Check the time-zone button and the offset in the Today tab footer. If the offset is wrong, enter it in Server GMT offset.
- Can I trade the starred patterns? The results are statistics of your broker's past prices. They are not trading signals and do not predict the future.
- Can I use it on several charts? Yes, and each chart keeps its own panel choices. A purchase includes 10 activations.
Product page: Seasonality and Session Lab. If something is unclear, send me a private message on MQL5 with a screenshot of the panel and the last lines of the Experts tab.