Namiyomi Zero Shot Range (MT5): User Manual, the Panel, Inputs and How to Read the Forecast

Namiyomi Zero Shot Range is an indicator for MetaTrader 5 that forecasts how far price may move in the next 1, 4 and 24 hours (the expected high-low range) with a zero-shot time-series AI that runs inside the terminal. It does not forecast the direction and it never trades. It is meant for traders who size stops and positions to the expected range, or who want to know whether the market is quieter or busier than usual for the hour. This manual covers installation, each tab of the panel, every input, how to read the forecast, the Strategy Tester and the questions buyers ask most. It applies to version 1.00.
What it shows
- The expected high-low range for the next 1, 4 and 24 hours, in pips on 5- and 3-digit quotes and in price on other quotes such as BTCUSD.
- Calm, Normal or Wild: the 4-hour forecast compared with the forecasts made at the same hour on the last 20 days.
- A lot helper for manual trading and a track record on your own chart. Everything is on one panel: no arrows, no lines on the price chart, no buy or sell signals.
Installation
- After you buy the indicator on the product page, install it in MetaTrader 5: Toolbox > Market > Purchased > Install. Updates are in the same place (Update).
- Open a chart of EURUSD, GBPUSD, USDJPY, AUDUSD, USDCHF or BTCUSD. Names with a suffix such as EURUSD.raw work. Any timeframe works: the indicator always reads H1 bars.
- Drag Namiyomi Zero Shot Range from Navigator > Indicators > Market onto the chart and click OK. It does not trade, so Algo Trading does not need to be on.
- The panel appears at the top left of the chart. The forecast appears once the terminal has 512 closed H1 bars of the symbol; the Track record tab takes about 10 more seconds.
The panel
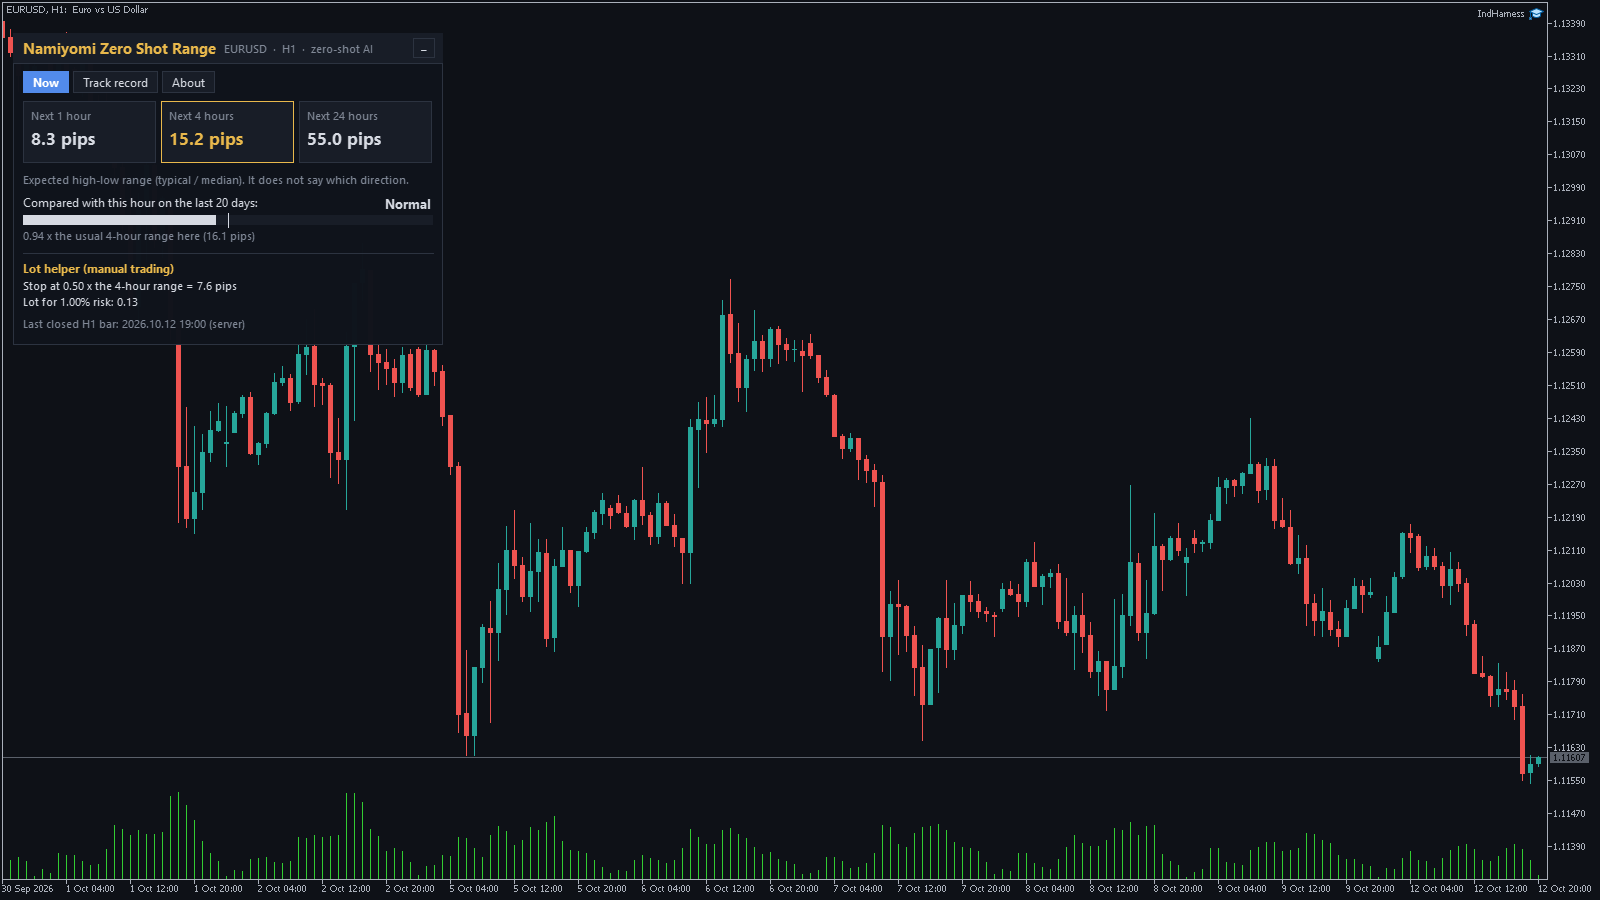
- Now: Next 1 hour, Next 4 hours and Next 24 hours, each with the expected high-low range. The 4-hour box is highlighted; the comparison and the Lot helper use this value.
- Compared with this hour on the last 20 days: the current 4-hour forecast divided by the median of the 4-hour forecasts made 24, 48 … 480 H1 bars earlier. Below 0.8 is Calm (blue), 0.8 to 1.25 Normal, above 1.25 Wild (orange). The line in the middle of the bar marks 1.0 x. In the screenshot the 4-hour forecast was 15.2 pips, 0.94 x the usual 16.1 pips for that hour: Normal.
- Lot helper (manual trading): the stop at Stop distance x the 4-hour forecast, and the lot for your risk: equity x risk % divided by the money value of that stop for 1 lot, rounded down to the volume step. It does not check margin or the broker's lot limits. When the result rounds down to 0 it shows "Lot: not available for this account".
- Last closed H1 bar: the server time of the last bar the forecast used. The numbers change once an hour, when a new H1 bar closes.

- Track record: for the last 500 hours (an input), the indicator recomputes the forecast it would have made before each 4-hour window, from bars that had already closed, and compares it with the actual 4-hour high-low range on your chart.
- The bars show the correlation with the actual range on a log scale, for the AI forecast and for ATR(14) x 2. Higher is better: 1.00 would mean they always rose and fell together, 0 no relation. It is not a hit rate and not a profit figure. The chart below shows the last 120 hours: the line is the forecast, the dots are what actually happened.
- The tab is built once, after the first forecast, at about 60 hours per second. It is not rebuilt every hour, and if the H1 history was still short at that moment it covers fewer hours. To rebuild it, switch the chart timeframe and back.
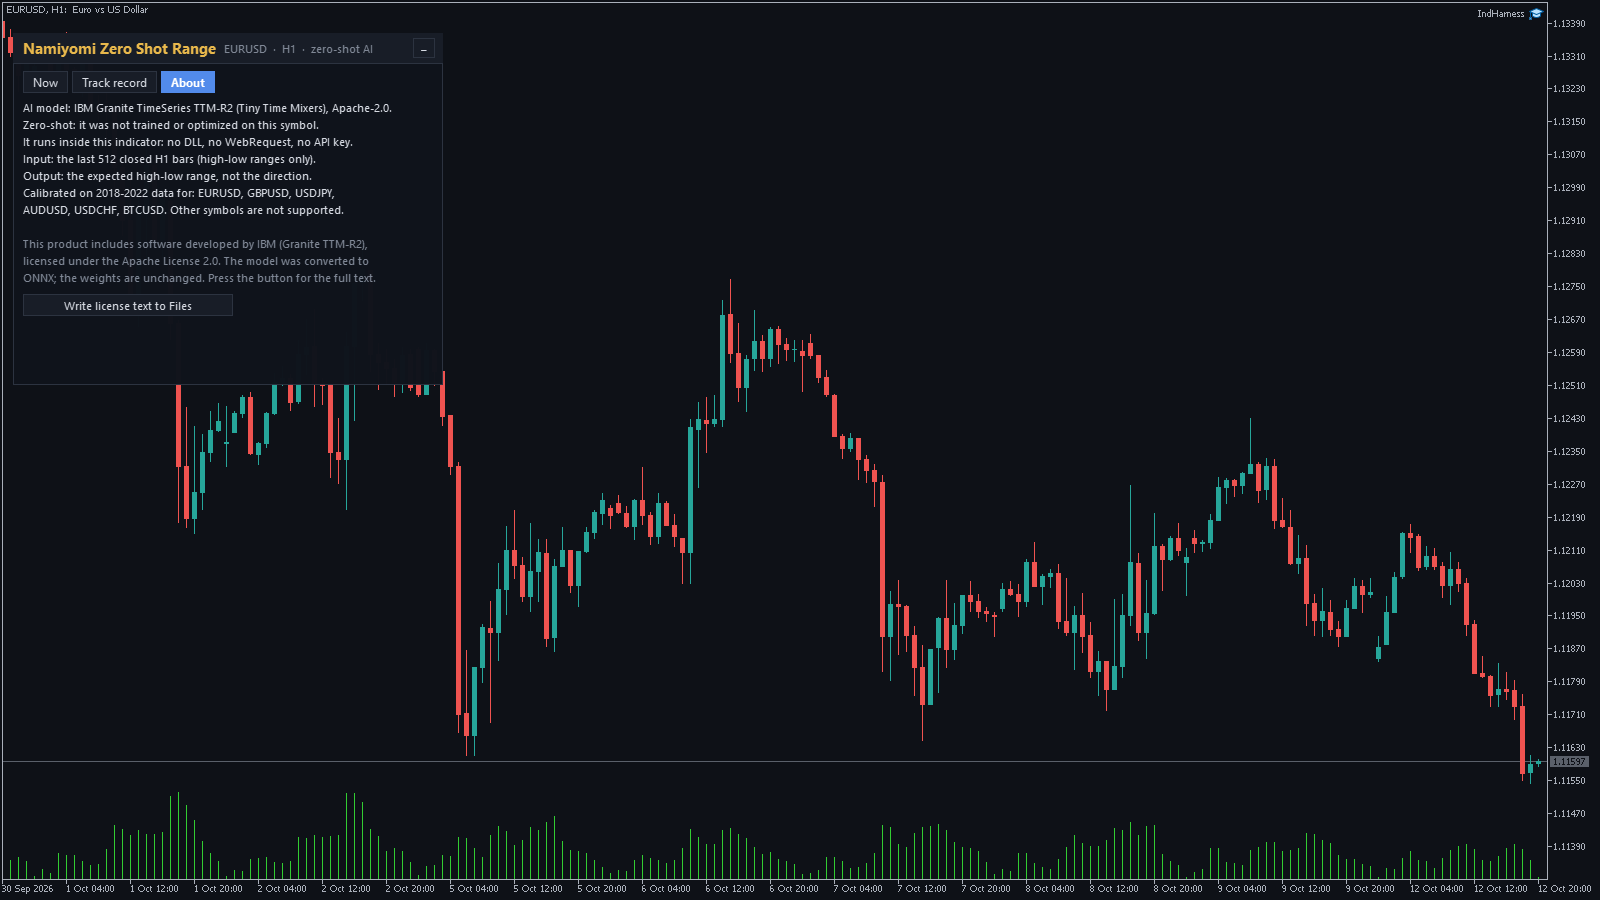
- About: the AI model, its input and output, the symbols it was calibrated for and the license notice. Write license text to Files writes MQL5\Files\NamiyomiZeroShotRange_LICENSE.txt with the attribution, the changes made for ONNX and the full Apache License 2.0 text.
- The minus button (–) in the title bar folds the panel and + opens it again. The panel keeps the open tab and the folded state for each chart. To move it, change Panel X position and Panel Y position.
Inputs
| Input | Default | What it does |
|---|---|---|
| Panel X position | 10 | Distance of the panel from the left edge of the chart, in pixels. |
| Panel Y position | 30 | Distance of the panel from the top edge of the chart, in pixels. |
| Risk per trade for the lot helper (% of equity) | 1.0 | The risk the Lot helper uses. It only changes the number shown; nothing is traded. |
| Stop distance for the lot helper (x the 4-hour range) | 0.5 | The Lot helper's stop as a multiple of the 4-hour forecast. 0.5 = half the expected range. |
| Hours used for the track record | 500 | How many past hours the Track record tab checks, from 50 to 3000. More hours need more H1 history and take longer to build. |
| First tab (0 = Now, 1 = Track record, 2 = About) | 0 | The tab shown when the indicator starts. After you click a tab, the panel keeps your choice on that chart. |
How to read the forecast in practice
- A typical size, not a limit. The numbers are the expected (median) range, so the actual range is often larger or smaller. The model sees only past H1 ranges, not the economic calendar, so it cannot see a scheduled news release coming.
- The windows start at the open of the current H1 bar. Next 1 hour is the bar that is forming now; Next 4 hours is that bar and the next three. Late in the hour, part of the window has already passed.
- Calm, Normal and Wild compare like with like. Ranges depend on the hour of the day. Comparing with the same hour on earlier days removes that effect, so Wild means busier than usual for this hour.
- Use it to size, not to choose a side. A wider expected range means a wider stop and, for the same risk, a smaller lot. You can also compare the forecast with the move your strategy needs: when the expected range is smaller, the market may be too quiet for it.
- The 24-hour number is the rougher one. In our tests the AI's advantage over simple models was in the next 1 and 4 hours; for 24 hours it was about the same.
What our tests showed (not a promise)
- Data: H1 bars of 7 symbols from an IC Markets demo account. The calibration was fitted on 2018–2022. The main test period, 2025-01 to 2026-10, came after the model was published, so it was not in its pre-training data; 2023–2024 pointed the same way.
- Next 4 hours: on 6 of 7 symbols the AI's error was smaller than that of the better of two standard econometric baselines, HAR and an hour-of-day profile. The gain was small but consistent: the median error was about 4.5% lower. Against ATR the error was about 20–50% lower, but ATR ignores the time of day, so that is the easy comparison. On XAUUSD HAR was more accurate, so XAUUSD is not supported.
- We also tested trading rules built on the forecast: a breakout, a fade and a published time-of-day pattern. None passed our profit tests after costs.
- These are results on past data from one broker, not a promise of future accuracy or profit.
Using it in the Strategy Tester
- Open the Strategy Tester (Ctrl+R), select Namiyomi Zero Shot Range and a supported symbol. Any timeframe works.
- Test with visualization. The panel is drawn only on a visible chart and the indicator has no buffers, so without visualization there is nothing to see.
- The forecast starts once 512 closed H1 bars are available; the 20-day comparison and the Track record need about 1,000. The Track record is built once, at the first forecast of the test.
- The tester does not save your tab choice; use First tab to choose the tab the panel opens on.
Technical notes
- Model: IBM Granite TimeSeries TTM-R2 (Tiny Time Mixers), the 512-96 version, under the Apache License 2.0, converted to ONNX and embedded in the indicator. The weights are unchanged. No DLL, no WebRequest, no API key, no external server.
- Zero-shot means the weights were not trained or fine-tuned on your symbol. A small per-symbol calibration, fitted on 2018–2022 data, turns the model output into a range in price.
- Data window: the last 512 closed H1 bars, high-low range only (as a log ratio). It recalculates when a new H1 bar closes, not on every tick; one model run took about 1 ms in our MT5 tests.
- Symbols: the name must start with EURUSD, GBPUSD, USDJPY, AUDUSD, USDCHF or BTCUSD. On other symbols the panel shows "This symbol is not supported (see About)." XAUUSD is not supported: in our tests the AI was less accurate than HAR on gold. Version 1.00 still shows numbers on XAUUSD charts (a calibration from those tests is built in), so do not rely on them.
Questions buyers ask
- Does it tell me when to buy or sell? No. It forecasts how far price may move, not which way, and it never trades.
- The panel says "This symbol is not supported (see About)." Check that the symbol name starts with one of the six names: EURUSD.raw works, #EURUSD does not. If the name is right, send me the last lines of the Experts tab: the same message appears when the AI model could not be loaded.
- The panel stays at "Loading H1 history..." or "Waiting for H1 history (512 bars are needed)...". The terminal is still loading H1 history. Wait a minute, or open an H1 chart of the symbol and scroll back. The indicator tries again every second.
- The comparison shows "(-)" and Normal. There is not yet enough H1 history for any earlier day; the full 20 days need about 1,000 H1 bars. While "(-)" is shown, the ratio is 1.00.
- Does it repaint? The forecast uses closed H1 bars only and changes once an hour. In the Track record each past forecast uses only the bars that had closed before its 4-hour window.
- Can my EA use the forecast? Not in version 1.00. The indicator has no buffers, so iCustom cannot read the values; they are shown only on the panel.
Product page: Namiyomi Zero Shot Range. If something is unclear, send me a private message on MQL5 with a screenshot of the panel and the last lines of the Experts tab.