
The opening-range breakout paper, replicated on five indices: gross reproduced, net zero

"Can Day Trading Really Be Profitable?" by Zarattini and Aziz (SSRN 4416622) is probably the most read intraday paper of the last years, and the opening-range breakout it describes turns up in the Market and in the Freelance section every week. The rule: take the direction of the first 5-minute candle, enter at the open of the second, stop at the other side of the first candle, target ten times the risk or the session close. The paper reports a 24% hit rate, +0.13 R per trade and, with 4x leverage, 33% a year on QQQ. It charges commission but no spread and no slippage, and it has no out-of-sample period.
I ran the rule unchanged on my own minute data: NQ, SPX, Dow, DAX and FTSE CFDs, cash session, January 2015 to June 2026, 2,899 to 2,937 sessions per market. Two answers came out, and they do not contradict each other.
| Question | Does the opening-range breakout from Zarattini and Aziz (SSRN 4416622) survive trading costs? |
| Data | NQ, SPX, Dow, DAX and FTSE CFDs, cash session, January 2015 to June 2026, 2,899 to 2,937 sessions per market. |
| Answer | Gross yes: +0.131 R on NQ, as in the paper. Net no: no market is distinguishable from zero, four of five are negative. |
Gross, the paper reproduces
| Market | n | avg R (gross) | t | Hit rate | 10 R hits |
|---|---|---|---|---|---|
| NQ | 2,934 | +0.131 | +2.9 | 23.2% | 2.4% |
| SPX | 2,931 | +0.119 | +2.4 | 20.1% | 3.6% |
| Dow | 2,937 | +0.048 | +1.1 | 22.6% | 2.6% |
| DAX | 2,921 | +0.116 | +2.4 | 20.8% | 3.7% |
| FTSE | 2,899 | +0.050 | +1.1 | 23.2% | 2.2% |
On NQ the paper's +0.13 R and 24% come back as +0.131 R and 23.2%, on a different instrument, a longer period and an independent data set. That is a clean replication and worth saying so: the paper's arithmetic is right. The shape is also as described: a hit rate near 20% with a 10 R target means the average trade loses, and two to four days in a hundred pay for everything.
Net, the same rule is a coin flip with a fee
Now spread and slippage, charged on every trade as a share of the initial risk (NQ 2.5, SPX 0.8, Dow 4.0, DAX 2.5, FTSE 1.5 points). One floor is needed: when the first candle closes right at its own extreme, the stop is a point or two from the entry and the cost share explodes, so the initial risk must be at least twice the round-trip cost.
| Market | n | Gross | Net | t (net) | Rule minus random direction, net | t |
|---|---|---|---|---|---|---|
| NQ | 2,638 | +0.147 | +0.002 | 0.0 | +0.124 | +2.1 |
| SPX | 2,564 | +0.113 | −0.081 | −1.6 | +0.092 | +1.2 |
| Dow | 2,835 | +0.041 | −0.081 | −1.9 | +0.021 | +0.4 |
| DAX | 2,835 | +0.100 | −0.038 | −0.8 | +0.128 | +2.5 |
| FTSE | 2,796 | +0.069 | −0.079 | −1.8 | +0.106 | +2.0 |
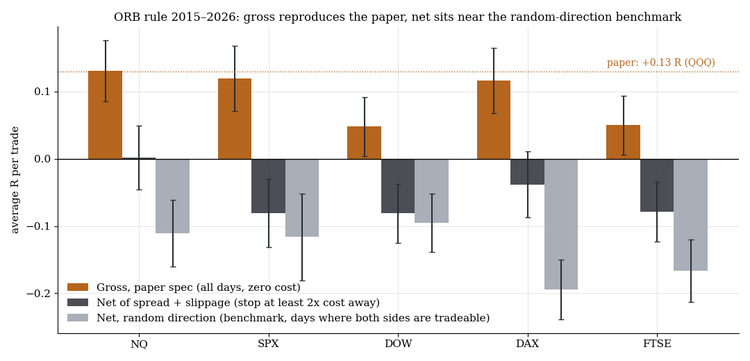
Gross reproduces the paper, net sits near the random-direction benchmark.
Net of costs no market is distinguishable from zero and four of five are negative. NQ, the paper's own market, ends at +0.002 R.
The last two columns answer a different question: does the first candle carry any information at all? For that I ran the identical bracket long and short on every day and took the mean, the return a coin flip would earn. In NQ, DAX and FTSE the rule beats random direction by +0.10 to +0.13 R at |t| of 2 or more. The first 5-minute candle does know something about the next hours. It knows roughly 0.1 R worth, and 0.1 R is what a 2.5-point round trip costs on a 25-point stop.
Where the 33% a year comes from
Not from a different measurement. From the same +0.13 R multiplied through three assumptions a retail account does not get: zero spread and slippage (6 to 12% of the risk on every trade here), 4x leverage on a 20% hit rate (losing streaks of ten and more are routine, and a daily loss limit does not survive that), and a sample from 2016 to 2023 that skips the dead years. In 2015 to 2017 the rule is negative in every market and significantly so in NQ and SPX. No market and no epoch is significantly positive net; the out-of-sample years 2021 to 2026 give +0.06 R on NQ at best.
What it means for your EA
The paper is right about the pattern and wrong about the trade. The colour of the first 5-minute candle carries a small, real directional edge against a random-direction benchmark, present in four of five indices and still there out of sample. On a CFD account the edge is the size of the spread. For anyone who wants to build on it, the useful part is the benchmark method, not the rule: an M1 bracket simulation has discretisation bias, so only the difference between the rule and the same bracket with random direction is a clean number.
Limits
CFD data with the spreads and slippage stated above, the paper's rule unchanged and no parameter search. The out-of-sample years 2021 to 2026 give +0.06 R on NQ at best; futures with commission only were not tested.
Full study (all tables, the method, every limit and the PDF): The ORB paper, replicated on five indices
More research notes: my blog · Tools for prop firm accounts: all my products
Historical statistics are no guarantee of future market behaviour. This is not investment advice.




