Gold reached all three targets in the displayed SELL setups on M5, M15 and H1 on September 8, 2026. Yet the historical panels behind those setups tell three different stories.
M15 shows the highest displayed Profit Factor: 1.78, compared with 1.45 on M5 and 1.37 on H1.
That gives me a reason to inspect M15 more closely. Choosing a timeframe still takes more than finding the largest number.
It is easy to open Gold on the timeframe we know best. I prefer to check the historical profile before deciding where to focus.
First, understand what each setup represents
TrendCue Core confirms BUY and SELL signals after candle close. The enabled filters determine whether a signal qualifies.
A qualified setup receives fixed Entry, TP1, TP2 and TP3 levels. From there, it has two exit paths: the predefined target plan, or an earlier exit when an opposite confirmed signal appears.
That exit structure matters when reading the statistics. A setup can end before completing its target sequence.
In all three screenshots, the displayed SELL is qualified, bearish Context is aligned, and the higher-timeframe filter is off.
The September 8 comparison
These are the values shown directly in the three panels. All use BALANCED management.
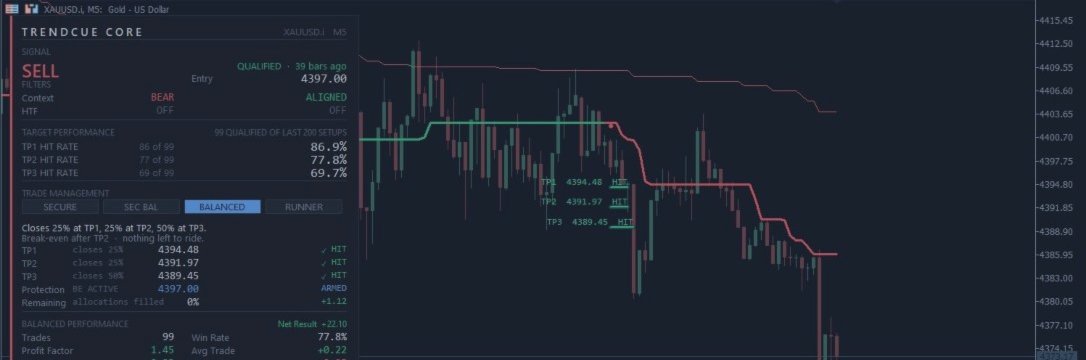
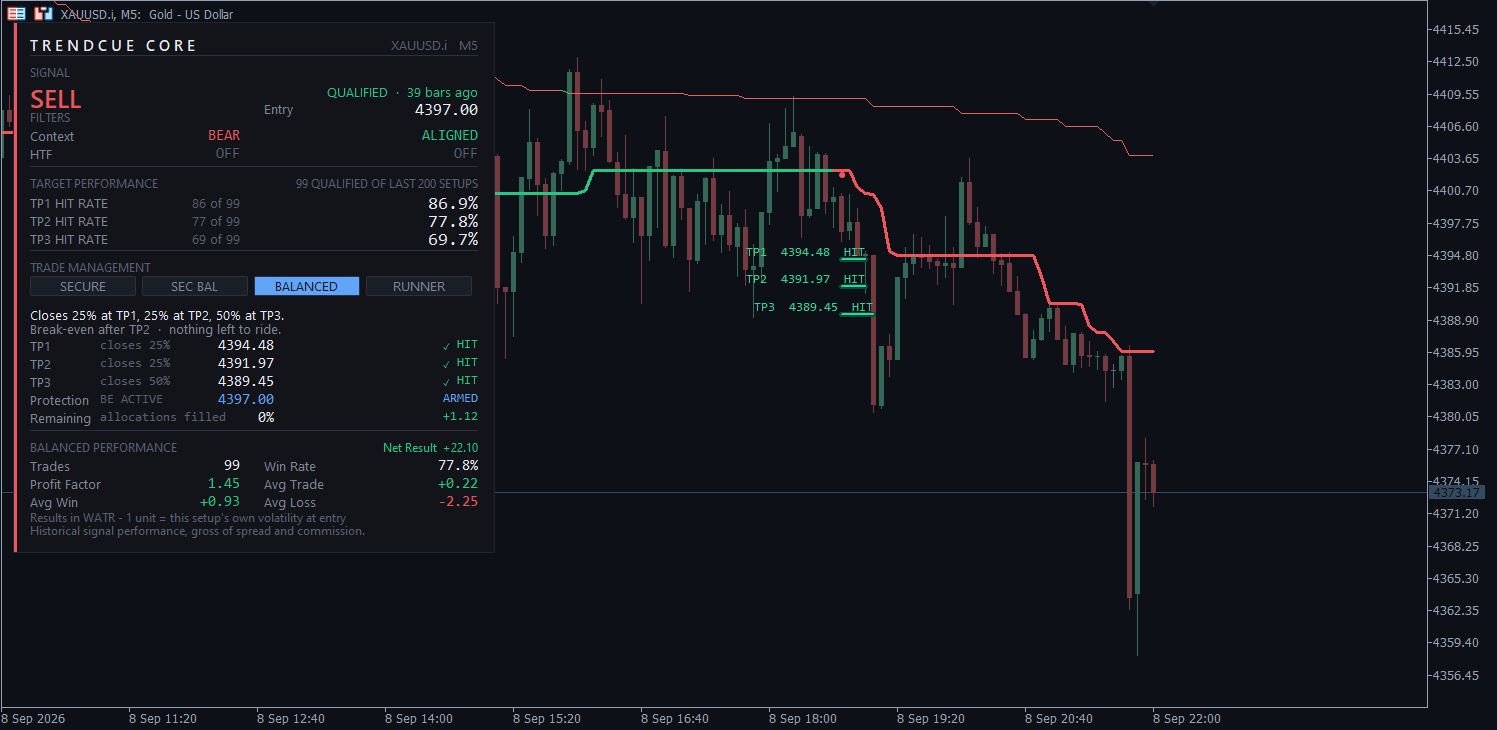
XAUUSD M5
Qualified setups: 99
TP1 hit rate: 86.9%
TP2 hit rate: 77.8%
TP3 hit rate: 69.7%
BALANCED Win Rate: 77.8%
Profit Factor: 1.45
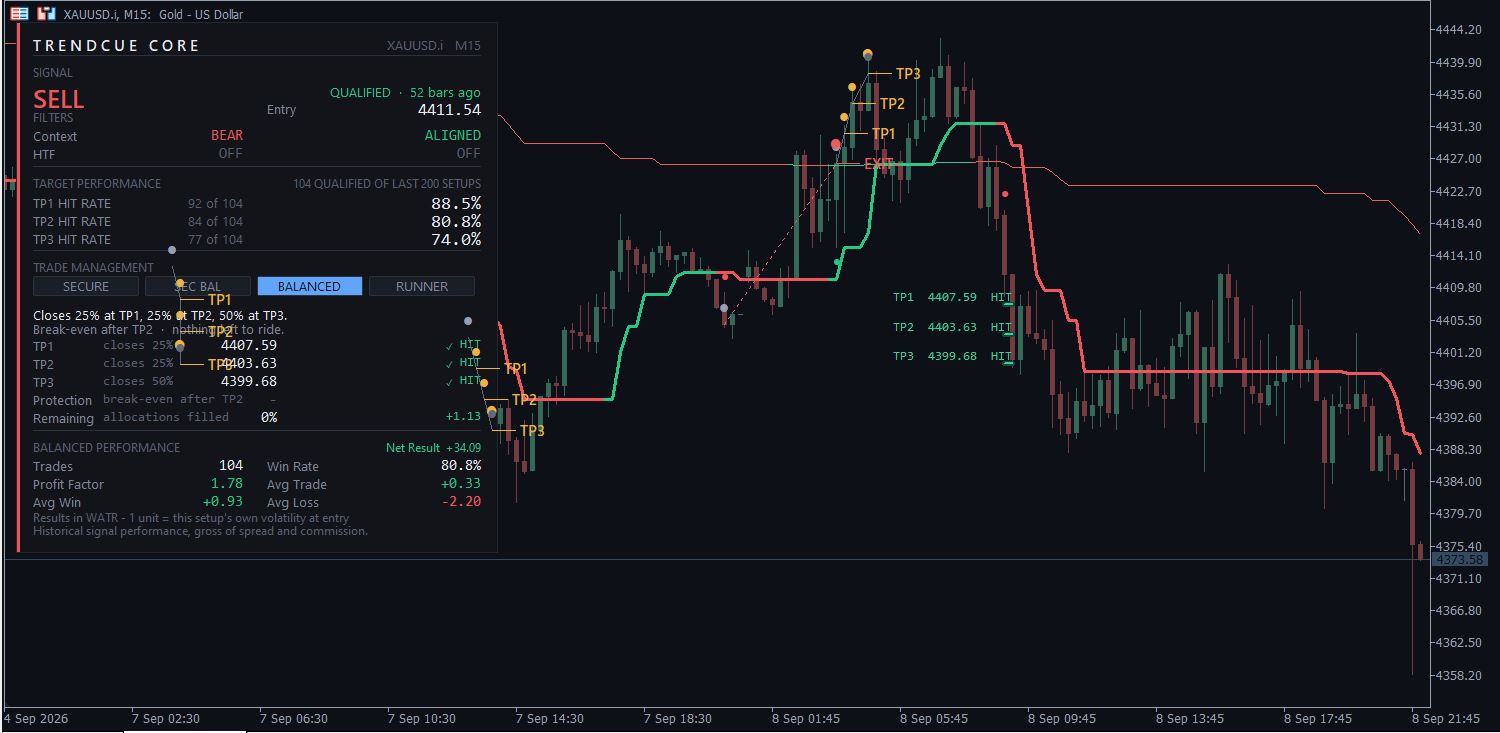
XAUUSD M15
Qualified setups: 104
TP1 hit rate: 88.5%
TP2 hit rate: 80.8%
TP3 hit rate: 74.0%
BALANCED Win Rate: 80.8%
Profit Factor: 1.78
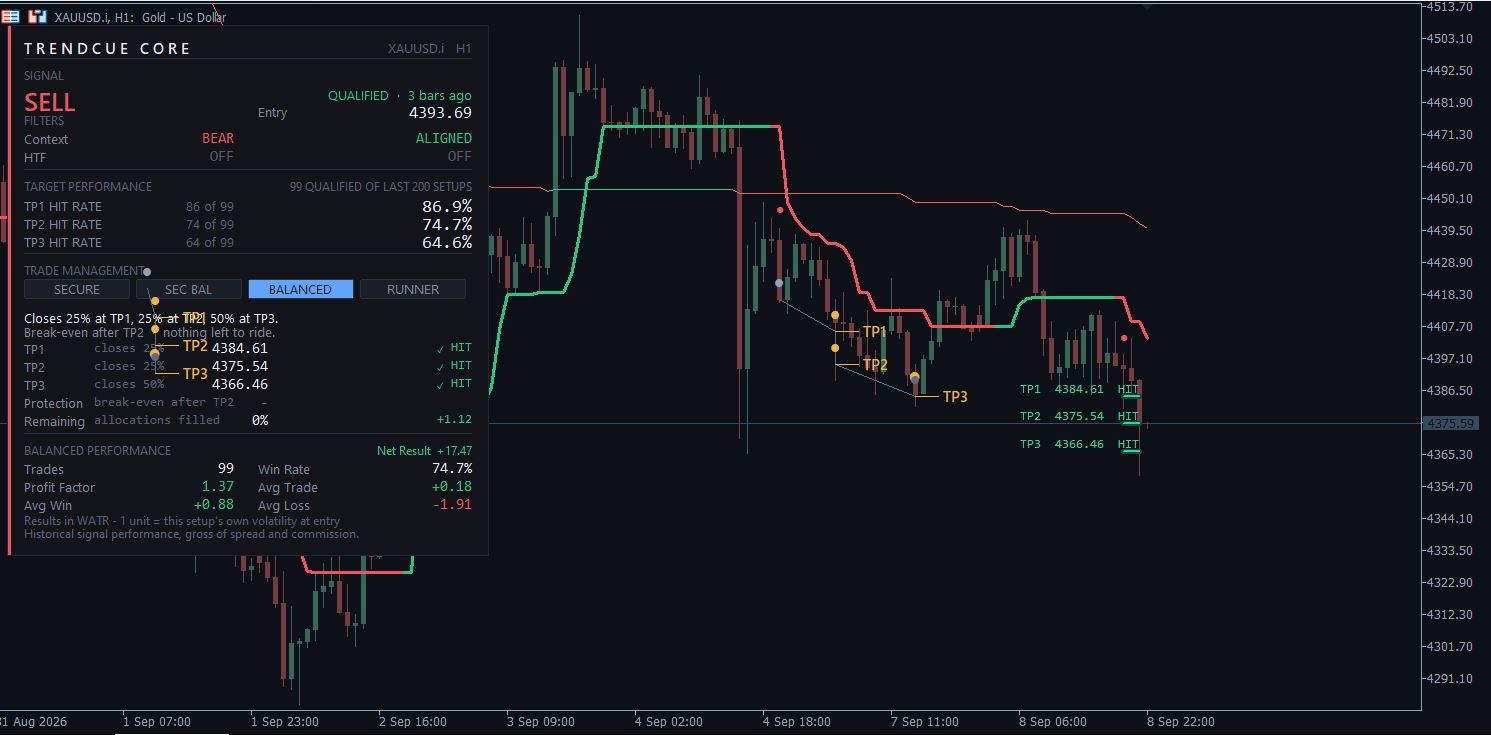
XAUUSD H1
Qualified setups: 99
TP1 hit rate: 86.9%
TP2 hit rate: 74.7%
TP3 hit rate: 64.6%
BALANCED Win Rate: 74.7%
Profit Factor: 1.37
Each panel identifies its qualified sample within the last 200 setups.
These are rolling historical samples, which can cover different calendar periods. The comparison is useful for screening; it is not a controlled comparison proving that one timeframe is superior.
Within these snapshots, M15 leads on all three target hit rates and Profit Factor. That is the observation I would investigate next.
M5: a completed setup inside a mixed history
The M5 SELL has an Entry reference of 4397.00. Its TP1, TP2 and TP3 levels are all marked HIT.
The wider panel shows 86 of 99 qualified setups reaching TP1, while 69 of 99 reached TP3. The completed SELL is one example within that history.
For a trader, the useful distinction is how often an initial favourable move develops far enough to reach the later targets. A chart showing one complete target sequence cannot answer that by itself.
M15 and H1: the same target completion, different profiles
On M15, the displayed SELL has an Entry reference of 4411.54 and reaches all three targets. Its historical sample contains 104 qualified setups, with a TP3 hit rate of 74.0%.
On H1, the displayed SELL also reaches all three targets, from an Entry reference of 4393.69. But its wider sample shows a TP3 hit rate of 64.6% and Profit Factor of 1.37.
M5 and H1 share the same displayed TP1 hit rate, 86.9%, while their later-target rates differ. Looking only at TP1 would miss that distinction.
These are separate setups generated on separate timeframes. Each has its own entry, targets and price path.
Target hits and management results answer different questions.
TP1 / TP2 / TP3 hit rates show how often qualified setups reached each target. Win Rate and Profit Factor show how the selected management model handled that same history.
For these screenshots I kept the settings and BALANCED management consistent, then compared the profiles across timeframes.
The current M15 panel stands out with the strongest displayed Profit Factor, but I would still review the failed and incomplete setups before choosing it.
That is how I prefer to use Core: not to declare one timeframe universally best, but to compare the current historical profile and decide which chart deserves more attention.
Previous Core walkthrough:
https://www.mql5.com/en/blogs/post/775476
TrendCue Core:
https://www.mql5.com/en/market/product/194629