TrendCue Core on Gold Today: Signal, Targets and Exit Management
7 September 2026, 16:46

0
105
A SELL signal appears on Gold. Price moves in your direction.
Do you take profit at the first target, close in parts, or leave something open for a longer move?
I’ll use one XAUUSD M15 chart to explain how TrendCue Core approaches this.
Core confirms signals after the candle closes. The enabled filters then decide whether the setup qualifies. An accepted setup gets an Entry reference and three fixed targets: TP1, TP2 and TP3.
From there, the setup can finish through its target plan, or an opposite signal can close whatever remains.
Past setups stay visible on the chart, and the panel lets you compare different exit-management approaches on the same historical signals.
Let’s follow the chart first.
Look at the historical SELL setup on the right side below. After entry, Gold moved down through TP1, TP2 and TP3 before recovering.
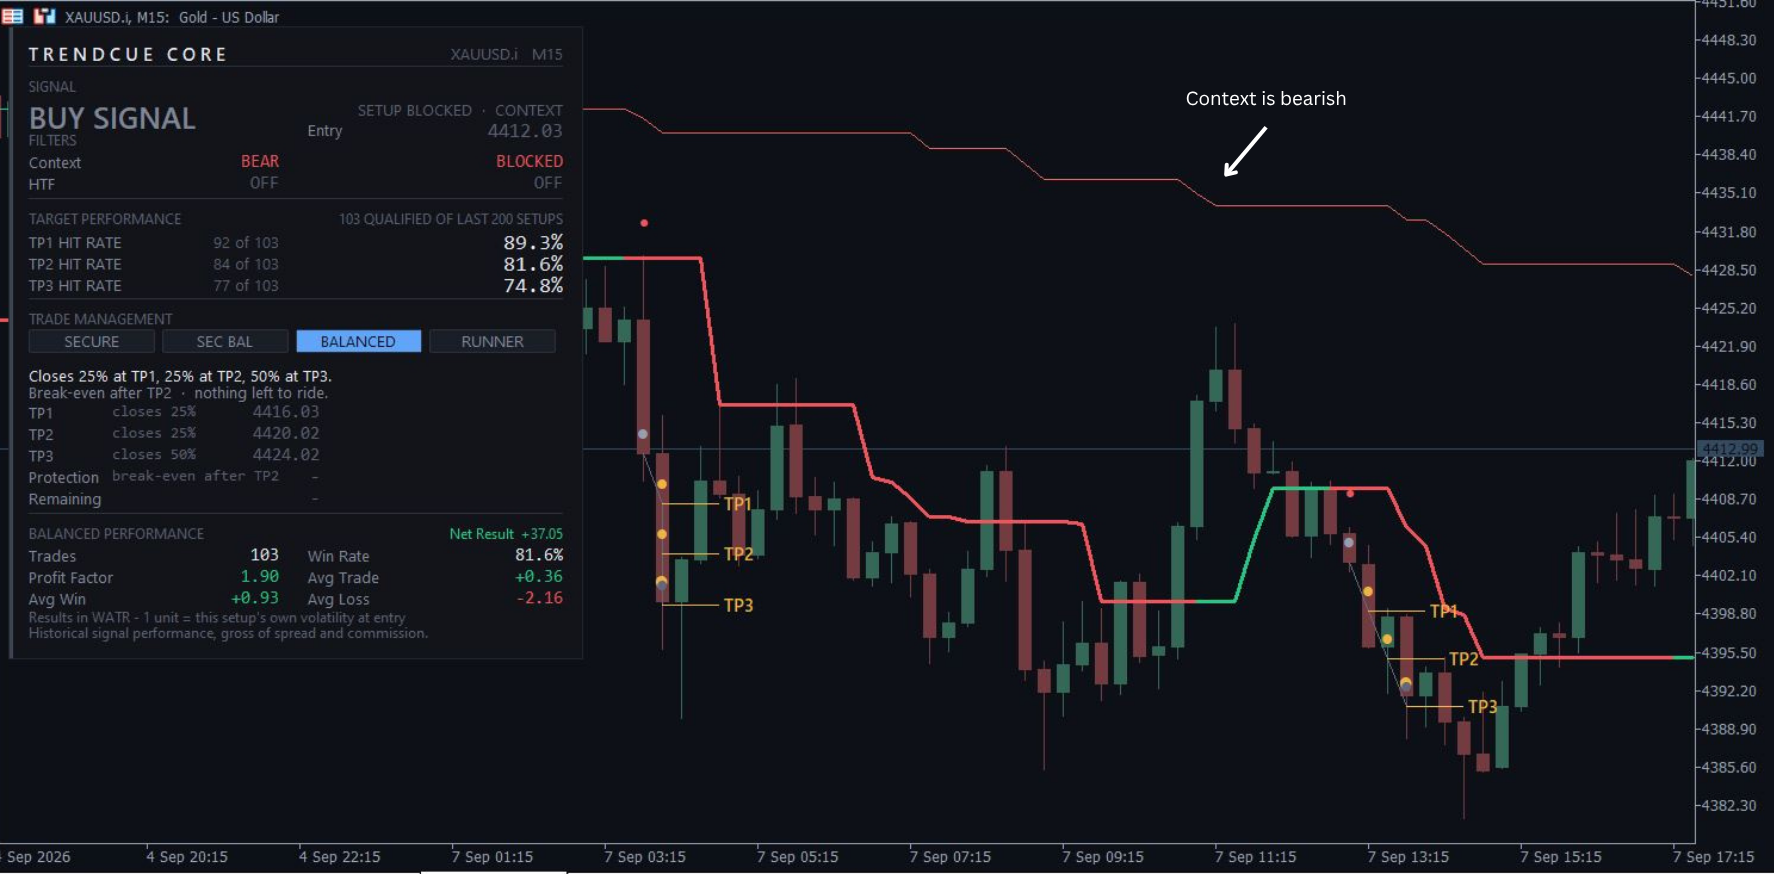
XAUUSD M15: follow the right-hand SELL setup through its three targets. The panel also shows why the latest BUY signal is blocked.
The BUY signal shown in the panel is a separate, later event.
Context is bearish, so the panel shows:
SETUP BLOCKED · CONTEXT
The higher-timeframe filter is off.
That BUY signal does not create a new qualified target ladder. A confirmed signal still needs the enabled filters to agree.
There is another useful distinction here: an opposite signal can end the previous setup even when the filters block it as a new entry. Any remaining modelled position exits at that signal candle’s close.
So the workflow is simple:
Signal → Qualification → Entry → TP1 / TP2 / TP3 → Target exit or opposite-signal exit.
The historical chart keeps both completed target sequences and setups that ended earlier. I can scroll back and inspect what happened after each entry.
The panel then puts those individual examples into a wider sample.
Here, it shows 103 qualified setups out of the last 200 completed setups.
The TP1, TP2 and TP3 hit rates show how often those qualified setups reached each target before the opposite signal.
Changing the management mode does not change those signals, targets or historical price paths.
What changes is how the exit plan handles them.
SAME SIGNALS, DIFFERENT EXIT PLANS
In the first screenshot, BALANCED models closing 25% of the original position at TP1, another 25% at TP2, and the final 50% at TP3.
Break-even protection is armed after TP2.
The SELL setup we followed reached all three targets. Other setups in the sample retraced before completing the full sequence.
That is where different management styles start to matter.
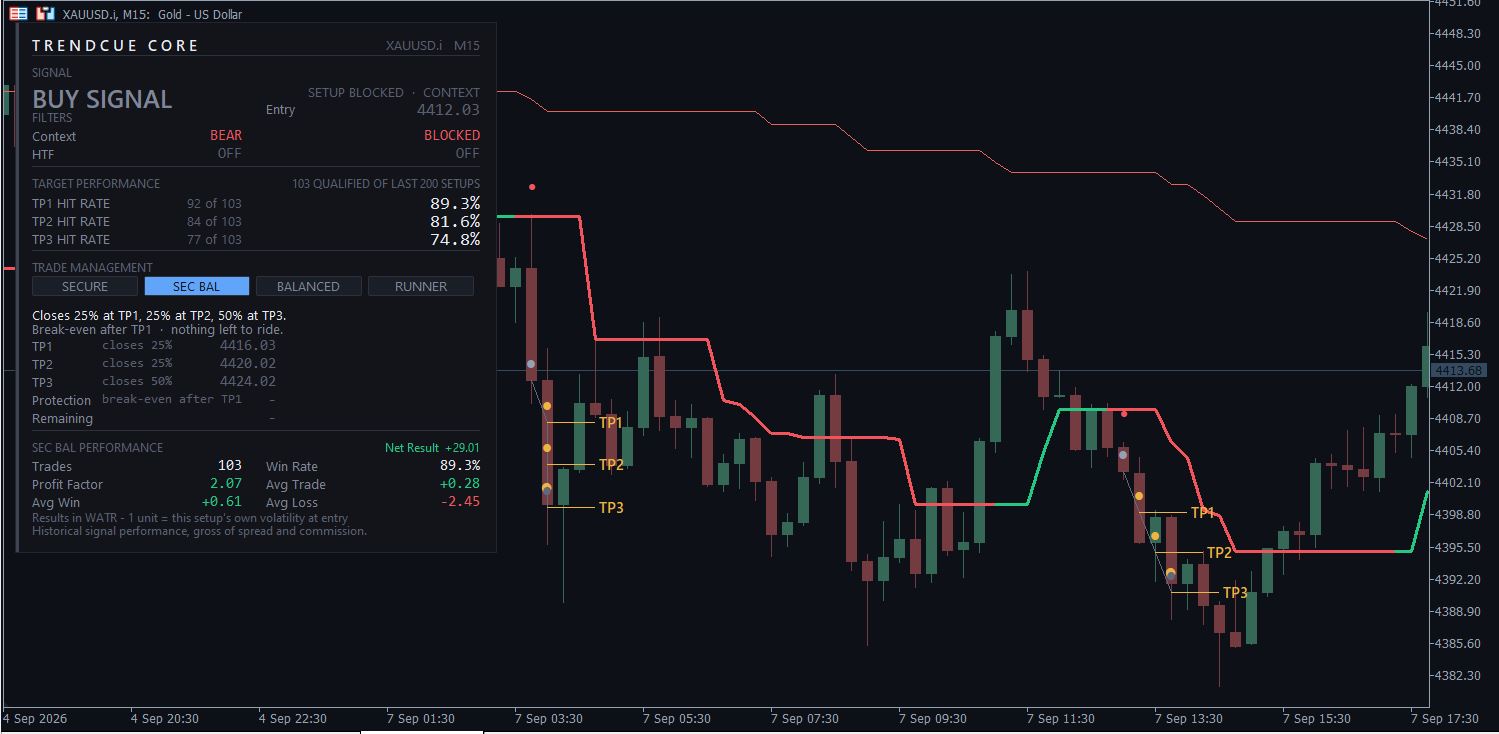
SEC BAL uses the same partial exits as BALANCED, but protects the remaining position earlier.
SEC BAL still closes:
25% at TP1
25% at TP2
50% at TP3
But break-even protection is armed after TP1 instead of TP2.
If price reaches TP1 and later returns to entry, the model can keep the first partial profit while the remaining position closes at break-even.
In this sample, SEC BAL shows:
Win Rate: 89.3%
Profit Factor: 2.07
Now compare that with RUNNER.
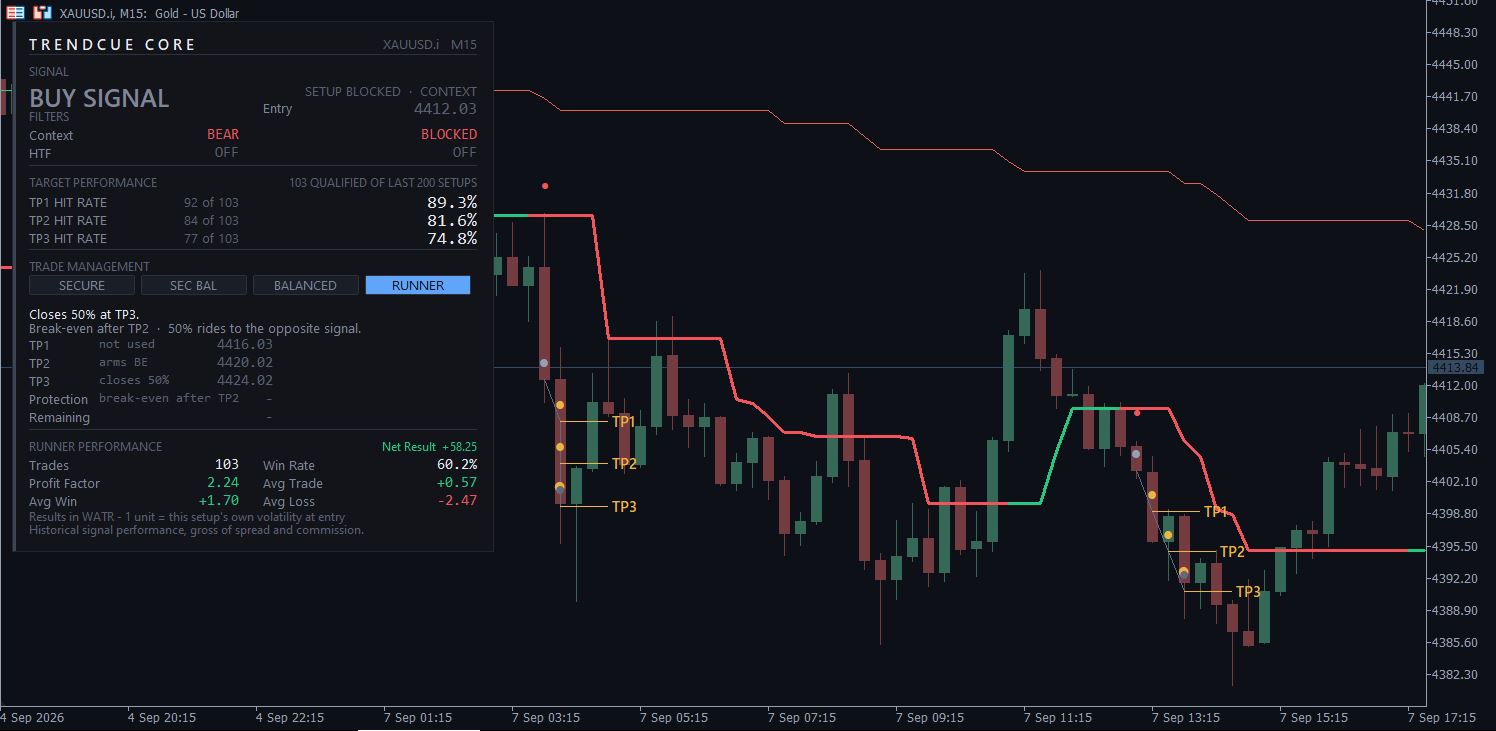
RUNNER does not take partial profit at TP1 or TP2.
It arms break-even protection after TP2, closes 50% at TP3, and leaves the remaining half open until an opposite signal or break-even exit.
In the same historical sample, RUNNER shows:
Win Rate: 60.2%
Profit Factor: 2.24
Fewer winning outcomes, but a higher Profit Factor in this sample.
That is the part I find useful.
The signals did not change.
The targets did not change.
The historical price path did not change.
Only the way the position was managed changed.
SEC BAL’s earlier protection can preserve more positive outcomes.
RUNNER gives larger trends more room to contribute, but it can also give back more of a move.
Win Rate tells me how often the model finished positive.
Profit Factor compares total modelled gains with total modelled losses.
A higher win rate alone does not make one management style automatically better.
HOW I WOULD USE THE PANEL
I would start with XAUUSD or a highly liquid major FX pair and compare different timeframes while keeping the signal and filter settings consistent.
Historical Profit Factor above 1 is a useful first screening guideline, not a reason to trade by itself.
Then I would look behind the numbers.
I want to see the successful setups, the failed setups, which targets were actually reached, and how the different exit plans handled those same moves.
That is really the idea behind TrendCue Core:
See the signal.
See the targets.
See how previous setups ended.
Then choose how you want to manage the trade.
These are historical, modelled signal results before spread and commission, without an initial stop-loss model. They do not predict future performance.
TrendCue Core supports analysis and decision-making. It does not execute trades. Execution, stop loss, position sizing and account risk remain the trader’s responsibility.
TrendCue Core is now available on MQL5 Market: