Entry Points Pro MT5 User Manual: how to trade non-repainting entry signals

This is the official user manual for Entry Points Pro for MT5. Product page and free demo: https://www.mql5.com/en/market/product/62358
Manual in your language - all 9 languages (PDF) are in the attached ZIP at the bottom of this page: English, Russian, Deutsch, Español, Français, Italiano, Japanese, Português, Chinese. The full English manual is below.
Entry Points Pro 10 — User Manual (the “Trader’s Bible”)My name is Yury, and I am the author of the Entry Points Pro indicator. Let me thank you from the bottom of my heart for the trust you have placed in me, and congratulate you on making the right move. You are now holding an excellent working tool, and this manual will teach you to use it properly and reveal some important secrets of market trading. The indicator will become a reliable assistant in your everyday trading — a complement to your trading strategy, or the foundation of it.
Let me warn you right away: Entry Points Pro is not a Holy Grail and not a magic button for easy money. To get the most out of it, you need to understand how it works and how to use it. Trust me and my experience — I will help you find the shortest path to profitable trading. But let’s begin with a little shock therapy. I am honest with you, so I will tell you what nobody else will:
- The Holy Grail does not exist. A “Grail” is what people call a magic method that always makes money. I have been trading since 1999, and I know a thing or two about this. I sincerely hope you are willing and able to hear me.
- All indicators follow price. No exceptions. An indicator that predicts the future does not exist. If someone claims otherwise, they are lying.
- Trading is a profession, not a chase after arrows. Read this manual from cover to cover — traders did not nickname it the “Trader’s Bible” for nothing. Every section here matters.
This manual is protected by copyright. Copying or distributing it, in whole or in part, without the author’s consent is unlawful and will be prosecuted.
1. Installation
Trading account and terminal
Version 10 of the indicator runs on the MetaTrader 5 trading platform (the MT4 edition is the previous generation, v8, and the two are not interchangeable). If you already have an MT5 account and terminal, skip straight to installing the indicator. If not: choose a broker, register an account, download and install MetaTrader 5, and connect to your account. Any broker with MT5 will do — only the terminal matters.
Installing the indicator
- Buy the indicator on the MQL5 Market and install it into your terminal (the “Install” button on the purchase page — the indicator will appear in the terminal’s Navigator window under the Market section).
- Open a chart of the instrument you need and drag the indicator from the Navigator (Ctrl+N) onto the chart.
- If everything is done correctly, you will immediately see the info panel in the language of your terminal (7 languages: English, Russian, Spanish, German, French, Italian, Portuguese — switched automatically) and signals on the chart.
- Save a template with the indicator under the name default — every new chart will then open with the indicator already on it.
IMPORTANT: on the first run on a new instrument, switch the timeframe back and forth once so the terminal downloads the price history — the panel will then fill with data.
2. Quick start — how to trade in 3 steps
- Wait for an arrow at candle close (the amber marker will warn you in advance: “a signal is forming”). The indicator will draw the entry level with its price.
- Enter on the breakout of the level. I recommend placing a pending stop order right at the level — the entry will execute by itself the moment the breakout happens, no chart-watching required. The stop-loss goes beyond the level shown by the orange line; the lot is already calculated in the panel from your risk.
- Hold until the opposite signal — or manage the trade with your own stop. Both scenarios are calculated in the panel (Exit on signal / Exit on stop) — pick the style that suits you.
The rest of this manual explains every element in detail. Don’t skip it — it holds the answers to all your questions.
3. How a signal is born (the core of the method — a must-read)
Remember the main thing: an arrow is not yet an entry. The entry happens only on the breakout.
- Amber marker (early warning). Signal conditions are forming on the current, still-open candle. The indicator places an amber “Buy/Sell — wait for close” mark and fires an early alert. This is a heads-up so you have time to assess the situation and calculate your risk. If the conditions are not confirmed by the candle close, the marker is removed. That is not repainting: the warning was never a signal in the first place.
- Arrow (confirmed signal). The candle has closed and the conditions are confirmed — a coloured arrow appears on the chart (green Buy / red Sell) along with a confirming alert. This arrow will never disappear or move — verified by an automated test: millions of checks, zero violations.
- Entry level. Together with the arrow, the indicator draws a line at the extreme of the signal candle (the high for Buy, the low for Sell) with a price label. That is your entry point: place a stop order at the level, or enter at market when it breaks.
- Breakout = entry. The next candle breaks the level — the entry has happened. The panel will show the “in trade” status.
- No breakout = cancellation. If the next candle does NOT break the level, there was no entry: the arrow turns gray and the CANCELLED counter in the panel goes up. You have not lost a single point: the market did not confirm the move, and the filter weeded out a weak signal. This is also my answer to the “repainting critics”: the signal did not vanish — it is honestly marked as cancelled, and you can see why.
- Opposite signal = exit. The system works on the principle “hold until the trend reverses”. When a counter-arrow appears, that is the standard point to close the current trade (and, if you wish, to reverse).
A signal is also cancelled if the signal candle is abnormally large for the current instrument and timeframe. Entering after such a candle would be a late entry with a huge stop, so the system skips those. This is a safety feature: in version 10 the filter adapts to the volatility of any instrument by itself — gold, bitcoin and indices work out of the box, nothing to configure.
Remember: Entry Points Pro is an indicator, not an expert advisor. It does not open or close trades: the trader makes and executes the decisions, and the one who acts is always the one responsible for the result. The indicator gives you the points — the trading is yours.
4. The indicator panel
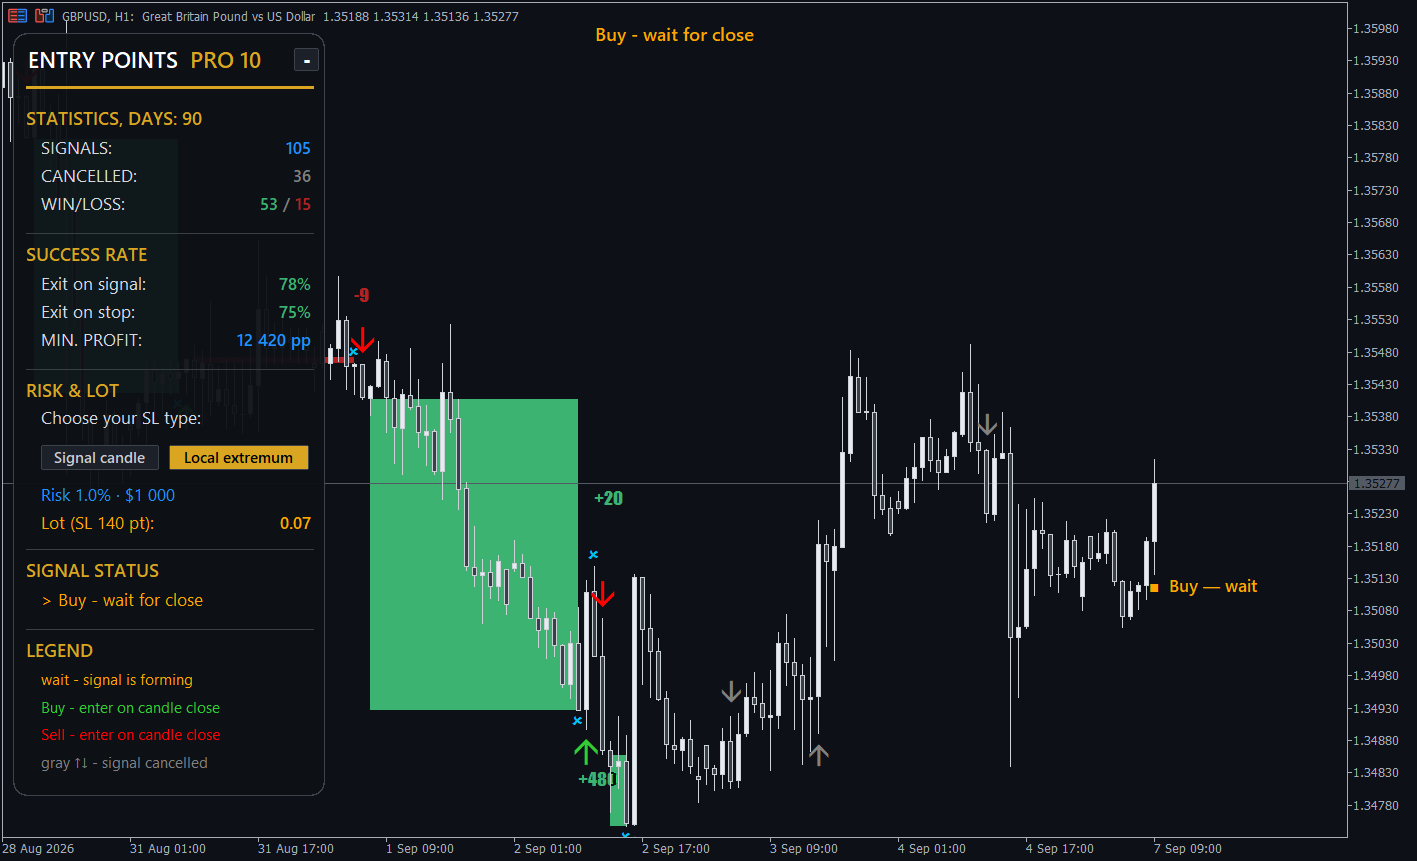
You can drag the panel with the mouse to any spot on the chart and collapse it into a logo strip with the “–” button. The sections, from top to bottom:
STATISTICS, DAYS: 90
- Signals — how many confirmed signals the indicator produced over the statistics period (90 days by default, adjustable).
- Cancelled — how many signals were cancelled (no breakout). Cancelled signals are NOT counted in WIN/LOSS or the success percentages.
- WIN/LOSS — the ratio of profitable to losing signals when exiting on the reversal.
SUCCESS RATE
The entry is the same for everyone — the trade management is everyone’s own. That is why the panel evaluates the very same stream of signals under three exit scenarios: the ideal one (exit on signal) and two real ones (exit on the stop of your chosen type).
- Exit on signal — the success rate with ideal management: holding every trade until the opposite signal. The upper bound of the method; this is exactly how the coloured rectangles on the chart are marked.
- Exit on stop — the success rate of the very same trades, but with the stop-loss of the selected mode: if the stop is hit, the trade counts as a loss. The honest number for those who trade with stops.
- MIN. PROFIT — the total net result of all completed signals in points (profit minus losses) when exiting on signal. Why “minimum”? I will explain below.
RISK & LOT
- Choose your SL type — two stop-selection buttons: Signal candle (beyond the extreme of the signal candle) and Local extremum (beyond the nearest swing of the recent bars). The difference is simple: the candle stop is short — the loss on each mistake is minimal, but it gets knocked out more often; the extremum stop is wider — it breathes with the market and triggers less often, but each triggered stop costs more. The lot calculator equalises the money risk for both modes. Which one performs better on your instrument? Don’t guess: a click on the button instantly recalculates Exit on stop, the stop size and the lot. Your choice is remembered per symbol.
- Risk / Lot — a ready-made lot for the next trade: risk percentage × deposit ÷ stop size. For example: “Risk 1.0% · $1 000 → Lot (SL 27 pt): 0.37”.
SIGNAL STATUS
A live line showing what is happening right now:
- Waiting for a signal… — no conditions, we do nothing;
- Buy/Sell — wait for close (amber) — a signal is forming;
- Buy/Sell — entry at price — the signal is confirmed, waiting for the level breakout;
- Buy/Sell — in trade — the breakout happened, the trade is on;
- Market closed — the trading session is not active.
Rule: trade by the panel status. The arrows on the chart are the markup of history; the status is your “now”.
LEGEND
A quick reference of the notation (amber/green/red/gray). Once you know it by heart, switch it off with the Show legend setting — the panel gets shorter.
5. Stops and trade management
For the initial stop, I always recommend placing it beyond the signal candle (the Signal candle mode) — that way the potential loss is minimal and known in advance.
My main principle for working with the indicator: once I am in a trade, the moment price gives me the chance to protect it, I move the stop to breakeven. From that point on I risk nothing, while the trade can bring any amount — that is how you maximise your earning opportunities. I do this almost always, and I advise you to do the same.
The indicator’s exits are indicative: its main job is perfect entry points. Quite often it pays to close a trade later than the markup shows and earn more — that is why the statistic is called “minimum profit”: it is the result of the most conservative scenario. Managing and closing trades is up to the trader and their trading system. Cross-check the signal against a higher timeframe: confirmation from above = more strength and more potential.
Why the profit is precisely “minimum” — one screenshot insteadof a thousand words:
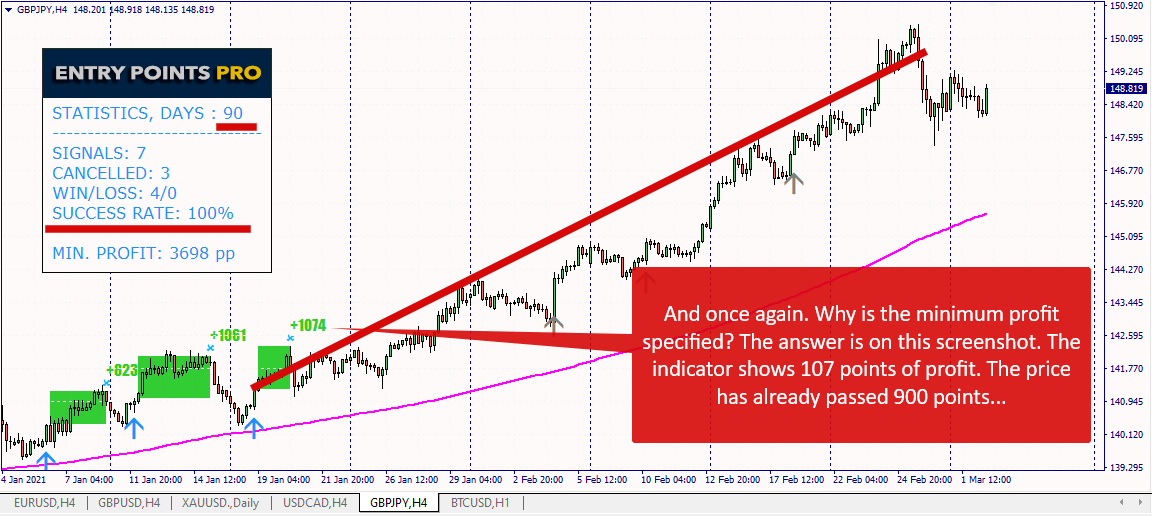
GBPJPY H4: the indicator’s markup recorded +107 points on the trade — exactly that amount went into the MIN. PROFIT statistic. Price then travelled more than 900 points further along the trend. The trader who managed the trade — moved the stop to breakeven and rode the position with the trend — took several times more than the “minimum”. Remember: MIN. PROFIT is the floor, not the ceiling. That is what the most conservative signal-following would have made; everything above it is your trade-management skill.
6. Statistics: how to read them and why you can trust them
How to choose your working timeframe
Walk through the timeframes right on your instrument — M5, M15, M30, H1, H4 — and compare the panel. Your working timeframe is the one that combines a high win probability with a sufficient number of signals. The panel recalculates on every switch — the entire “backtest” takes a minute, no strategy tester needed.
A practical note: computing statistics over a long period is a serious amount of number-crunching. The fewer days you set in the Statistics, days setting, the faster the indicator recalculates when you switch timeframes. The default of 90 days is a sensible balance between speed and reliability.
And remember: the past does not guarantee the future, but it gives us an excellent reference point — all the more so because Entry Points Pro relies on the market’s fundamental characteristics. The market itself would sooner disappear than they stop working.
- The statistics are computed on your chart: symbol, timeframe, period (Days). A different instrument or TF means different numbers. That is not a bug, it is a feature: you see the real statistics exactly where you intend to trade, not showcase screenshots.
- The coloured rectangles on the chart are not signals but a visual markup of each completed signal’s result (from the entry to the opposite signal, with the outcome in points). They appear after the fact, once the trade is finished — by design. The trading arrows are never repainted.
- MIN. PROFIT — the sum of all results in points, net (losses deducted). Spread and slippage are not included — it is a gauge of the system’s potential, a tool for comparing instruments and timeframes with each other.
- Do not set too long a Days period on minute charts: statistics over tens of thousands of signals can slow the terminal down.
7. Alerts
The indicator notifies you twice: an early alert (a signal is forming, the candle has not closed yet) and a confirming one (the candle has closed, the arrow is on the chart). Duplicates are filtered out automatically. Available channels: a pop-up window in the terminal (Alert popup), a push notification to your phone (set up your MetaQuotes ID in the terminal: Tools → Options → Notifications), and sound (your own file — the Sound file parameter).
8. Settings (all parameters of version 10)
SIGNALS
- Max signal candle size, points (0 = auto) — the filter for abnormally large signal candles. The default 0 = auto mode: the indicator adapts to the volatility of any instrument by itself (gold, crypto, indices — out of the box). Want manual control? Set the size in points, as in previous versions.
- Early warning on the forming candle — the amber marker and the early alert on the forming candle (true/false).
PANEL & STATISTICS
- Show statistics panel — show/hide the entire panel.
- Statistics period, days — the statistics period in days (default 90).
- Show legend — the LEGEND block in the panel.
- Show live guidance — the entry level on the chart + the live status.
- Warn on abnormal spread / threshold — a warning when the spread is above normal (the threshold is how many times above usual). Protection against entering at moments when the broker has widened the spread.
- Win/Loss/Panel text color — colours to suit your taste and chart theme.
RISK & LOT
- Risk per trade, % — your risk per trade (default 1%).
- Deposit (0 = real balance) — the deposit used for the lot calculation; 0 = take the real account balance.
- Local extremum lookback, bars — how far back to search for the local extremum in the stop mode of the same name (default 6 bars).
ALERTS
- Alert popup / Push notification / Sound / Sound file — the notification channels.
ADVANCED
- Intraday signals from / until — the indicator’s working hours. They apply only on timeframes M15 and below (on M30 and above, signals run around the clock). The default is 09:00–19:00 — the active European–American session. Want signals around the clock on minute charts too? Set 00:00 and 23:59.
- Trend filter / Draw trend filter line / Trend filter period — the built-in trend filter. When enabled, the indicator ignores counter-trend signals: price above the filter line — buys only, below it — sells only. A conservative mode for those who do not trade against the trend.
9. FAQ — answers to common questions
1. There is a Buy/Sell arrow on the chart, but the panel says “Waiting for a signal…”. Why?
The arrow on the chart is a historical signal — it has already played out or is playing out. The panel shows the state right now. Trade by the panel status; the arrows are the markup of history.
2. How do I enter on a signal correctly?
The entry is not at the arrow but on the breakout of the signal candle’s extreme (the high for Buy, the low for Sell). The indicator draws the level as a line with the price. The author’s recommendation: a pending stop order at the level — the entry executes by itself the moment the breakout happens; you can also enter at market if you are watching the chart.
3. What do the gray arrows mean?
Signals that never became trades — for one of two reasons. First: the next candle did not break the entry level — the market did not confirm the move (these are counted by the CANCELLED counter in the panel). Second: the signal candle was abnormally large — entering would have meant a huge stop, and the auto-filter rejected the signal even before the breakout check (see section 3). In both cases no trade was opened — that is not a loss. Gray signals are not counted in WIN/LOSS.
4. The coloured rectangles appear in hindsight. Is that repainting?
No. The rectangles are visual statistics of completed signals, and they are supposed to appear after the fact. The trading arrows are never repainted.
5. Does the indicator repaint its signals?
No. A confirmed arrow is placed at candle close and never moves (auto-test: millions of checks, zero violations). The amber marker is an early warning, not a signal: it can be removed if the conditions are not confirmed by the close.
6. What is the difference between Exit on signal and Exit on stop?
One stream of signals, two management scenarios: hold until the opposite signal (that is how the rectangles are marked) or manage with a stop (stop hit = loss). Both numbers are computed on the real history of your chart.
7. The Signal candle and Local extremum buttons — what do they change?
The way the stop is placed: beyond the signal candle (short) or beyond the local extremum (wider, knocked out less often). A click instantly recalculates Exit on stop, the stop and the lot. The choice is remembered per symbol.
8. Where does the lot in the panel come from?
Risk % × deposit ÷ stop size. Risk and deposit are in the settings (deposit 0 = real balance); the stop follows the selected mode. It recalculates live.
9. What is MIN. PROFIT?
The total net result, in points, of all signals completed over the statistics period, when exiting on signal. A gauge of potential: spread and slippage are not included.
10. Why do my percentages differ from other people’s screenshots?
The statistics are honestly computed on your symbol, timeframe and period. A different instrument means different numbers. You see the real statistics exactly where you intend to trade.
11. The panel is too tall. What can I hide?
The “–” button collapses the panel into a logo strip. Show legend = false removes the reference block and makes the panel shorter. The status, the statistics and the lot remain.
12. I am in a trade, but the panel already says “Waiting for a signal…”. Did I miss something?
If the status changed without a counter-arrow, then either price reached the stop of the selected mode, or the trend line reversed (an exit condition). Check whether it is time for you to exit as well.
13. I have a sell open, and a buy signal has appeared. What do I do?!
Close the sell. The opposite signal is exactly the standard exit: the system holds a trade until the trend reverses, and a new signal means a reversal. What comes next is up to you: reverse into a buy on the breakout of the new level — or skip it.
14. There are no signals on minute charts at night. Is it broken?
No. On timeframes M15 and below the working hours apply (09:00–19:00 by default) — the overnight flat on minute charts eats deposits. Want it around the clock? Set 00:00 and 23:59 in the settings.
15. What language does the panel speak, and how do I change it?
The panel speaks 7 languages: English, Russian, Spanish, German, French, Italian, Portuguese. The language is picked automatically from the terminal language — there is no separate setting. To change the terminal language: menu View → Languages, then restart the terminal. The trading terms Buy / Sell / WIN / LOSS stay English in every language — it is the international language of trading, and these are exactly the words you see in the signals and alerts.
10. Rules and recommendations (distilled from practice since 1999)
Read them carefully and follow them. I can guarantee: every time you break them, the market will punish you.
- Follow the system’s rules firmly, but keep the flexibility to change the parameters when the market and the instrument’s behaviour change.
- Remember that tilt exists, and learn to recognise its onset in time.
- Try not to trade against the trend. Turn on the trend filter: price below the line — sells only, above it — buys only.
- Do not try to catch price reversals — only professionals can do that.
- Study price behaviour and pay attention to levels (see the bonus section).
- Weigh the strength of the seller and the buyer; do not make spontaneous entries hoping for luck.
- Be disciplined. Strict discipline = steady income growth, proven.
- Control your emotions and your greed. It is just one of many trades: no single trade should fundamentally change the result of your day — neither for the better nor for the worse.
- Keep a trading journal — it will help you see your mistakes soberly and stop repeating them.
- Do not flit between strategies (“system promiscuity”). The Grail is inside you, and Entry Points Pro is your best tool.
- Your biggest losing trade must never exceed your biggest winning one.
- Cut your losses. Price goes against you — get out, do not let the minus grow.
- Forget prayers and hopes: the market does not care what you are waiting for.
- Do not trade on the news, but know when it comes out — the market maker will do everything to shake you out. Be especially careful around Nonfarm Payrolls (the first Friday of the month): the move can be very strong.
- Learn to wait. Entries out of boredom are a straight road to a blown account.
- Learn to accept losses calmly. Everyone has losing trades; the goal is for the wins to outnumber them.
- Price has frozen for a long while — think about closing: a redistribution or an accumulation is under way; wait for clarity.
- Earn little by little. My first goal was 20 ticks a day on the S&P — $250. Over a year that is $60,000 even without reinvesting.
- Do not count on a single big win — build your empire brick by brick. Trading is work.
- Hone your mastery with identical trades: trading is a craft, like a carpenter’s or a potter’s.
- Do not overcomplicate the analysis and do not doubt endlessly: there is no profit until a trade is opened.
- Everyone is equal before the market — only your behaviour determines the result of the day.
- Follow my rules — and you will succeed!
11. Bonus: levels that work
Let me tell you about the important price levels worth paying attention to — they are the language the strong players use to communicate, and a professional reads the chart precisely through them.
In any market there are only two participants — the buyer and the seller. Price goes up because the buyer is winning: he buys out the entire volume at the current price and pushes it higher. Price goes down because the seller saturates the market and is forced to sell ever cheaper. The trader’s main question: who will win? We look for the answer at the levels — that is where you can see the intentions of the “smart money” (banks, funds, market makers), who always win.
- Levels work on any timeframe, but the higher the TF, the stronger the level and the less market noise.
- If on a minute chart price has come to a level from the weekly chart, that is an excellent reason to look for an entry point: a trade from such a level gives the most powerful profit.
- Selling near the upper level and buying near the lower one, you are always on the strong side — together with the smart money.
- Almost every return of price to a strong level is an opportunity to earn a lot at practically no risk.
The combination of a strong level + an Entry Points Pro signal is the most powerful combination in this system. Open your charts, mark up the levels where price has reversed, and trade the signals near them. Practical advice:
- Never use more than 5% of your capital in a trade.
- Analyse your actions and your mistakes.
- Do not trade tired and do not get carried away.
- Listen to analysts less; think for yourself more.
- Trade only the levels and ranges you understand.
And five more “secrets” of wealthy people that shortened my path: (1) there is no secret — some people act while others wait; (2) wealthy people do not work for a salary — they create assets and several sources of income; (3) only action produces results; (4) it is not hard — we invent the difficulty ourselves so we can stay in our comfort zone; write your destructive beliefs about money on a sheet of paper and burn it (just the sheet, not your neighbour’s house); (5) do not bury yourself in trading books — they will confuse you; use my experience, it is right in front of you. As Jack Ma said: poor people have one thing in common — their whole life is spent waiting. Act.
From the author
“I want to sincerely thank you for your trust and wish you good luck on the demanding path of becoming a trader! I am convinced that with enough effort anyone can become a professional in this field. I hope you are fully aware of the risks of exchange trading and understand that only a pragmatic approach and a careful study of the system’s rules will give you an undeniable edge. My system is universal and will keep working as long as markets exist: it relies on the basic laws of supply and demand. You are the operator of the system, and you alone are responsible for your decisions. Good luck and steady profits!”
Bonus: the market scanner
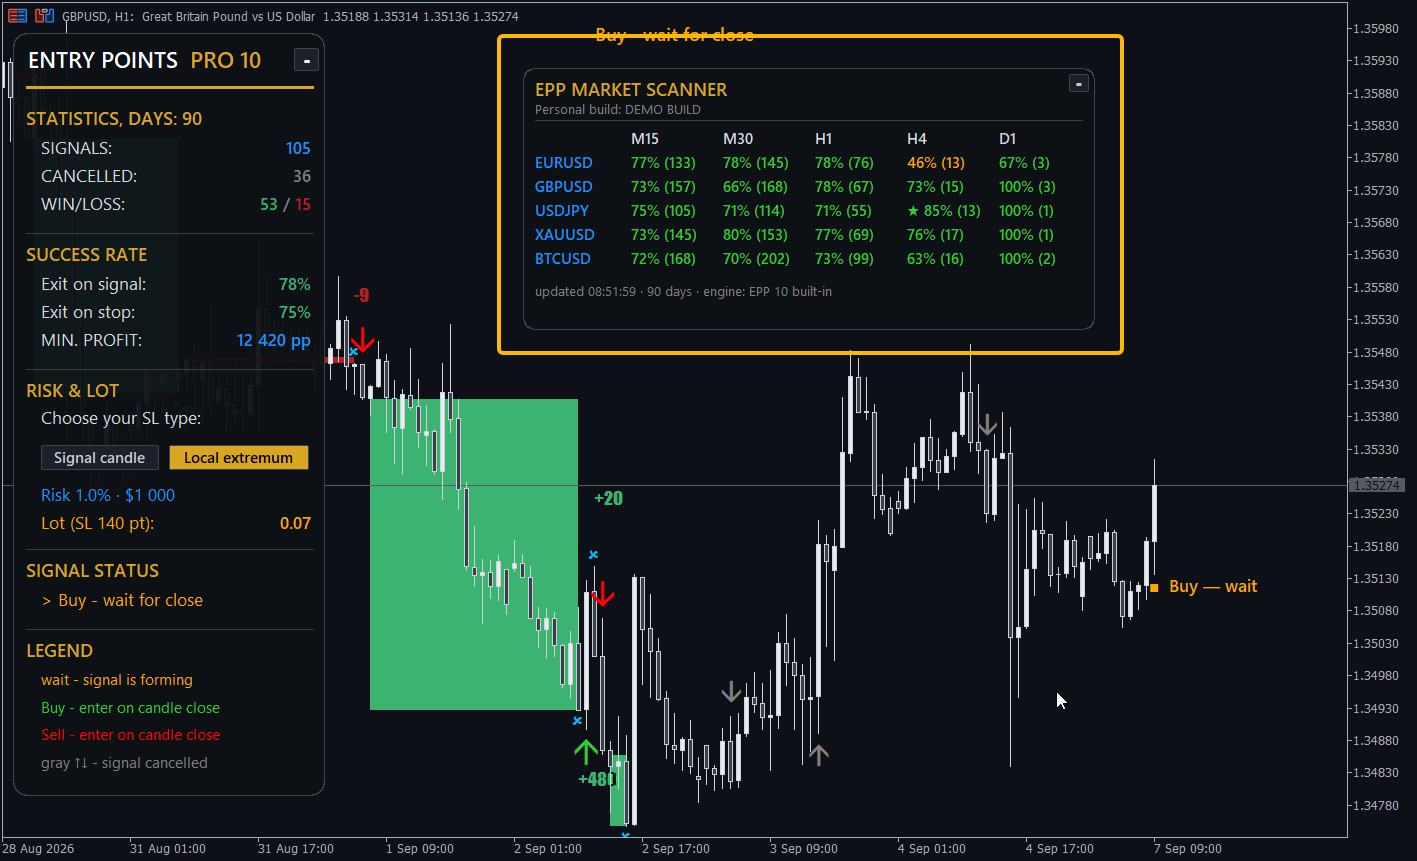
As a gift to my buyers I give away a market scanner: it analyses a whole array of assets and timeframes at once and shows on a single screen where Entry Points Pro is trading best right now. To receive it, message me privately after your purchase — I will tell you what details I need to build your personal copy, and I will send it to you with installation instructions.
And if you enjoy the indicator, an honest review on the product page is always deeply appreciated — reviews help the project enormously.
Send your questions to me in private messages — I answer everyone.
Best regards,
Yury Orlov
Questions about setup or signals? Write to me in private messages - I answer every trader personally. Entry Points Pro for MT5: https://www.mql5.com/en/market/product/62358