How to Trade Gold and Forex with SSS v5.0 MT5 Indicator — Complete Beginner's Guide

Understanding BUY, SELL, Reversal, Early Warning, Continue Signals, Entry, Stop Loss and Take Profit Levels
Trading Gold and Forex can provide many opportunities, but fast market movements can also make it difficult to identify potential entries, manage risk and decide when to stay in or exit a position.
For traders using MetaTrader 5, a structured visual trading system can help organize the analysis process.
SSS v5.0 — Scalping Smart Signals is a MetaTrader 5 indicator designed to provide visual trading signals and important trade-management levels for Gold (XAUUSD) and Forex currency pairs.
In this guide, we will look at the main signal types and explain how traders can use the indicator as part of a structured trading workflow.
Important: SSS v5.0 is a trading-analysis tool. It does not guarantee profits or eliminate trading risk. Traders should always perform their own analysis and use appropriate risk management.
1. What Is SSS v5.0?
SSS v5.0 is a MetaTrader 5 trading indicator developed by UZFX LABS.
The indicator provides a visual framework for identifying different types of potential market opportunities and displaying important trade-management information directly on the chart.
Depending on the setup, traders can see:
- BUY signals
- SELL signals
- Reversal signals
- Early Warning signals
- Continue signals
- Entry levels
- Stop Loss levels
- TP1
- TP2
- TP3
- Trailing Stop information
- Signal alerts
Instead of treating every market movement as a trading opportunity, traders can use these signals to create a more structured decision-making process.
READ BLOG:
2. Why Gold and Forex Trading Can Be Difficult
Gold and Forex markets can move rapidly, especially during active market sessions and periods of increased volatility.
A trader may correctly identify the general market direction but still face problems such as:
- Entering too late
- Entering during a temporary pullback
- Trading against the dominant move
- Missing continuation opportunities
- Entering before a potential reversal is confirmed
- Using inconsistent Stop Loss levels
- Taking profits without a predefined plan
- Increasing position size after a winning trade
- Making emotional decisions during fast market movements
A structured indicator can help organize some of these decisions.
However, the final trading decision should always remain with the trader.
3. Understanding the SSS v5.0 Signal System
One of the main concepts behind SSS v5.0 is that different signals can provide different information.
The trader can therefore look at the market from several perspectives instead of relying on a single BUY or SELL arrow.
BUY Signal
A BUY signal indicates a potential bullish trading opportunity according to the indicator's calculations.
When a BUY signal appears, a trader can evaluate:
- Current market direction
- Recent price structure
- Support and resistance
- Volatility
- Higher-timeframe conditions
- Entry level
- Stop Loss
- Potential Take Profit levels
- Risk-to-reward relationship
The signal should be considered part of the trading analysis rather than an automatic instruction to enter a position.
SELL Signal
A SELL signal indicates a potential bearish trading opportunity according to the indicator's calculations.
After a SELL signal appears, the trader can review the surrounding price action and determine whether the setup fits their trading plan.
Important factors can include:
- Market structure
- Recent highs and lows
- Current momentum
- Entry level
- Stop Loss level
- Take Profit levels
- Position size
- Overall market conditions
4. Early Warning Signals
Markets do not always change direction immediately.
Sometimes price begins showing signs of a possible change before a larger movement develops.
The Early Warning feature is intended to help traders monitor a developing market situation.
An Early Warning signal can be used as a reason to pay closer attention to the chart and prepare for a potential setup.
However, an early indication should not automatically be interpreted as confirmation of a reversal.
A disciplined approach is:
Early Warning → Monitor Market → Wait for Confirmation → Evaluate Trade Setup
This can help prevent premature entries.
5. Reversal Signals
A reversal occurs when the market begins changing its previous direction.
For example:
Bullish movement → potential reversal → bearish movement
or:
Bearish movement → potential reversal → bullish movement
SSS v5.0 includes Reversal signals to help traders identify potential changes in market direction.
When a reversal signal appears, traders can examine:
- Previous swing high/low
- Support or resistance
- Candle structure
- Market momentum
- Higher-timeframe direction
- Distance to Stop Loss
- Potential reward
The goal is to use the signal as part of a complete setup rather than trading every reversal signal automatically.
6. Continue Signals
Markets do not always reverse.
A trending market can experience a temporary pullback before continuing in the same direction.
This is where a Continue signal can become useful.
For example:
Uptrend → Pullback → Continue Signal → Potential BUY setup
or:
Downtrend → Pullback → Continue Signal → Potential SELL setup
The Continue signal gives traders another way to interpret market movement.
Rather than assuming that every pullback is a reversal, traders can evaluate whether the market may be attempting to continue its existing direction.
7. Entry, Stop Loss and Take Profit Levels
Another important part of SSS v5.0 is the ability to display trade-management levels.
The chart can show:
Entry → Stop Loss → TP1 → TP2 → TP3
This creates a clear framework for evaluating a potential trade before entering.
For example, a trader can ask:
- Where is the potential Entry?
- Where is the Stop Loss?
- What is the distance between Entry and Stop Loss?
- Where are TP1, TP2 and TP3?
- Does the potential reward justify the potential risk?
- What position size should be used?
This approach encourages traders to think about risk before opening a position.
8. XAUUSD Gold Trading Example
The following example shows SSS v5.0 being used on XAUUSD H1.
The chart displays a SELL setup together with Entry, Stop Loss, TP1, TP2 and TP3 levels.
The market subsequently moves lower, allowing the trader to see how multiple target levels can be used as reference points during trade management.
Chart Example 1 — XAUUSD H1
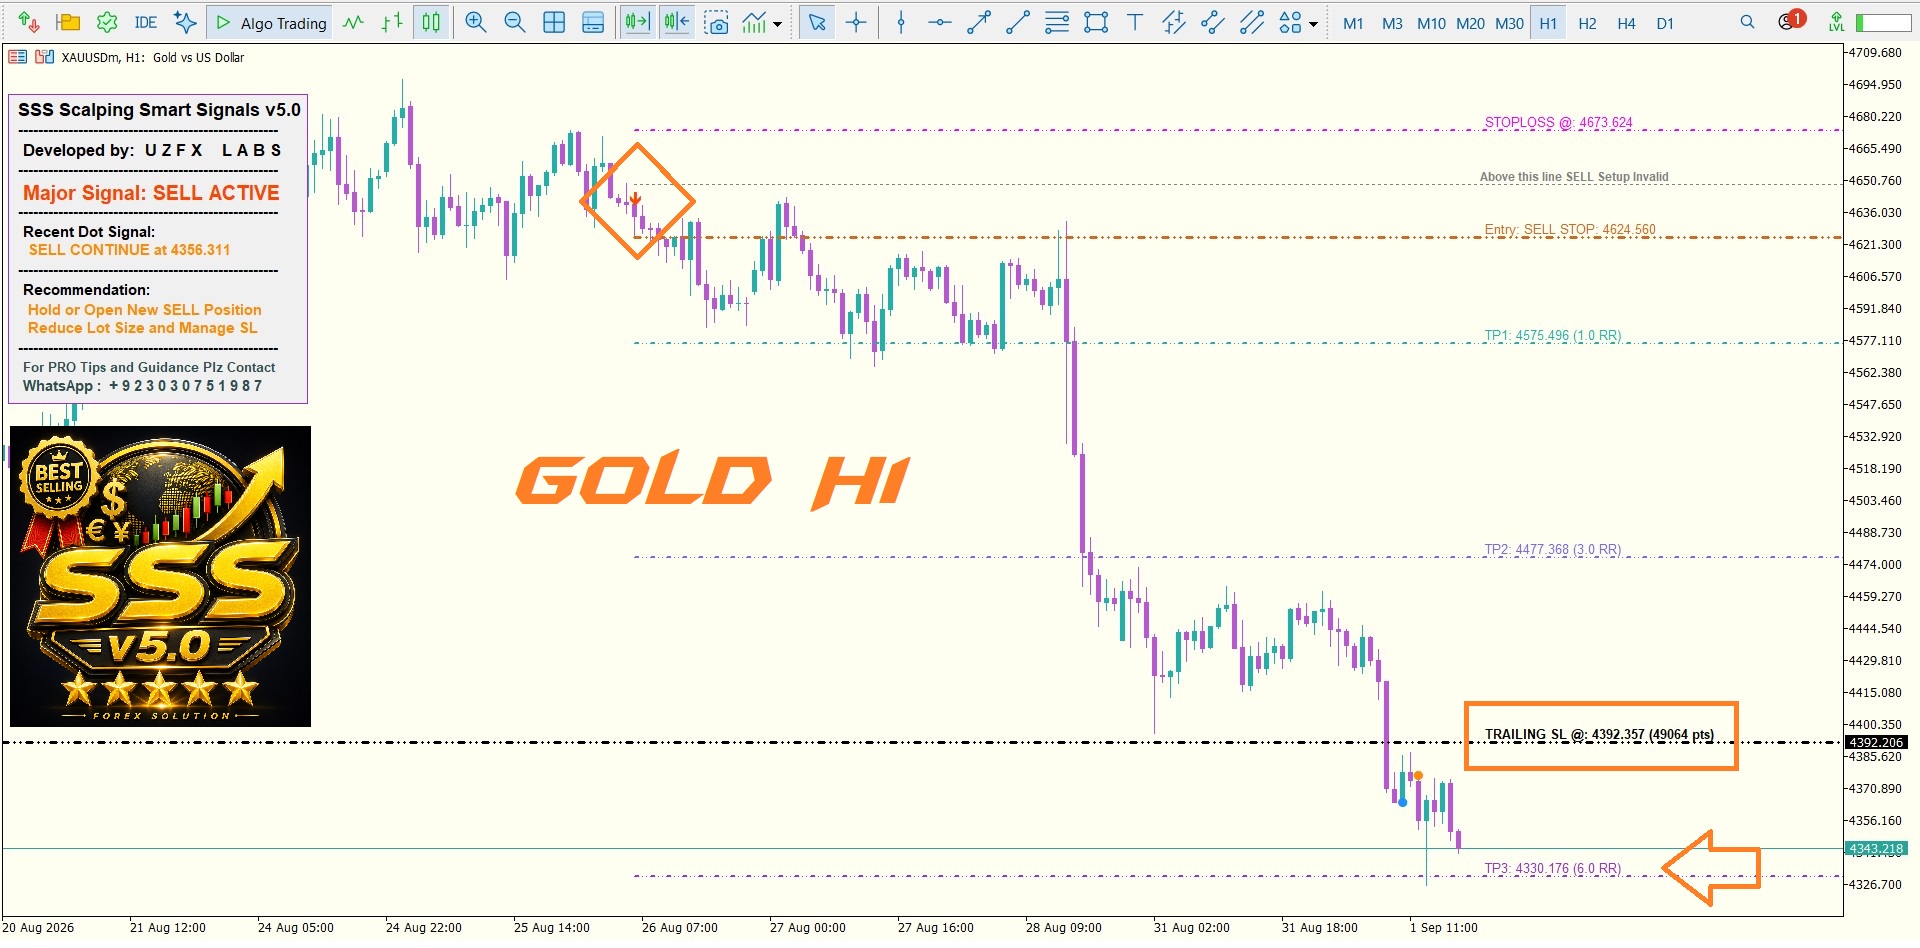
Figure 1 — XAUUSD H1: SSS v5.0 SELL setup showing Entry, Stop Loss, TP1, TP2, TP3 and Trailing Stop levels.
The purpose of this example is not to suggest that every signal will produce the same result.
Instead, it demonstrates how SSS v5.0 can visually organize a potential trade setup and provide predefined reference levels for analysis and trade management.
9. Forex Example — USDCAD M3
SSS v5.0 can also be used to analyze Forex currency pairs.
The following example shows USDCAD on the M3 timeframe.
The chart displays a SELL setup with Entry, Stop Loss and multiple Take Profit levels.
Chart Example 2 — USDCAD M3
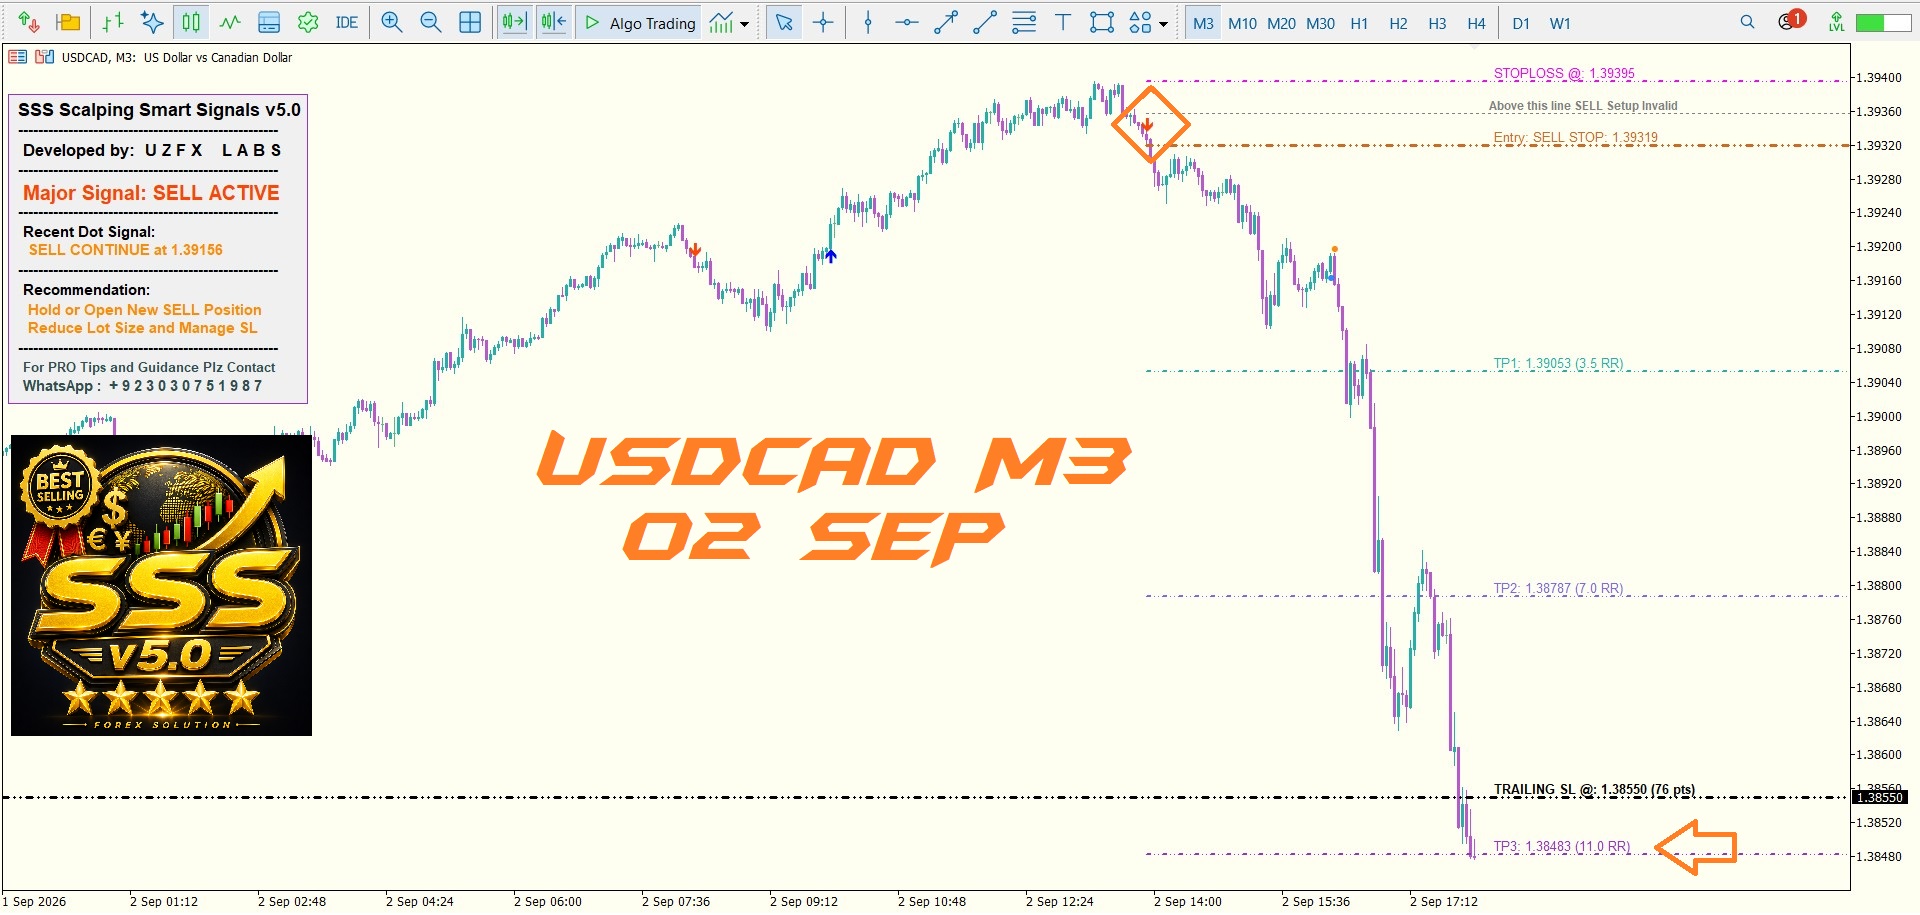
Figure 2 — USDCAD M3: SSS v5.0 SELL setup showing Entry, Stop Loss, TP1, TP2, TP3 and Trailing Stop levels.
This example also demonstrates that traders can use different timeframes depending on their trading style and analysis requirements.
10. How to Read a Complete SSS v5.0 Setup
A simple workflow can be used whenever a new signal appears.
Step 1 — Identify the Signal
Determine whether the chart is showing:
- BUY
- SELL
- Reversal
- Early Warning
- Continue
Step 2 — Check the Market
Look at the recent price structure.
Ask:
Is the market trending, ranging or changing direction?
Step 3 — Review the Entry
Identify the Entry level displayed by the indicator.
Step 4 — Review the Stop Loss
Determine how much distance exists between the Entry and Stop Loss.
Step 5 — Review the Targets
Examine:
- TP1
- TP2
- TP3
Step 6 — Calculate Position Size
The lot size should be determined according to the trader's account size and predefined risk limit.
Step 7 — Make the Final Decision
If the setup meets your own trading rules and risk parameters, you can consider the trade.
If it does not, simply wait for another opportunity.
There is no requirement to trade every signal.
11. Understanding TP1, TP2 and TP3
Multiple Take Profit levels can help traders think about trade management in stages.
For example:
TP1
The first target can be treated as an initial profit-taking or evaluation level.
TP2
The second target provides a further potential objective if the market continues moving in the expected direction.
TP3
The third target represents a more extended potential objective.
Traders can develop their own management rules around these levels.
For example, depending on their strategy, they may:
- Close part of the position at TP1
- Move or manage the Stop Loss
- Hold the remaining position toward TP2
- Continue managing the remaining position toward TP3
The exact approach should be tested and defined in advance.
12. Trailing Stop and Trade Management
A fixed Stop Loss is important for controlling potential downside, but traders may also use a trailing Stop approach when a trade moves favorably.
The SSS v5.0 chart can display trailing Stop information as part of the trade-management framework.
A trader can use this information to monitor whether the market continues to move in the expected direction.
The objective is to avoid turning a previously favorable trade into an unnecessarily large loss.
However, trailing methods should be tested carefully because a Stop that is too close to the market can cause an early exit during normal price fluctuations.
13. Choosing a Timeframe
There is no single timeframe that is suitable for every trader.
Lower Timeframes
Examples include:
- M1
- M3
- M5
- M15
These can provide more frequent trading opportunities, but they can also contain more short-term market noise.
Higher Timeframes
Examples include:
- H1
- H4
- D1
These can provide a broader view of market structure but may produce fewer signals.
A trader can use a higher timeframe to understand the broader market environment and a lower timeframe for more detailed entry analysis.
The appropriate combination should be determined through testing.
14. Using Multiple Timeframes
One possible approach is:
Higher Timeframe
↓
Determine broader market direction
↓
Lower Timeframe
↓
Look for a suitable setup
↓
SSS v5.0 Signal
↓
Evaluate Entry + SL + TP
↓
Risk Management
This can help traders avoid looking at a single timeframe in isolation.
For example, a trader may observe the H1 chart to understand the broader XAUUSD market structure and then use a lower timeframe to look for a more precise setup.
This is only an example of a workflow; traders should test the timeframe combinations that fit their own strategy.
15. Alerts
A trader does not always have the ability to watch the MT5 chart continuously.
SSS v5.0 includes alert functionality designed to help traders monitor signal events.
Alerts can be useful when:
- Monitoring multiple symbols
- Waiting for a particular setup
- Trading from a workstation while performing other tasks
- Monitoring potential entry conditions
Instead of continuously watching every candle, the trader can use alerts to bring attention to relevant events.
16. Risk Management Comes First
A trading indicator cannot eliminate market risk.
Even a well-planned setup can fail because of:
- Unexpected economic news
- Sudden volatility
- Spread changes
- Liquidity conditions
- Market gaps
- Rapid price movements
- Unexpected fundamental developments
For this reason, risk management should remain an essential part of any trading strategy.
Consider the following principles:
- Define your maximum risk before entering a trade.
- Always know your potential loss.
- Avoid excessive leverage.
- Use an appropriate position size.
- Do not increase lot size simply because a previous trade won.
- Avoid revenge trading after a loss.
- Do not trade simply because a signal appears.
- Test your strategy before using it with significant capital.
17. SSS v5.0 Should Be Used as a Decision-Support Tool
One of the most important concepts for new indicator users is understanding the role of an indicator.
An indicator should not be treated as a machine that predicts every future price movement.
A more responsible approach is:
SSS v5.0 Signal
Market Structure
Price Action
Risk Management
Trader's Own Strategy
=
Structured Trading Decision
This allows the trader to remain responsible for the final decision.
18. A Simple Trading Workflow for Beginners
If you are new to SSS v5.0, you can start with a simple process.
1. Open MT5
Open the instrument you want to analyze.
2. Add SSS v5.0
Attach the indicator to the chart.
3. Select Your Timeframe
Choose the timeframe that matches your trading strategy.
4. Wait for a Signal
Observe BUY, SELL, Reversal, Early Warning or Continue signals.
5. Study the Chart
Do not enter immediately.
Look at the surrounding market structure.
6. Review Entry and Stop Loss
Understand the potential risk.
7. Review TP1, TP2 and TP3
Evaluate the potential reward.
8. Determine Position Size
Use your predefined risk-management rules.
9. Execute Only Suitable Setups
If the setup does not meet your trading plan, wait.
10. Manage the Trade
Follow your predefined Stop Loss and Take Profit management rules.
19. Learn Before Trading Live
If you are using SSS v5.0 for the first time, it is better to learn the system before putting significant capital at risk.
A practical learning process is:
Stage 1: Install the indicator.
Stage 2: Learn the interface.
Stage 3: Observe BUY and SELL signals.
Stage 4: Study Reversal, Early Warning and Continue signals.
Stage 5: Understand Entry, SL, TP1, TP2 and TP3.
Stage 6: Review historical charts.
Stage 7: Practice on a demo account.
Stage 8: Develop your own trading rules.
Stage 9: Evaluate your results.
Stage 10: Only then consider incorporating the indicator into your live trading plan.
20. Final Thoughts
Gold and Forex trading require discipline, patience and proper risk management.
SSS v5.0 provides a visual framework that can help traders organize potential trading setups through different signal types and predefined trade-management levels.
The indicator can be used to monitor:
- Market signals
- Potential reversals
- Continuation opportunities
- Entry levels
- Stop Loss
- TP1
- TP2
- TP3
- Trailing Stop information
- Alerts
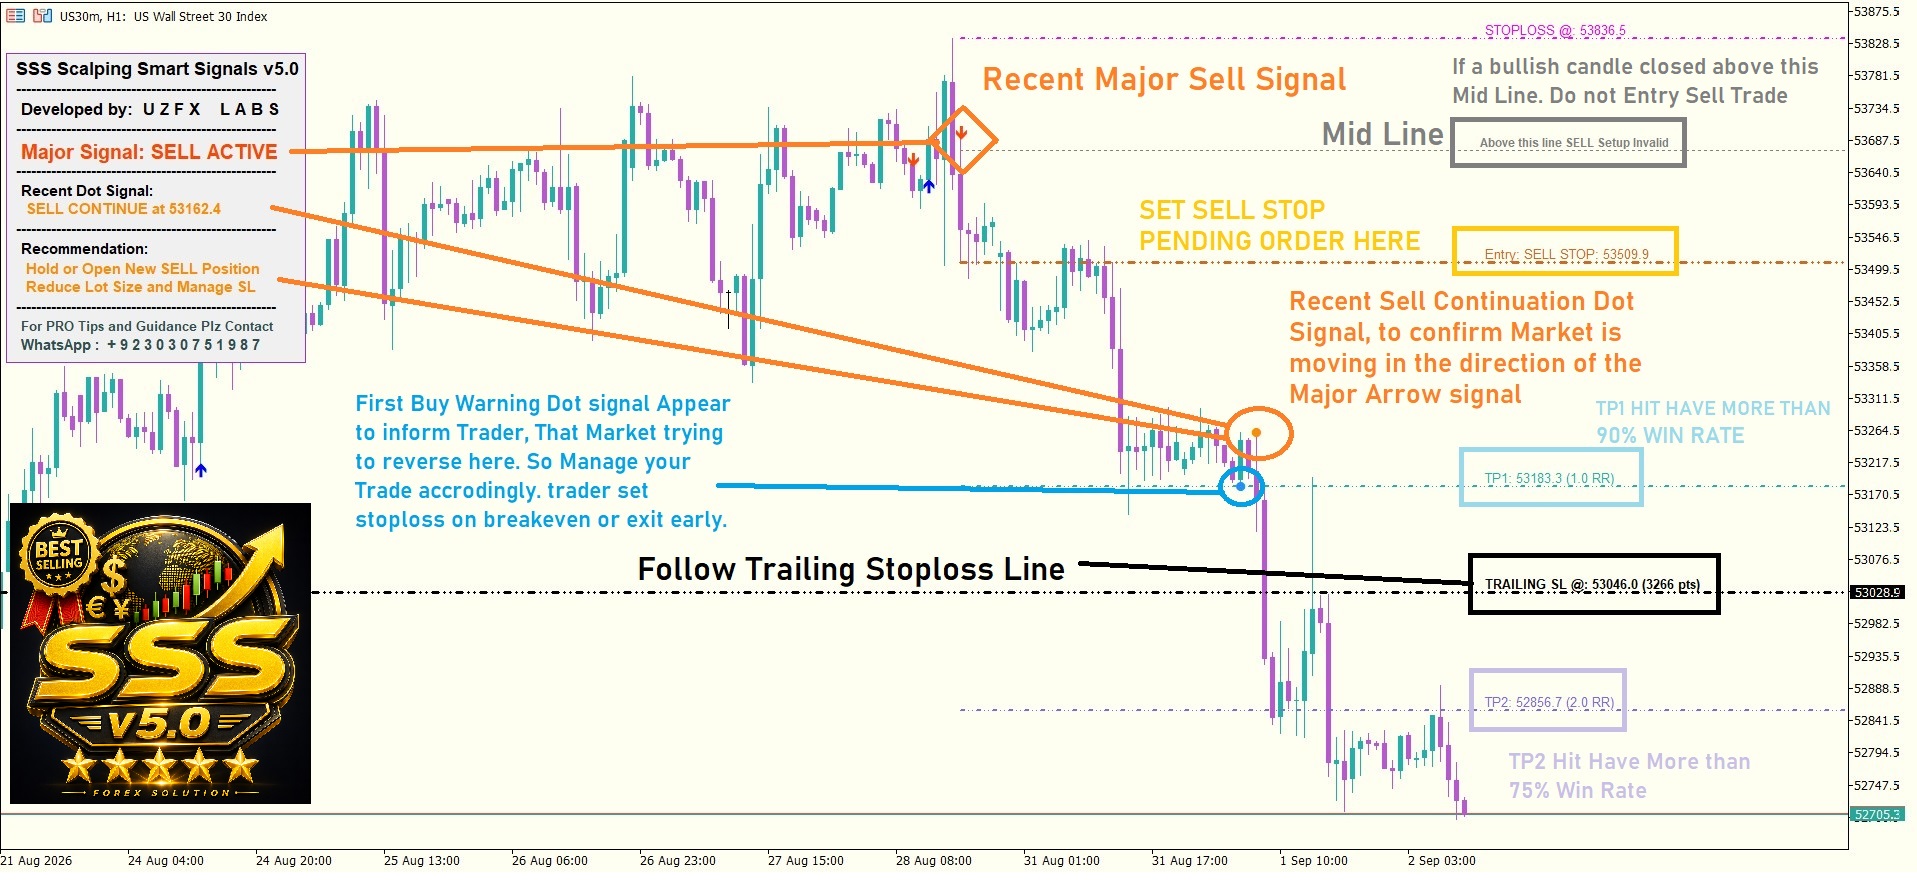
The examples in this article demonstrate how the system can be used on both XAUUSD H1 and USDCAD M3.
The goal is not to predict every market movement.
The goal is to provide traders with a structured way to analyze the chart and plan their trades.
Always remember: no trading indicator can guarantee profits.
Successful trading requires a combination of strategy, discipline, risk management and continuous learning.
If you would like to learn more about SSS v5.0, its features, settings and supported trading workflow, you can visit the product page on the MQL5 Market.
Risk Disclaimer
Trading Forex, Gold, CFDs and other financial instruments involves substantial risk and may not be suitable for every trader.
Past performance, historical examples and individual trading results do not guarantee future performance.
SSS v5.0 is a software-based trading analysis indicator. It does not guarantee profits, trading accuracy or successful results.
Users are solely responsible for their trading decisions, account management and risk management.
Trade with a plan. Manage your risk. Never risk more than you can afford to lose.
Product page: https://www.mql5.com/en/market/product/141469