
0
109
TM QuantShift Regime Matrix: A Smarter Market Regime Indicator for MT5
Markets rarely move in one consistent condition. A clean bullish trend can lose momentum and become a range. A quiet market can suddenly enter a volatile phase. A bearish structure can reverse before a conventional trend indicator reacts clearly.
This is why I created TM QuantShift Regime Matrix—a professional market regime indicator for MT5 designed to help traders recognize changes in market behaviour and evaluate price with better context.
Instead of filling the chart with frequent BUY and SELL arrows, TM QuantShift Regime Matrix focuses on a more important question:
What kind of market are we dealing with right now?
Understanding the Market Before Taking the Trade
Many trading tools are built to produce entry signals. However, the same entry logic may perform very differently in a trending market, a ranging market and a highly volatile market.
A breakout strategy may work well during expansion but struggle during a range. A mean-reversion setup may perform well in sideways conditions but become dangerous when a strong trend begins. The quality of a trading decision therefore depends not only on the entry—it also depends on the surrounding market regime.
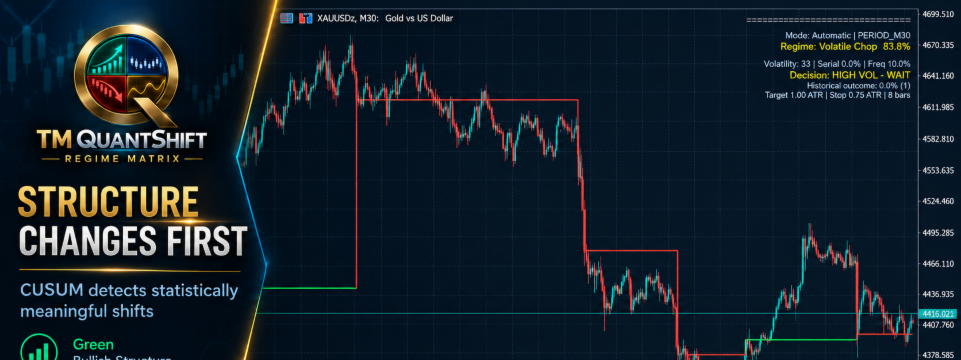
TM QuantShift Regime Matrix helps traders separate market structure from trade execution. It does not tell the trader to buy or sell. It identifies meaningful changes in price behaviour and presents the detected regime through clean, colour-coded levels directly on the MT5 chart.
How the TM QuantShift Market Regime Indicator for MT5 Works
TM QuantShift Regime Matrix uses an adaptive analytical framework built around three complementary components:
1. Change-Point Detection
The indicator monitors standardized price behaviour to detect when the current market process may have changed. Its change-point engine is based on cumulative statistical deviation, allowing it to recognize structural transitions that may be difficult to identify with an ordinary moving-average crossover.
2. Market Regime Classification
Once a structural change is detected, the indicator evaluates the surrounding price action and classifies the environment. Depending on market conditions, the chart can reflect bullish, bearish, ranging or volatile behaviour.
3. Volatility-Aware Adaptation
The analytical thresholds respond to current volatility. This helps the indicator remain useful across instruments with very different price characteristics, such as Forex pairs, Gold, Silver, Crude Oil, indices and cryptocurrencies.
What the Coloured Regime Levels Mean
The step-style levels mark the reference price at which a new market regime was detected. They are not conventional support and resistance lines, and they are not direct trade-entry instructions.
Their purpose is to provide a visual map of structural change. When the regime changes, a new level is established. The colour communicates the character of the detected environment, while the duration of the level shows how long that regime has remained active.
This design allows traders to see important transitions without covering the chart with excessive signals or visual noise.
Why TM QuantShift Does Not Display BUY and SELL Signals
A market-regime tool and a trade-entry system have different jobs.
TM QuantShift Regime Matrix is intentionally designed without automatic BUY and SELL arrows. A bullish regime does not mean that every price is a good buying price, just as a bearish regime does not mean that every candle is an ideal selling opportunity.
The indicator supplies context. Traders can combine that context with their preferred method, including:
• Price-action confirmation
• Breakout and retest setups
• Elliott Wave analysis
• Support and resistance
• Trendlines and chart patterns
• Momentum indicators
• Risk-management rules
This makes TM QuantShift Regime Matrix useful as an analytical layer rather than a rigid signal generator.
Best Timeframes for the TM QuantShift Market Regime Indicator
TM QuantShift Regime Matrix can be used on different chart periods, but M30 and H1 are particularly practical starting points.
These timeframes generally provide enough market information for meaningful regime analysis while remaining responsive enough for active traders. Higher timeframes can be used for broader structural context, while lower timeframes may produce faster and more frequent regime transitions because of market noise.
A practical workflow is to identify the primary environment on H1 and then study execution opportunities on M30. Traders should still test the indicator on their own symbols, broker data and trading style before relying on any configuration.
Markets and Instruments Supported
The indicator is designed to adapt automatically to the active MetaTrader 5 symbol and timeframe. It can therefore be studied across:
• Forex currency pairs
• Gold and Silver
• Crude Oil and other commodities
• Stock-market indices
• Bitcoin and other cryptocurrencies
Because every instrument has different volatility, liquidity and trading hours, results will naturally vary. The indicator should be used as part of a complete analytical process rather than as a promise of future market performance.
Who Can Benefit from TM QuantShift Regime Matrix?
TM QuantShift may be useful for discretionary traders who want a cleaner way to read changing market conditions, systematic traders looking for a regime filter, and technical analysts who want statistical context alongside traditional chart analysis.
It can also help traders answer questions such as:
• Is the market still trending or beginning to range?
• Has volatility changed enough to affect my current strategy?
• Is the latest movement part of the existing regime or a structural transition?
• Should I apply a trend-following approach, a range-based approach or simply wait?
Key Features of TM QuantShift Regime Matrix
• Adaptive change-point detection
• Bullish, bearish, ranging and volatile-regime classification
• Volatility-aware analysis
• Clean, colour-coded regime levels
• Automatic adaptation to the current symbol and timeframe
• Multi-market and multi-timeframe compatibility
• Particularly suitable for M30 and H1 analysis
• No distracting BUY or SELL arrows
• Designed for MetaTrader 5
A Cleaner Way to Read Market Structure
TM QuantShift Regime Matrix was created for traders who want to understand the environment before deciding how to trade it. It does not attempt to replace analysis, discipline or risk management. Its purpose is to make shifts in market behaviour clearer and easier to interpret.
See the shift. Understand the regime. Trade with context.
TM QuantShift Regime Matrix is now available on the MQL5 Market.
Product link: https://www.mql5.com/en/market/product/194664
Risk Notice
Trading involves financial risk. TM QuantShift Regime Matrix is an analytical indicator and does not guarantee profits or predict future market movements with certainty. Always test trading tools carefully and use appropriate risk management.