
SSS v5.0 Complete User Guide: Installation, Settings and Trading Signals

Introduction
SSS Scalping Smart Signals v5.0 is a MetaTrader 5 indicator designed to help traders read market signals and organize trade setups using chart-based information.
This guide explains how to attach the indicator to a chart, understand its visible input settings, read the information panel, and interpret Entry, Stop Loss, Take Profit, warning, and continuation information.
The examples and settings shown in this article are based on the SSS v5.0 interface. Trading signals are not guarantees of future price movement. Always review market conditions and manage risk before placing a trade.
1. Installing SSS v5.0 in MetaTrader 5
To use SSS v5.0:
Open MetaTrader 5.
Open the Navigator window.
Find SSS v5.0 under Indicators.
Drag the indicator onto your desired chart, or double-click it.
Review the indicator settings.
Click OK to apply it to the chart.
Once loaded, the indicator can display signal information and trade-management levels, depending on the selected settings and current chart conditions.
2. Understanding the Inputs Window
The Inputs tab contains options that control the indicator’s behavior and visual display.
Settings are grouped into sections, making it easier to locate signal, trade-management, line-display, panel, and notification options.
3. Core Settings
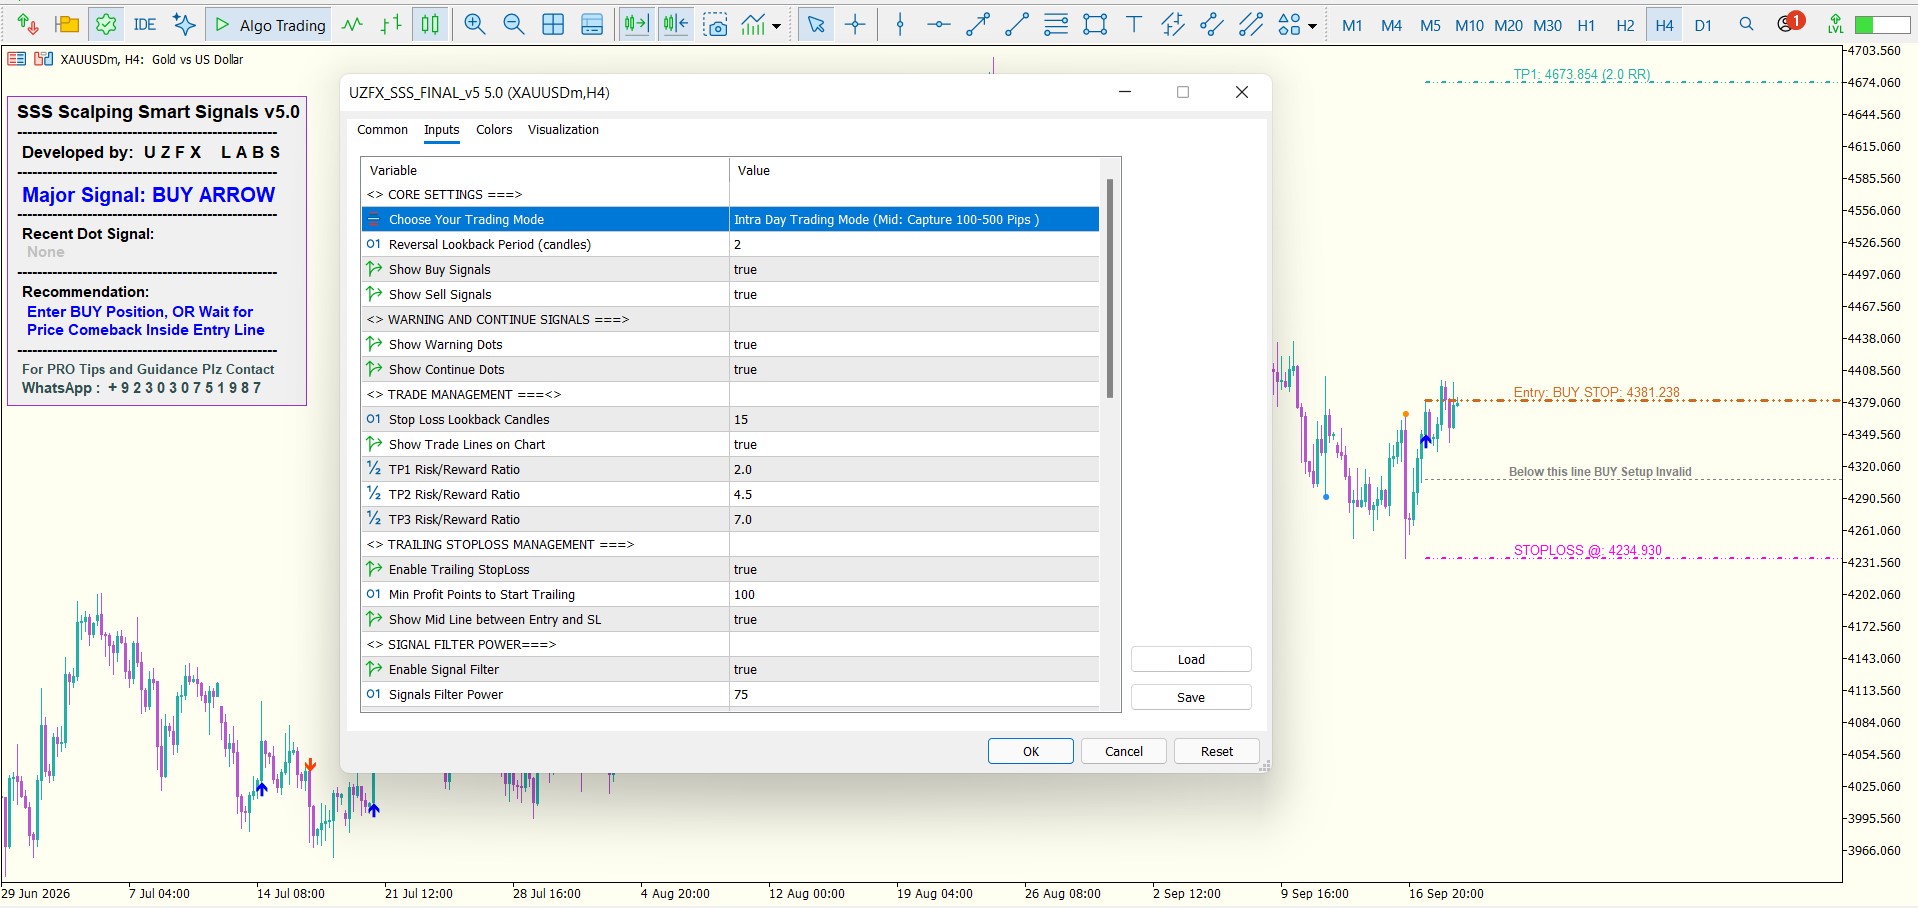
The visible Core Settings include:
| Setting | What it controls |
|---|---|
| Choose Your Trading Mode | Selects the trading mode. The visible option is Intraday Trading Mode. |
| Reversal Lookback Period (candles) | Sets the displayed lookback value for reversal-related logic. |
| Show Buy Signals | Enables or disables Buy signals. |
| Show Sell Signals | Enables or disables Sell signals. |
The screenshot shows Intraday Trading Mode, with a description referring to capturing approximately 10–500 pips. This is a mode description, not a promise that a trade will reach a particular profit target.
The visible Reversal Lookback Period is set to 2 candles. The actual effect of changing this value depends on the indicator’s internal signal logic.
4. Warning and Continue Signals
SSS v5.0 includes options to display additional signal information:
Show Warning Dots: Enables or disables warning dots.
Show Continue Dots: Enables or disables continuation dots.
These options let traders control whether warning and continuation markers appear on the chart.
A warning or continuation marker should be interpreted as indicator information—not as a guarantee that price will reverse or continue in the expected direction.
5. Trade Management Settings
The visible Trade Management settings include:
| Setting | Screenshot value |
|---|---|
| Stop Loss Lookback Candles | 15 |
| Show Trade Lines on Chart | True |
| TP1 Risk/Reward Ratio | 2.0 |
| TP2 Risk/Reward Ratio | 4.5 |
| TP3 Risk/Reward Ratio | 7.0 |
The Stop Loss Lookback Candles setting controls the configured lookback value used by the indicator’s stop-loss logic.
When Show Trade Lines on Chart is enabled, trade-related levels can be displayed visually.
The TP1, TP2, and TP3 Risk/Reward Ratio settings define the configured reward-to-risk ratios for the respective targets. Actual trade outcomes depend on market movement, execution, spread, and risk-management decisions.
6. Trailing Stop Loss Management
The screenshot shows these trailing stop options:
Enable Trailing Stop Loss: True
Minimum Profit Points to Start Trailing: 100
Show Mid Line between Entry and SL: True
The minimum-profit setting specifies the configured point threshold before trailing is intended to start.
The mid-line option controls whether a line between Entry and Stop Loss is displayed.
Trailing-stop behavior should be understood before trading live. A trailing stop does not eliminate risk, and fast market movement or execution conditions can affect the final exit price.
7. Signal Filter Power
The visible Signal Filter settings include:
Enable Signal Filter: True
Signals Filter Power: 75
These options control the indicator’s signal-filter feature and its configured power value.
The screenshot confirms the selected values, but it does not show the complete internal calculation of the filter. Traders should test different settings on a demo account before deciding which configuration suits their strategy.
8. Trade Line Colors and Appearance
SSS v5.0 allows users to customize the colors of chart levels.
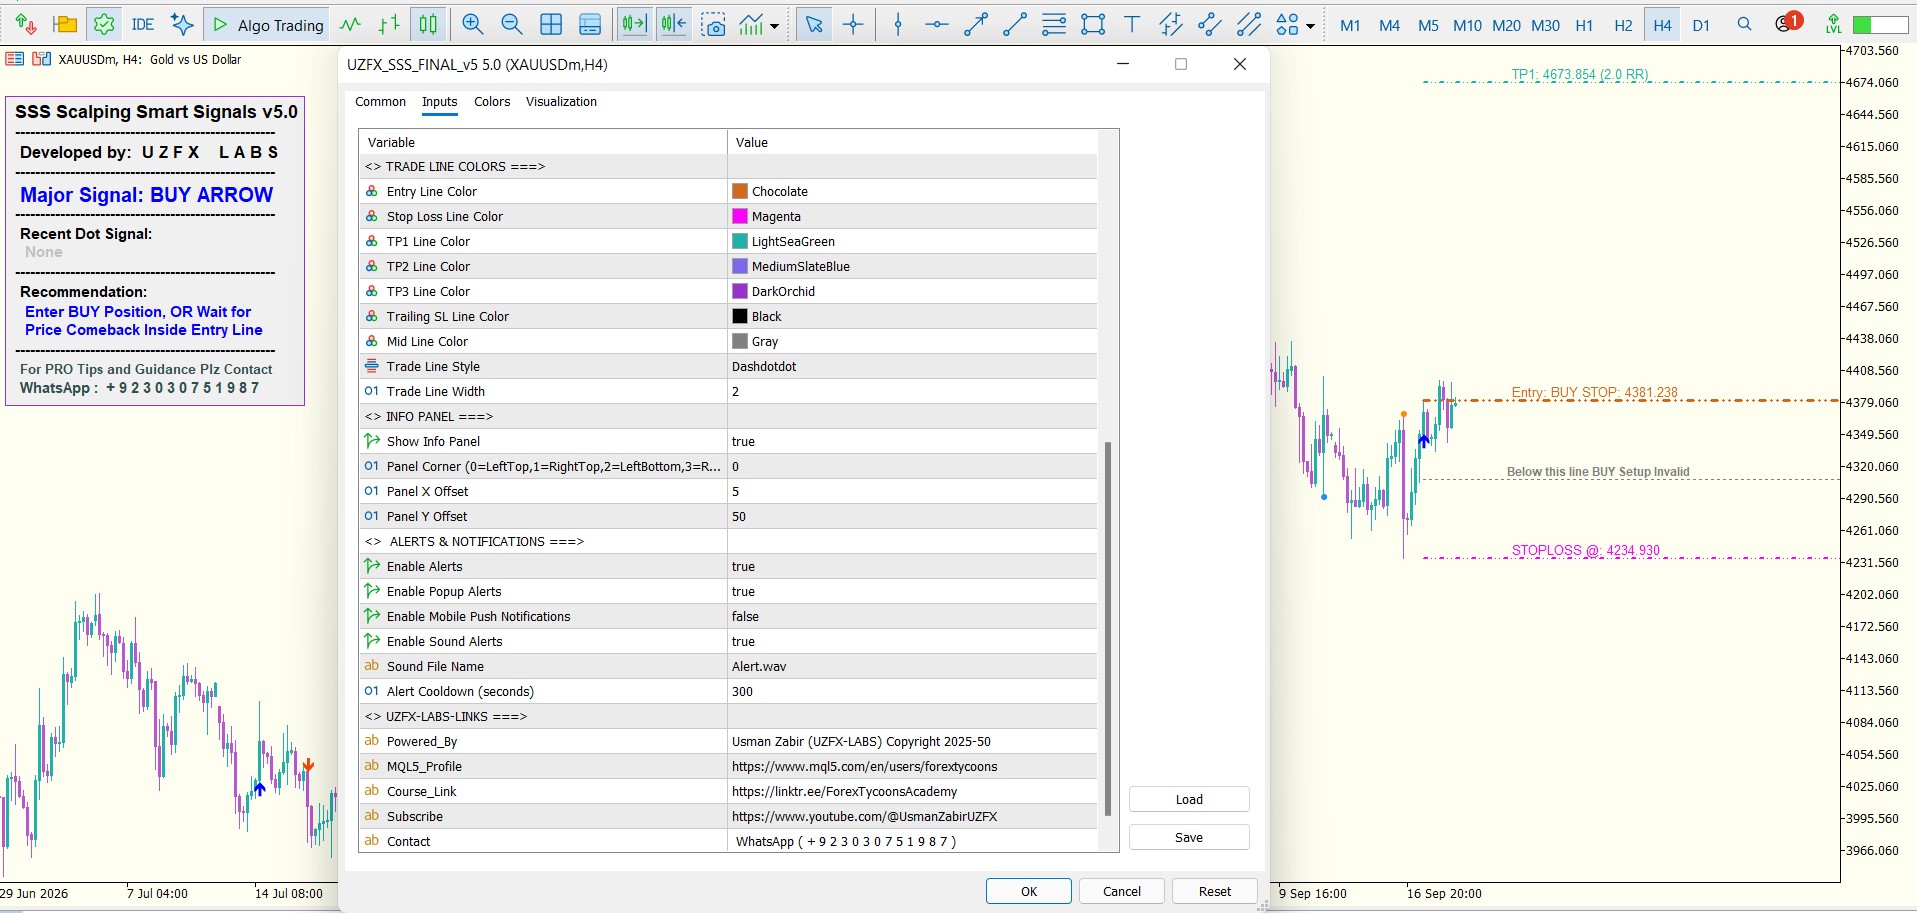
The second screenshot shows these line-color settings:
| Chart element | Visible default color |
|---|---|
| Entry Line | Chocolate |
| Stop Loss Line | Magenta |
| TP1 Line | LightSeaGreen |
| TP2 Line | MediumSlateBlue |
| TP3 Line | DarkOrchid |
| Trailing SL Line | Black |
| Mid Line | Gray |
The screenshot also shows:
Trade Line Style: Dashdot
Trade Line Width: 2
These options help users distinguish different trade levels on the chart. You can adjust the colors and line appearance according to your chart theme and visual preference.
9. Information Panel
The visible Info Panel options include:
Show Info Panel: True
Panel Corner: 0
Panel X Offset: 5
Panel Y Offset: 50
These settings control whether the information panel is displayed and where it is positioned.
The screenshot shows the panel in the upper-left area of the chart. The panel displays information such as the major signal, recent dot signal, and a recommendation message.
Panel placement and displayed content may vary with the chart, symbol, timeframe, and indicator state.
10. Alerts and Notifications
The screenshot shows the following notification options:
| Setting | Visible value |
|---|---|
| Enable Alerts | True |
| Enable Popup Alerts | True |
| Enable Mobile Push Notifications | False |
| Enable Sound Alerts | True |
| Sound File Name | Alert.wav |
| Alert Cooldown (seconds) | 300 |
These settings allow users to control different types of notifications.
Mobile push notifications are disabled in the screenshot. If you choose to use mobile notifications, make sure your MetaTrader terminal and mobile app are configured appropriately.
The alert cooldown is shown as 300 seconds. This is a configured cooldown value; users should refer to the indicator’s behavior during testing to understand exactly how it applies to their setup.
11. Reading Signals and Trade Levels on the Chart
When SSS v5.0 is attached to a chart, it may display signal markers and trade-management levels.
Common chart elements include:
BUY / SELL signal: Indicates the direction of a detected setup.
Entry line: Shows the entry level associated with the displayed setup.
Stop Loss line: Shows the configured stop-loss level.
TP1, TP2, TP3: Show the displayed take-profit levels.
Trailing SL: Shows the trailing stop-loss level when applicable.
Warning and Continue dots: Provide additional signal context.
Before entering a trade, check the signal direction, current price, entry level, stop-loss distance, and potential reward-to-risk ratio.
Do not place a trade solely because a marker appears. Review the broader market structure and your own trading plan.
12. Choosing a Timeframe and Symbol
SSS v5.0 can be used on different symbols and timeframes supported by MetaTrader 5.
However, signal behavior can differ between instruments and timeframes. Gold, major currency pairs, indices, and cryptocurrencies may have different volatility and spread conditions.
A setup on a lower timeframe may require a different risk-management approach from a setup on a higher timeframe.
Test the indicator on the symbols and timeframes you intend to trade before using it in a live account.
13. A Practical Beginner Workflow
A beginner can use the following checklist when reviewing a potential setup:
Open the desired symbol and timeframe.
Confirm that SSS v5.0 is loaded correctly.
Review the major signal and any recent signal markers.
Check the Entry, Stop Loss, and Take Profit levels.
Calculate the potential loss based on your lot size and stop-loss distance.
Check whether the setup matches your trading plan.
Avoid entering if the risk is too large or the setup is unclear.
Record the trade and review the outcome.
14. Risk Management
No indicator can remove the risks involved in trading.
Consider the following practices:
Use a position size appropriate for your account.
Decide your maximum acceptable loss before entering.
Avoid risking money you cannot afford to lose.
Be aware of spreads, slippage, news events, and market gaps.
Test settings on a demo account before live use.
Never assume that a displayed target will necessarily be reached.
Past chart examples do not guarantee similar future results.
Conclusion
SSS v5.0 provides configurable signal-display, trade-line, information-panel, and alert options within MetaTrader 5.
Understanding these settings can help traders organize their chart view and review potential trade setups. Take time to explore the inputs, test the indicator on a demo account, and use independent risk-management rules before trading live.
Product page: https://www.mql5.com/en/market/product/141469
Risk Disclaimer: Trading Forex, Gold, and other financial instruments involves significant risk. SSS v5.0 is a technical analysis tool and does not guarantee profits or prevent losses. You are responsible for your own trading decisions.