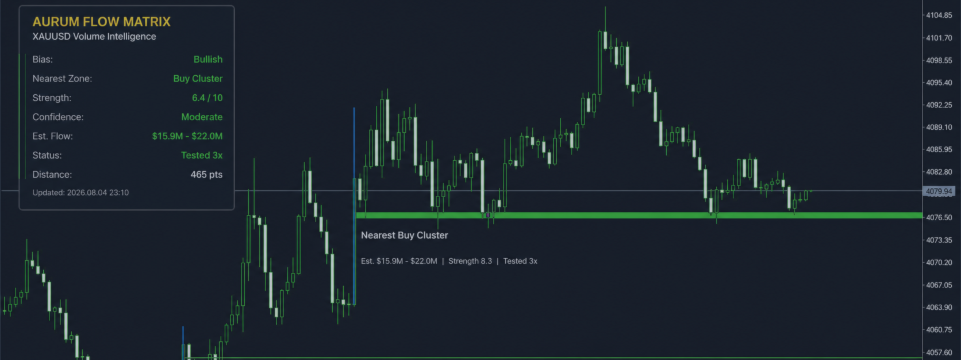

Aurum Flow Matrix is a professional indicator designed for XAUUSD.
It helps traders find important price areas where strong buying, selling, or absorption may have appeared.
The indicator turns complex market activity into clear visual zones, making the chart easier to read and understand.
It does not open trades automatically. It is a decision-support tool that helps you identify areas worth watching.
Main Benefits
- Clear buy and sell zones
- Easy market direction reading
- Strength and confidence rating
- Estimated market activity
- Automatic zone status tracking
- Clean dashboard
- Alerts when price approaches important zones
- Designed especially for XAUUSD

What Does Aurum Flow Matrix Show?
The indicator displays four main types of zones.
Buy Cluster
A price area where buying pressure became strong.
This zone may act as support when price returns to it, especially when the market direction is bullish.
Sell Cluster
A price area where selling pressure became strong.
This zone may act as resistance when price returns to it, especially when the market direction is bearish.
Buy Absorption
This means sellers pushed the price down, but buyers absorbed the selling pressure and stopped the move.
A Buy Absorption zone may show an area where buyers previously defended the price.
Sell Absorption
This means buyers pushed the price up, but sellers absorbed the buying pressure and stopped the move.
A Sell Absorption zone may show an area where sellers previously defended the price.

Zone Strength and Confidence
Each detected zone receives a strength score from 0 to 10.
A higher score means that the zone had stronger market activity and better confirmation when it was created.
The indicator also displays a confidence level:
- High
- Good
- Moderate
A high score does not guarantee that the zone will hold. It simply means that the zone showed stronger conditions compared with weaker zones.
Zone Status
The indicator automatically tracks how often price has returned to each zone.
Fresh
The zone has not been retested yet.
Fresh zones normally deserve more attention because they have not been used repeatedly.
Tested Once
Price has already visited the zone one time.
The zone may still be useful, but some of its original strength may have been consumed.
Tested Multiple Times
The zone has been visited several times.
Repeated tests may gradually weaken the area.
Exhausted
The zone has been tested too many times and may no longer be reliable.
Broken
Price closed clearly beyond the zone.
Broken zones can be hidden to keep the chart clean.
Estimated Flow
The indicator displays estimated activity such as:
Est. Flow: $15.9M – $22.0M
This value is a calibrated estimate based on broker volume and price activity.
It is not centralized exchange volume and does not mean that one trader bought or sold the exact displayed amount.
The value is mainly useful for comparing the relative activity of one zone with another on the same broker.
How to Use the Indicator
A simple trading workflow:
- Wait for price to approach a fresh or lightly tested zone.
- Check the market bias shown on the dashboard.
- Prefer buy zones during bullish conditions.
- Prefer sell zones during bearish conditions.
- Look for price rejection, momentum, or market-structure confirmation.
- Use the zone as market context, not as a blind entry.
- Always apply your own stop loss and risk management.
A zone is normally more interesting when it is:
- Fresh
- Strong
- Near the current price
- Aligned with the market bias
- Confirmed by price action

Smart Dashboard
The compact dashboard helps you understand the current market situation quickly.
It displays:
- Bias – Bullish, Bearish, or Neutral
- Nearest Zone – the closest active zone
- Strength – zone score from 0 to 10
- Confidence – High, Good, or Moderate
- Estimated Flow – estimated market activity
- Status – Fresh, Tested, Exhausted, or Broken
- Distance – distance between price and the nearest zone
The dashboard is placed on the left side of the chart and can be hidden when more chart space is needed.
Telegram Bridge
A separate Aurum Flow Matrix Telegram Bridge is available after purchase.
The bridge can send real-time Telegram notifications for events such as:
- New zone detected
- Price entered a zone
- Zone broken
- Market bias changed
- Bridge connected successfully
The Telegram Bridge requires a Telegram bot token and Chat ID.
It is provided separately after purchase and is not part of the indicator’s automatic trading logic.

Recommended Timeframes
The indicator is designed around XAUUSD market activity.
Recommended use:
- M5 – detailed zone reading and entry monitoring
- M15 – market context and confirmation
- M30 or H1 – broader market view
The main zones may remain similar across timeframes because the indicator uses an internal multi-timeframe calculation.
For the clearest view, M5 is recommended.
Why Traders May Find It Useful
Aurum Flow Matrix was built to stay visual and practical.
- Clean chart design
- Easy-to-understand zone names
- No complicated settings
- Internal strategy parameters are protected
- Suitable for scalpers and day traders
- Helps traders focus on important price areas
- Designed specifically for gold
- Does not overcrowd the chart with unnecessary signals

Important Information
Aurum Flow Matrix is not a guaranteed buy or sell signal system.
It does not predict the market with certainty and should not be used as the only reason for entering a trade.
The displayed volume and flow values are estimates based on broker-provided data. Results and displayed activity may differ between brokers, symbols, account types, and trading conditions.
Always test the indicator first and use proper risk management.
Recommended Setup
- Symbol: XAUUSD
- Recommended chart: M5
- Context chart: M15
- Clean chart background
- Allow alerts if required
- Use the same broker when comparing historical and current flow values
Main Features
- XAUUSD volume intelligence
- Buy Cluster zones
- Sell Cluster zones
- Buy Absorption zones
- Sell Absorption zones
- Strength score
- Confidence rating
- Estimated activity flow
- Fresh and tested zone tracking
- Broken-zone detection
- Nearest-zone detection
- Market bias dashboard
- Confirmation candle highlighting
- Proximity alerts
- Optional Telegram Bridge after purchase
- Clean and adjustable visual design
- Protected internal strategy parameters
Final Summary
Aurum Flow Matrix helps gold traders see where important market activity may have occurred.
Instead of filling the chart with complicated signals, it provides clear zones, simple ratings, and useful market context.
Use the zones to understand the market, wait for confirmation, and always protect your account with proper risk management.