
ChartSync Pro - User Guide (multi-chart synchronization for MetaTrader 5)

| ChartSync Pro Multi-chart synchronization for MetaTrader 5 User guide · Market version 1.00 · AXOM Labs |
| English · Русский · 中文 · Español · Português · Deutsch · Français · Italiano |
Trial version — download and try it now
Free, runs on any MetaTrader 5 demo account. Put it on two charts and you will see it working in about two minutes.
Full version for MetaTrader 5
No time limit, works on demo and live accounts, free updates. Available on the MQL5 Market.
1. What is ChartSync Pro?
One analysis, instantly multiplied across all your charts.
ChartSync Pro is a tool for traders who work on several charts in MetaTrader 5. It gives you parallel analysis across multiple instruments and a wider working area: it removes the repetitive work of redrawing the same analysis over and over. You draw a trend line on one chart and it appears immediately on all the others. You move the crosshair to check a candle and every chart follows you at the same time. It also lets you spread your working area over several monitors, so the analysis is easier to read.
What it solves, in short:
- Effortless multi timeframe analysis — mark a support on H4 and see it immediately on M5, H1 and D1, exactly where it belongs.
- Parallel analysis on correlated instruments — change the symbol on the leading chart and the others switch automatically to the correlated assets you chose.
- Multi monitor setup — drive several screens from one central chart.
- Synchronized crosshair — see exactly the same moment in time on every chart at once.
- Subwindow objects preserved — levels drawn on indicators (RSI, Stochastic…) stay in place when you change the timeframe.
| 💡 To place charts on several monitors: MT5 lets you detach a chart window from the terminal so you can move it to another monitor. Right click on the chart and select “Docked” (untick the option), then drag the window to the screen you want. Many traders do not know MT5 can do this — and with ChartSync Pro the charts spread across your screens stay synchronized with each other. |
 The same instrument on H1 and H4. The zone and the levels were drawn only once - they appear identically on both charts, each at its own scale. |
 And further: the same analysis on four timeframes at once - H4, H1, M30 and M15. You draw it once, you see it everywhere. |
100% safe for you. ChartSync Pro runs entirely inside MetaTrader 5 — no external servers and no complicated installation. It has no access to your account, your passwords or your funds, and it sends nothing outside your terminal. Your data stays with you.
2. Before you start
You need:
- MetaTrader 5 (demo or live account — it works on both).
- At least two chart windows open (one leads, one follows).
Trial and Pro, in short:
Trial — a free trial version, it works on Demo accounts only, for a limited period. Ideal for seeing how it behaves on your own setup before buying.
📎 Download the trial version: ChartSync_Pro_Trial.zip — the download starts as soon as you click. The archive holds a single file, the indicator itself, protected with MQL5 Cloud Protector. The link always points to the current build.
Pro — the full version from the MQL5 Market, with no time limit and with free updates.
Both behave identically as far as synchronization goes. When the trial expires, we show you how to move to Pro (see Help and contact).
3. Installation
ChartSync Pro comes ready to use — you do not have to compile anything.
- Open the Navigator in MetaTrader 5 ( Ctrl+N ).
- Find ChartSync Pro under Indicators.
- Drag the indicator onto the chart window you want and press OK.
No MetaEditor, no compiling — those are for developers, not for you.
4. First run, in a few minutes
The simplest case: one Master chart (it leads) and one Slave chart (it follows), on the same symbol.
Step 1 — The Master chart
Drag ChartSync Pro onto the first chart. In the settings window:
- Indicator Role → Master
- Group of Charts ID (Ecosystem) → leave ECO_1
- [ON/OFF] Channel 1 → ticked (on)
Everything else stays on its default value. Press OK.
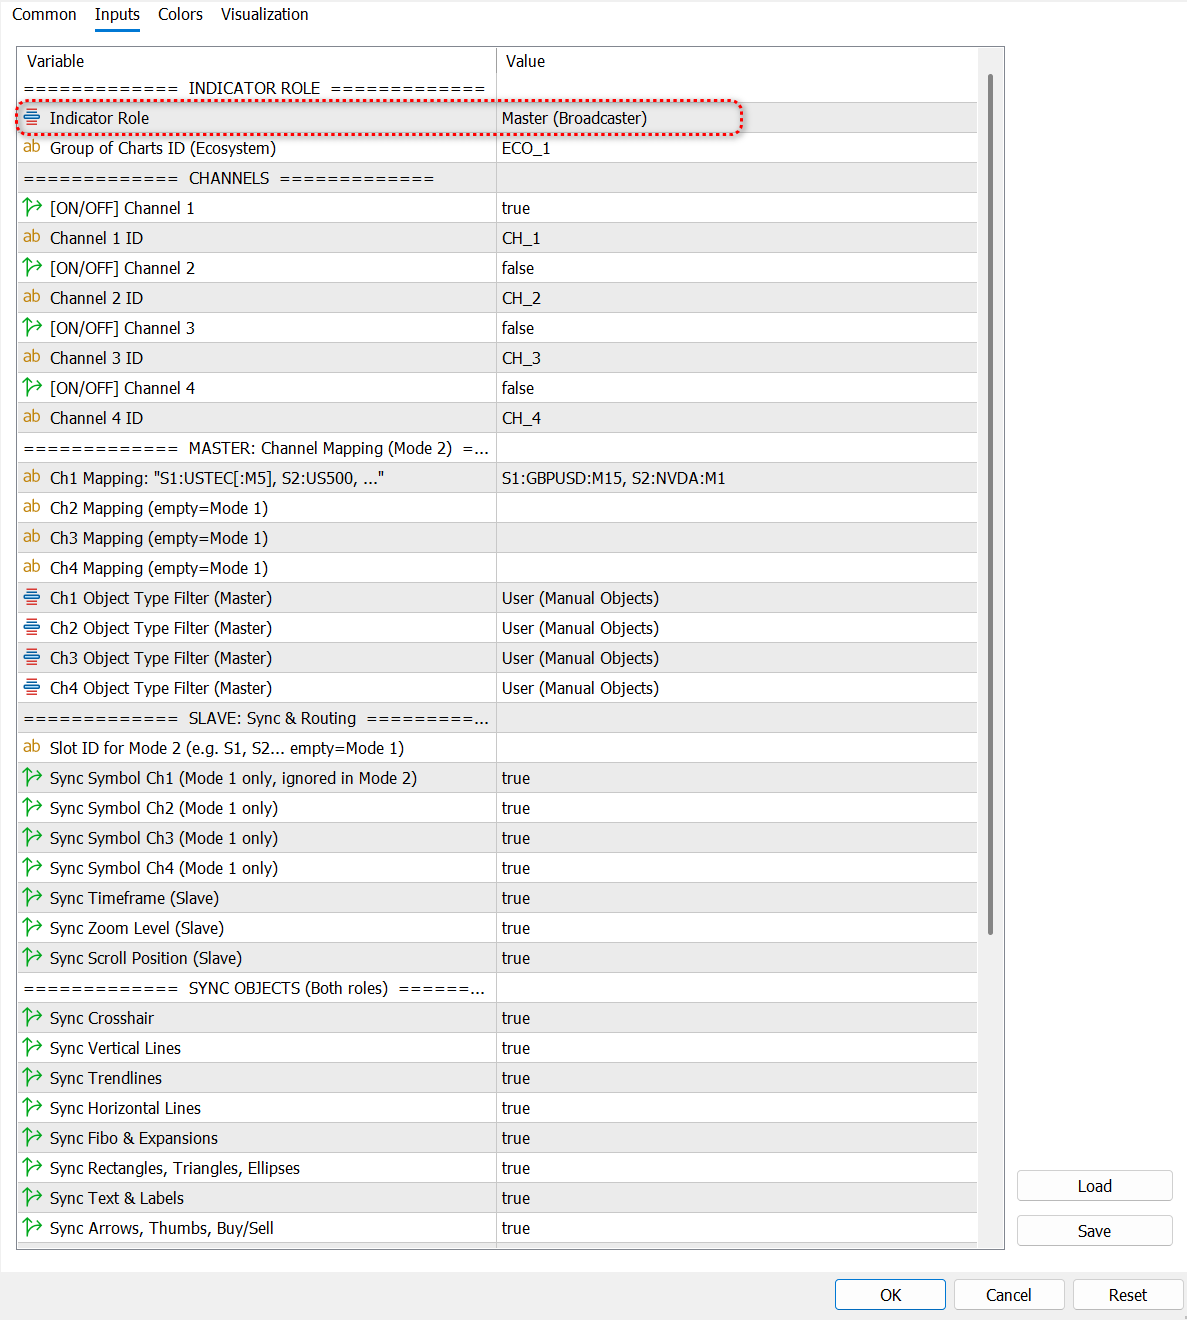 The settings window shown when you attach the indicator. The only thing you change now is Indicator Role - set it to Master. Everything else stays on its default value. |
Step 2 — The Slave chart
Open a second chart. Drag ChartSync Pro onto it. In the settings:
- Indicator Role → Slave
- Group of Charts ID (Ecosystem) → ECO_1 (exactly the same as on the Master)
- [ON/OFF] Channel 1 → ticked
Press OK.
Step 3 — Activate and test
- Click once on the Master chart to give it focus.
- Turn on the crosshair — press the mouse wheel on the chart (or Ctrl+F ).
What you should see now: when you move the crosshair on the Master, it moves on the Slave too.
Now draw a trend line (or a Fibonacci) on the Master.
What you should see now: it appears on the Slave instantly.
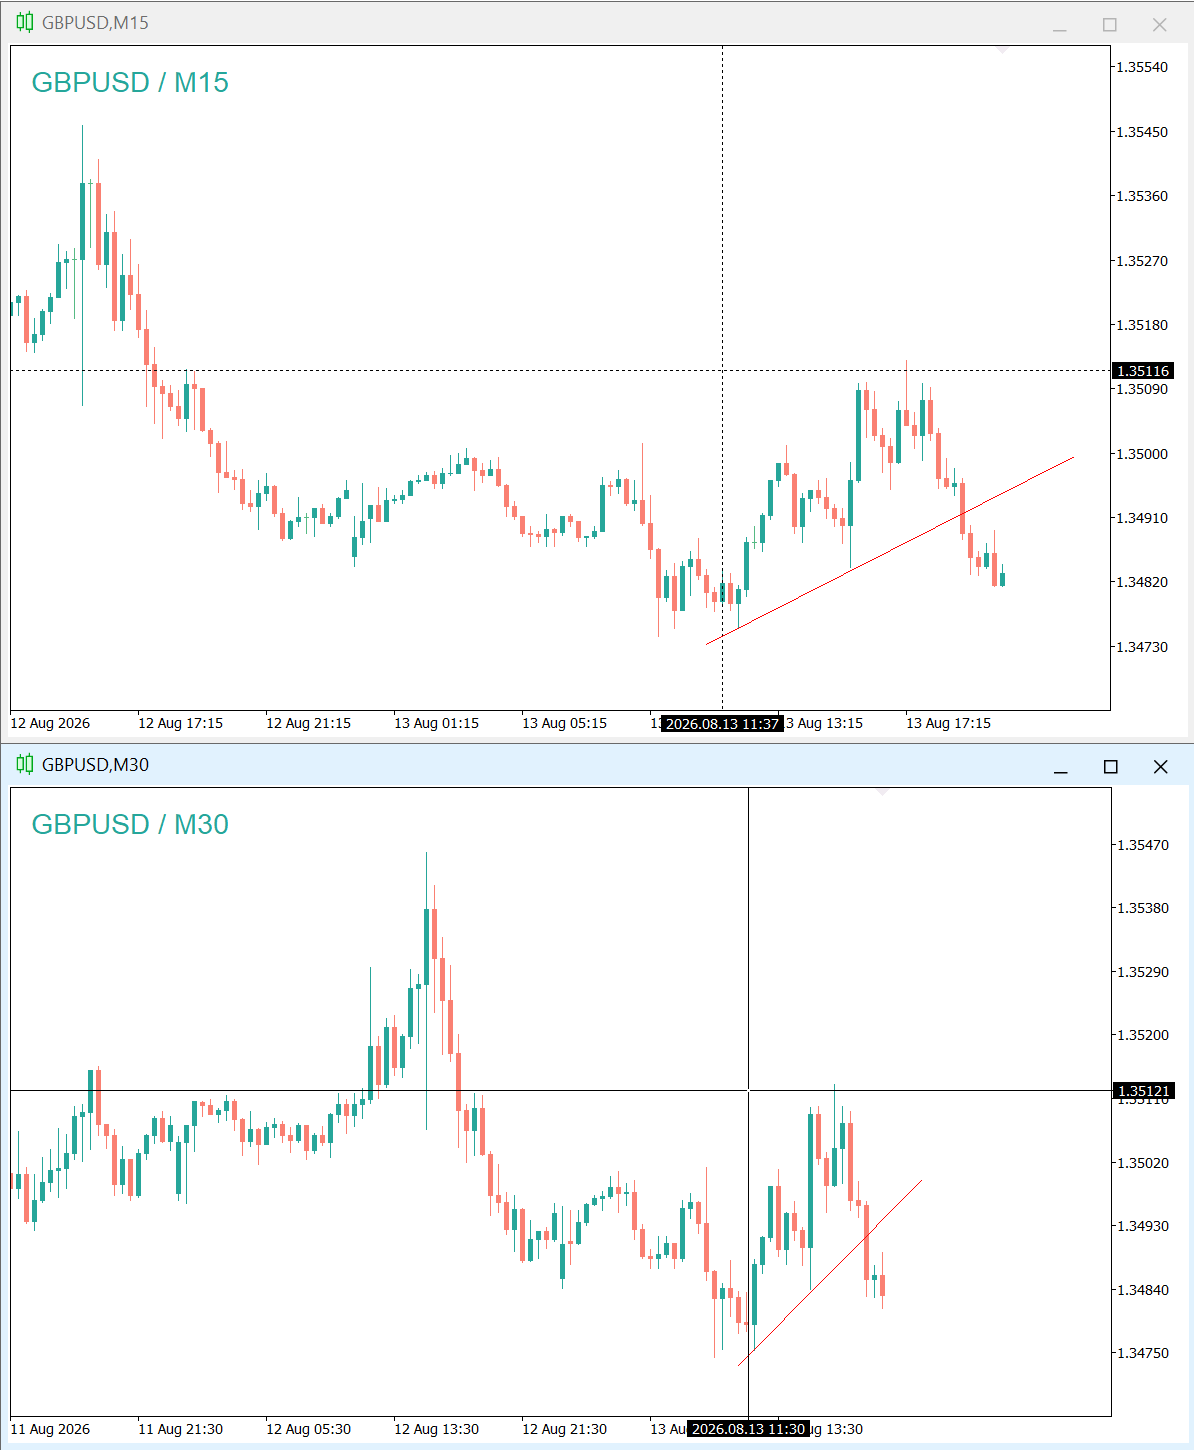 The synchronized crosshair: the horizontal line and the time marker show the same moment on both charts, at the same time. |
Tip: you can add as many Slave charts as you want — all with the same Group of Charts ID and the same Channel 1 ID. They all receive from the same Master.
5. How ChartSync Pro thinks (basic concepts)
Three simple ideas and you have understood everything:
Master and Slave (the roles). The Master is in charge — it broadcasts the drawings, the crosshair and the symbol changes. You draw on the Master only. The Slave listens and reproduces. A chart is either one or the other — you pick it in Indicator Role.
⚠️ Only one ChartSync Pro per chart. If you accidentally add a second one on the same chart, the signal is duplicated and breaks. Keep exactly one on each chart. ⚠️ When you change the symbol on a Master chart, the drawings in the main window are cleared. They do not come back if you return to the original symbol. If you have an analysis you want to keep, dedicate a chart to that instrument. Objects drawn in subwindows (on indicators such as RSI or Stochastic) are preserved.
The ecosystem (Group of Charts ID). Only charts with the same Group of Charts ID talk to each other. It works like a private room: you can have a “Currencies” ecosystem separate from “Indices”, “Gold” or “Crypto”.
The channels. Inside one ecosystem, the Master and the Slave communicate on the same channel (Channel 1 ID). ChartSync Pro supports up to 4 channels at the same time, for complex setups — you can ignore them at the beginning.
6. Working modes
A. Simple mode (direct cloning)
The default mode — active when you leave the mapping empty on the Master and leave Slot ID empty on the Slave.
When do you use it? For multi timeframe analysis of the same instrument (the same symbol on M5, H1, H4, D1), or to project the same chart onto several monitors — one analyst draws, several screens show the result.
On a Slave you can control exactly what it picks up, from the settings menu:
| Setting (the label in MT5) | Effect |
|---|---|
| Sync Symbol Ch1 | The Slave switches to the Master's symbol. Unticked = it stays on its own symbol. |
| Sync Timeframe (Slave) | The Slave follows the Master's timeframe. (Want M5 and H1 separately? Untick this on the Slave.) |
| Sync Zoom Level (Slave) | The Slave matches the Master's zoom (zoom in / zoom out). |
| Sync Scroll Position (Slave) | The Slave scrolls together with the Master. |
A useful tip you will certainly use: in Simple mode you can change the timeframe manually on a Slave. It keeps your choice until the Master changes the symbol.
B. Mapping mode (correlated instruments)
For traders of correlated pairs, indices, shares or correlated crypto. The Master tells each Slave which different instrument to display.
A concrete example. Say you trade on two monitors and you want to watch one currency pair together with the instruments correlated to it — to see in real time where the support and resistance levels sit and what the indicators are doing on the correlated pairs.
We put a Master on GBPJPY (say on M1) and three Slaves on the correlated instruments: GBPUSD, USDJPY and EURJPY.
How to configure it:
How to write the mapping correctly. The slot and the symbol are written joined, with no space after the colon: S1:EURUSD:M15. A space goes only after the comma, between pairs: S1:EURUSD:M15, S2:DE40:M15. The timeframe is optional — if you leave it out, the Slave uses its Sync Timeframe setting. This is exactly the format shown in the hint inside the MT5 settings window.
On the Master, in the Ch1 Mapping setting, write the rules in the Slot:Symbol:Timeframe format (the timeframe is optional):
S1:GBPUSD, S2:USDJPY:M5, S3:EURJPY
On each Slave, in Slot ID for Mode 2, write its own slot: the first S1 , the second S2 , the third S3 .
| ⚠️ Very important: write the symbols exactly as they are at your broker. Some brokers add suffixes or prefixes (for example .m , .pro , _raw ). If the name is not identical to the broker's, the switching will not work. Likewise, respect the format above — do not add extra spaces or other characters, as they can cause errors. |
Now, when you click on the Master, Slave S1 switches to GBPUSD, S2 to USDJPY on M5, and S3 to EURJPY.
| Format | Example | Meaning |
|---|---|---|
| SLOT:SYMBOL | S1:GBPUSD | Slave S1 switches to GBPUSD. Timeframe follows the Sync Timeframe setting. |
| SLOT:SYMBOL:TF | S2:USDJPY:M5 | Slave S2 switches to USDJPY, forced to M5. |
| SLOT:SYMBOL | S3:EURJPY | Slave S3 switches to EURJPY. Timeframe follows the Sync Timeframe setting. |
Accepted timeframes: M1, M2, M3, M4, M5, M6, M10, M12, M15, M20, M30, H1, H2, H3, H4, H6, H8, H12, D1, W1, MN1.
 The configuration, on the Master: Ch1 Mapping holds the rule S1:GBPUSD, S2:USDJPY:M5, S3:EURJPY. Everything else stays on its defaults. |
 The result: every Slave took its own instrument - USDJPY, EURJPY, GBPUSD and GBPJPY - all driven from the same Master chart. |
Multi Master: you can have several Masters in the same group and channel, each with its own mapping. You click on any Master and all the Slaves reconfigure according to its mapping. A Slave whose Slot ID does not appear in a Master's mapping simply ignores that Master and stays on its last symbol.
C. Advanced setup: several channels on the same Master
So far we have used a single channel. But the Master broadcasts on every channel that is switched on, and each channel has its own mapping table. This means that a single Master can drive two completely different groups of charts at the same time.
An example. You trade currencies, but you also want the index context permanently in view. On the Master you switch on two channels:
— Channel 1 ID = CH_FX, with Ch1 Mapping: S1:EURUSD, S2:USDJPY
— Channel 2 ID = CH_IDX, with Ch2 Mapping: S1:USTEC:M5, S2:US500:M5
On each Slave you write two things: the channel it listens on and its slot in that channel's mapping. Two Slaves can share the same Slot ID S1 without clashing, because they listen on different channels:
— Slave A: Channel 1 ID = CH_FX, Slot ID for Mode 2 = S1 → displays EURUSD
— Slave B: Channel 1 ID = CH_IDX, Slot ID for Mode 2 = S1 → displays USTEC on M5
Watch out for one detail. On the Slave, the channel ID goes into the field of the channel you switch on (usually Channel 1), not necessarily into the one carrying the same number as on the Master. What matters is that the ID text is identical to the one on the Master.
When separate channels are worth using:
— when you want one group of charts to follow one map and another group a different map;
— when you have several monitors and each screen has its own role (currencies on one, indices on another);
— when you want to stop a whole group temporarily: untick the channel on the Master and those Slaves stay where they are, without touching the rest.
Group or channel? The group (Group of Charts ID) separates ecosystems that cannot hear each other at all. The channel separates streams inside the same ecosystem, each with its own map. If you want total isolation, use groups. If you want the same Master to drive different sets, use channels.
7. What can be synchronized?
Almost everything. From the settings you can switch each category on or off (it works when it is set identically on the Master and on the Slave):
- Analysis tools — trend lines, horizontal and vertical lines, channels (including regression and standard deviation channels), Andrews' pitchfork and the Gann tools (line, fan, grid)
- Fibonacci — retracements and expansions, fan, arcs, channels, time zones, plus Elliott waves
- Cycles — cycle lines
- Shapes — rectangles, triangles, ellipses
- Marks — arrows, thumbs up/down, buy/sell markers
- Text — plain text and labels
- Navigation — crosshair, zoom level, scroll position
- Subwindow objects — the lines and levels drawn on indicators (RSI, Stochastic and so on) are preserved when you change the timeframe. Very useful when you work with several timeframes and switch between them.
| Do not look for a separate tick box for every tool. The categories above are controlled by the existing tick boxes, grouped logically: |
| Tick box in the settings | What it covers |
|---|---|
| Sync Trendlines | trend lines, channels, regression and standard deviation channels, Andrews' pitchfork, the Gann tools |
| Sync Vertical Lines | vertical lines and cycle lines |
| Sync Fibo & Expansions | all the Fibonacci tools (retracements, expansions, fan, arcs, channels, time zones) and Elliott waves |
| Sync Horizontal Lines | horizontal lines |
| Sync Rectangles… | rectangles, triangles, ellipses |
| Sync Text Objects | text and labels |
| Sync Arrows | arrows, thumbs, buy/sell markers |
8. Settings reference
The names below are exactly the ones you see in the settings window in MetaTrader 5.
Role and group
| Label in MT5 | Default | Description |
|---|---|---|
| Indicator Role | Master | Master (broadcasts) or Slave (follows) |
| Group of Charts ID (Ecosystem) | ECO_1 | The name of the “private room” in which the charts communicate |
Channels
| Label in MT5 | Default | Description |
|---|---|---|
| [ON/OFF] Channel 1 | on | Enables or disables Channel 1 |
| Channel 1 ID | CH_1 | The channel identifier. Identical on the Master and on the Slave. |
| Channels 2–4 | off | Additional channels for segmentation (advanced) |
Master
| Label in MT5 | Default | Description |
|---|---|---|
| Ch1 Mapping | (empty) | The mapping table (Mapping mode). Empty = Simple mode. |
| Ch1 Object Type Filter (Master) | User | Which objects are broadcast: User (manual), Indicator, or both |
Slave
| Label in MT5 | Default | Description |
|---|---|---|
| Slot ID for Mode 2 | (empty) | The slot from the mapping (S1, S2…). Empty = Simple mode. |
| Sync Symbol Ch1 | on | The Slave follows the Master's symbol (Simple mode only) |
| Sync Timeframe (Slave) | on | The Slave follows the Master's timeframe |
| Sync Zoom Level (Slave) | on | The Slave matches the Master's zoom |
| Sync Scroll Position (Slave) | on | The Slave scrolls together with the Master |
Synchronized objects — see section 7 (all on by default).
Visual
| Label in MT5 | Default | Description |
|---|---|---|
| CAMERA & Focus Point (% from Right Margin) | 35 | The focus point used for scroll synchronization |
| Crosshair Color | Magenta | The colour of the synchronized crosshair |
| Crosshair Style | Dot | The line style |
| Crosshair Width | 1 | The line thickness (pixels) |
| Crosshair in Background | off | Draws the crosshair behind the candles |
Performance (the default values are the recommended ones)
| Label in MT5 | Default | Description |
|---|---|---|
| Crosshair Refresh Rate (ms) [Both] | 30 | How often the crosshair is refreshed. Lower = smoother. |
| Scroll Refresh Rate (ms) [Master] | 100 | The rate at which the Master sends the screen position |
| Max Objects at Full Sync, 0=All [Master] | 0 | Maximum number of objects in a full sync (0 = no limit) |
| Don't sync these prefixes [Both] | (empty) | Prefixes to exclude — objects created by other indicators that you do NOT want synchronized (for example “MA_”, “Pivot_”) |
| Init Delay before PING (ms) [Slave] | 100 | Delay before the initial sync request |
| Delay after Symbol Change (ms) [Master] | 500 | Delay after a symbol change |
9. Troubleshooting
The symbol does not appear on the Slave, or the mapping seems not to work. Check whether the instrument is enabled in Market Watch — the instrument list on the right-hand side of the terminal. MetaTrader 5 can switch a chart only to a symbol that is already active there. If the symbol is missing from that list, synchronization and mapping cannot happen, no matter how correctly you wrote the rule.
How to enable it: right click in Market Watch → Symbols (or Ctrl+U) → find the instrument → add it to the list. Make sure all the instruments you want to synchronize are active, including the ones written in the mapping.
The Slave does not follow the Master at all.
- Check that Group of Charts ID and Channel 1 ID are written identically, letter by letter ( ECO_1 is not the same as eco_1 ).
- Did you click on the Master chart? The Master has to have focus in order to broadcast.
I drew on the Slave and it does not appear on the Master. That is normal — information travels in one direction only, from Master to Slave. Always draw on the Master.
I cannot see the crosshair on the Slave. Check that Sync Crosshair is on for the Slave and press the mouse wheel on the Master.
Scrolling does not synchronize. Make sure the “Scroll the chart to the end on tick incoming” button is enabled on the charts, in the MT5 toolbar at the top.
Chaotic behaviour or duplicated signal. Check that you do not have two ChartSync Pro indicators on the same chart — they conflict with each other. Keep exactly one on each chart.
In Mapping mode the Slave does not change its symbol. Check that: (a) the value in Slot ID for Mode 2 on the Slave appears exactly as written in the rule in Ch1 Mapping on the Master (for example S1 ); (b) the symbol in the mapping is written exactly as at your broker (suffixes and prefixes included).
10. Help and contact
Do you have a question, some feedback, or would you like an extended trial? Write to us — we answer.
- AXOM Labs — MQL5 profile: https://www.mql5.com/en/users/8002589
- If ChartSync Pro has improved your workflow, a review on the MQL5 Market helps us enormously to keep developing it.
When the trial expires, move to Pro straight from the Market page. Thank you for trying ChartSync Pro!
| AXOM Labs · ChartSync Pro for MetaTrader 5 |