
XAUUSD New York Session Plan — 13 Nov 2026 | Will the Week's Low Break Before the Weekend?

Gold is trading at 3,885 an hour into the New York session. US PPI came in soft, and gold spiked $26 to 3,906, but the spike stalled at the same ceiling that has capped price since late Asia, and the drop that followed took it back under the London low, to 3,873.
I'm not selling at 3,885. I'll wait for an M15 close below the 3,870 floor and sell the retest, or sell a bounce back into 3,902–3,906.
H4 | Below all three SMAs, near this week's lows
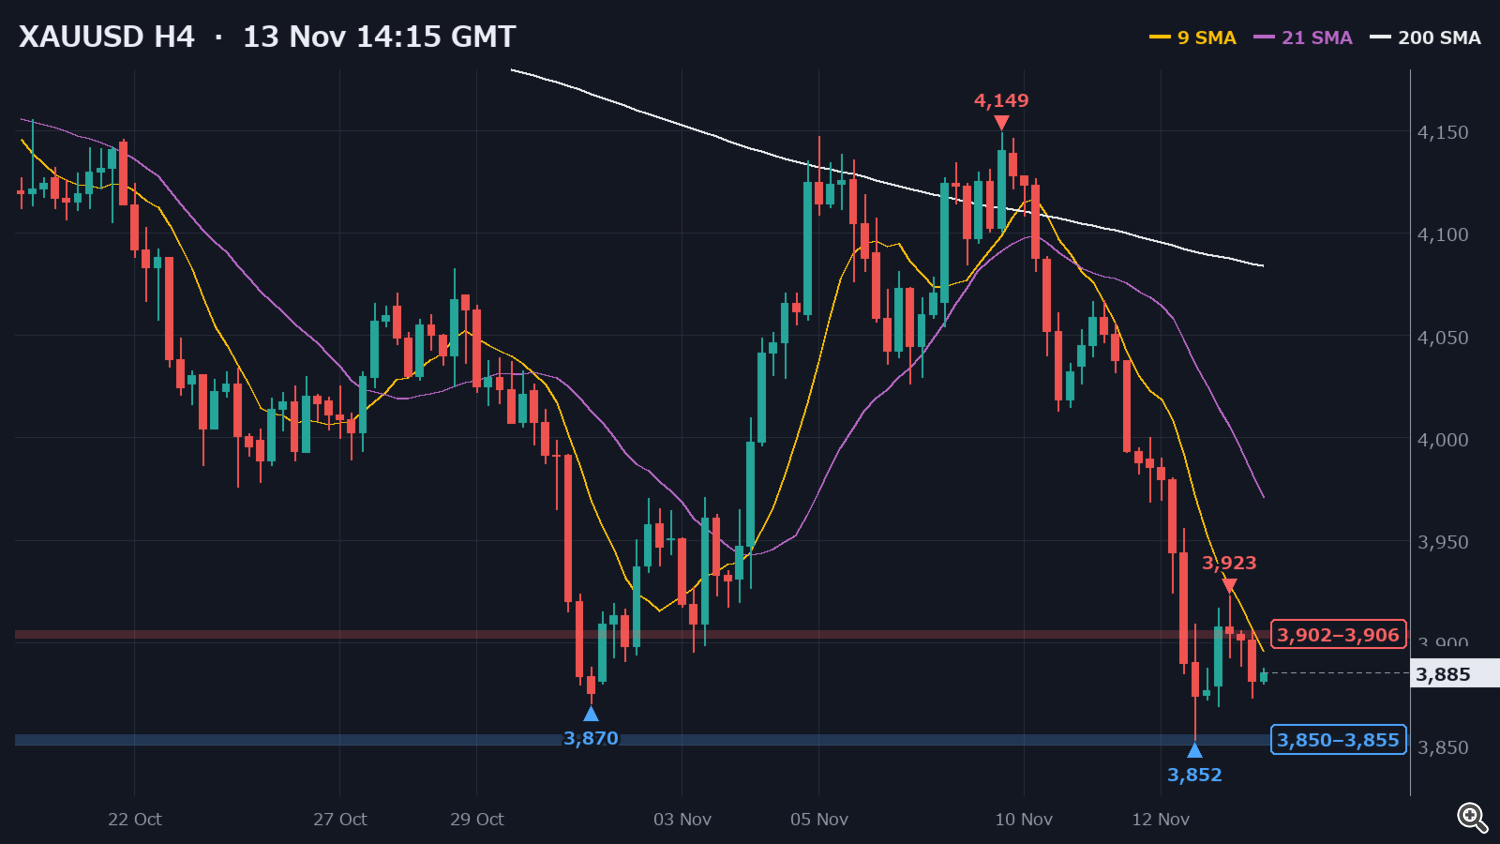
9 SMA: 3,896 · 21 SMA: 3,971 · 200 SMA: 4,084
Gold topped at 4,149 on 9 Nov and has fallen for most of the week. Yesterday's New York session took it below the 30 Oct low of 3,870, down to 3,852, the lowest price since early October 2025.
Asia bounced to 3,923, but that rally has faded ever since. The 9 SMA is $75 under the 21 SMA. On H4 this is still a clean downtrend.
▲ Resistance: 3,886–3,893 (the London low and the flat H1 SMAs), then 3,902–3,906 (today's ceiling)
▼ Support: 3,870–3,875 (the floor under yesterday's late session and Asia), then 3,852 (this week's low)
H1 | Asia's bounce faded into a range, and New York broke it
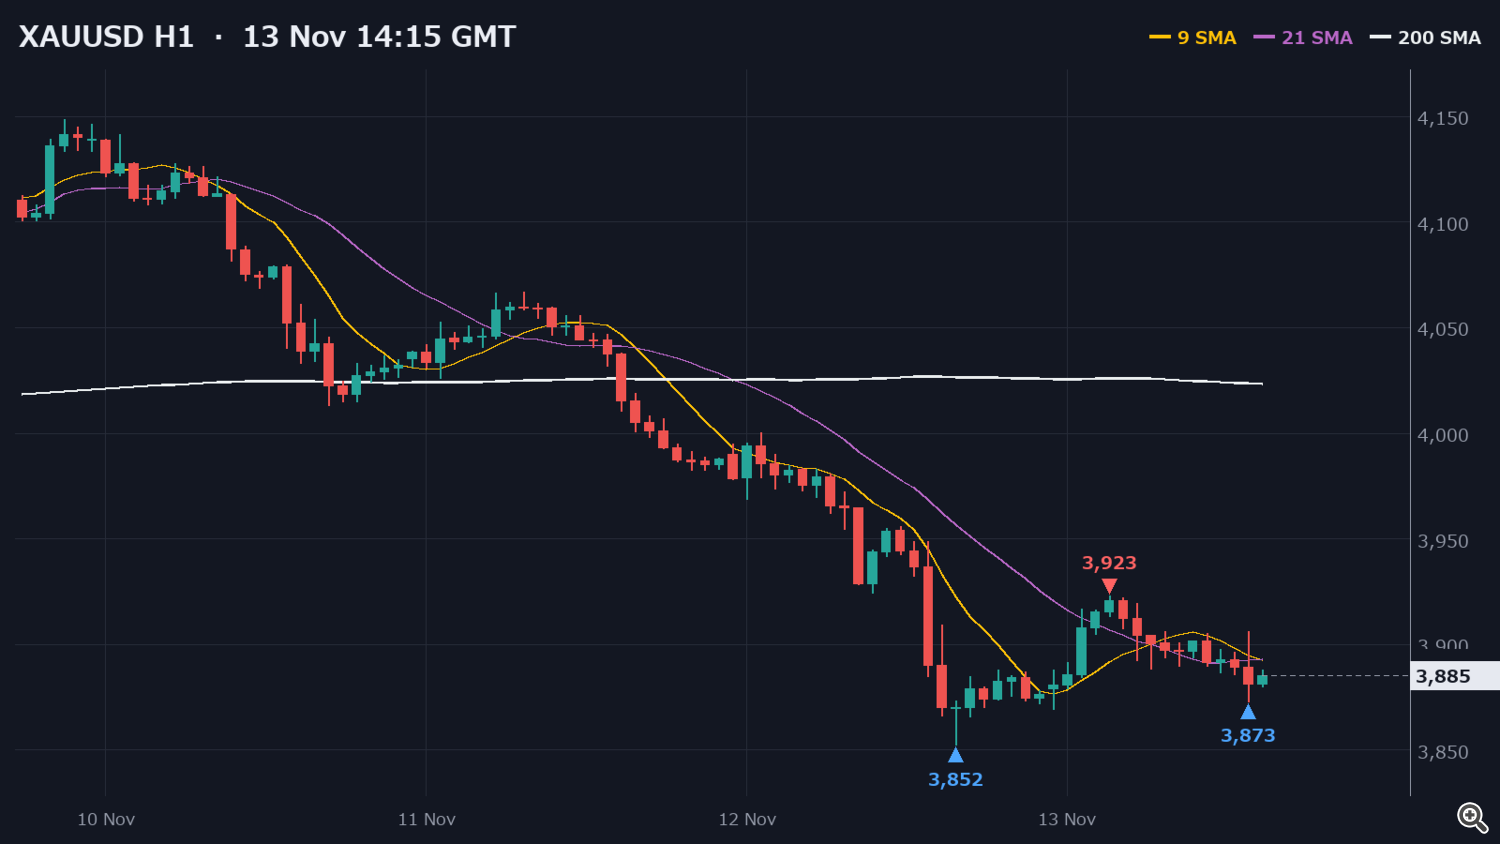
9 SMA: 3,893 · 21 SMA: 3,893 · 200 SMA: 4,023
After yesterday's 3,852 low on the 15:00 GMT candle, gold spent the rest of the session between 3,865 and 3,888. Asia broke out of that box on the 01:00 candle and ran up to 3,923 at 03:00. The next two candles made lower highs at 3,922 and 3,920, and the 05:00 candle dropped to 3,892.
From 06:00 to 12:00, gold went sideways between 3,886 and 3,906. The H1 9 and 21 SMAs have gone flat at 3,893, right inside that range, and price is now under both. The 13:00 candle shows the whole move: a wick to 3,906, a low of 3,873, then a close at 3,881, below the London low.
M15 | Four rejections at 3,906
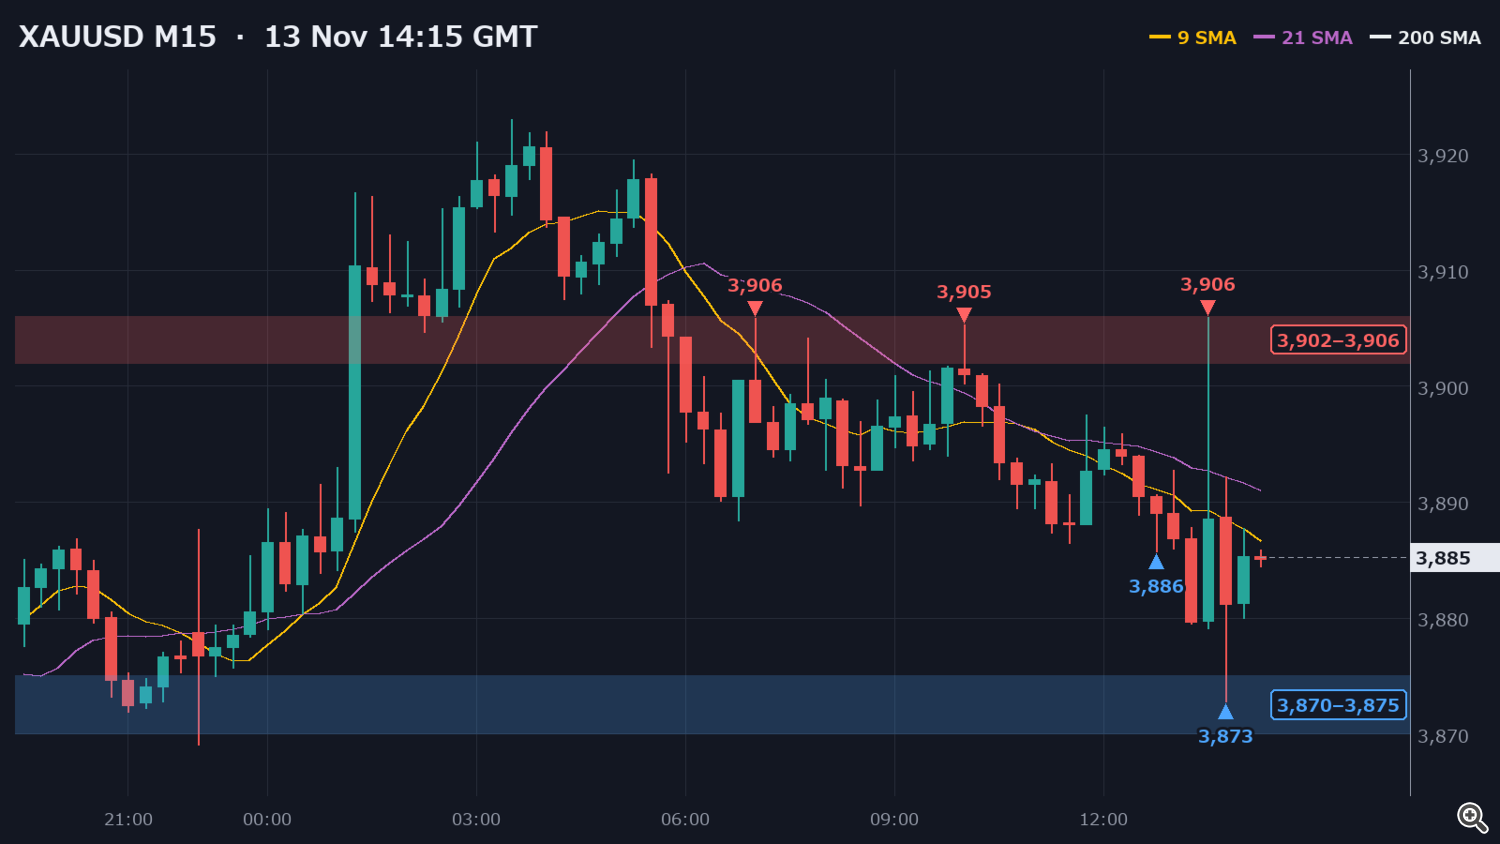
9 SMA: 3,887 · 21 SMA: 3,891 · 200 SMA: 3,940
The top of the range since late Asia is a clean ceiling. On M5, price stalled at 3,905–3,906 at 05:55 GMT, at the European open at 07:00, again at 10:05, and on the PPI spike at 13:30. Each time it was sold.
The bottom of the range was the London low at 3,886. New York broke it before the data, and the post-PPI drop extended to 3,873. That is right on the floor where gold held from 17:00 GMT yesterday until the Asian rally began.
M5 | A failed spike, then a lower close
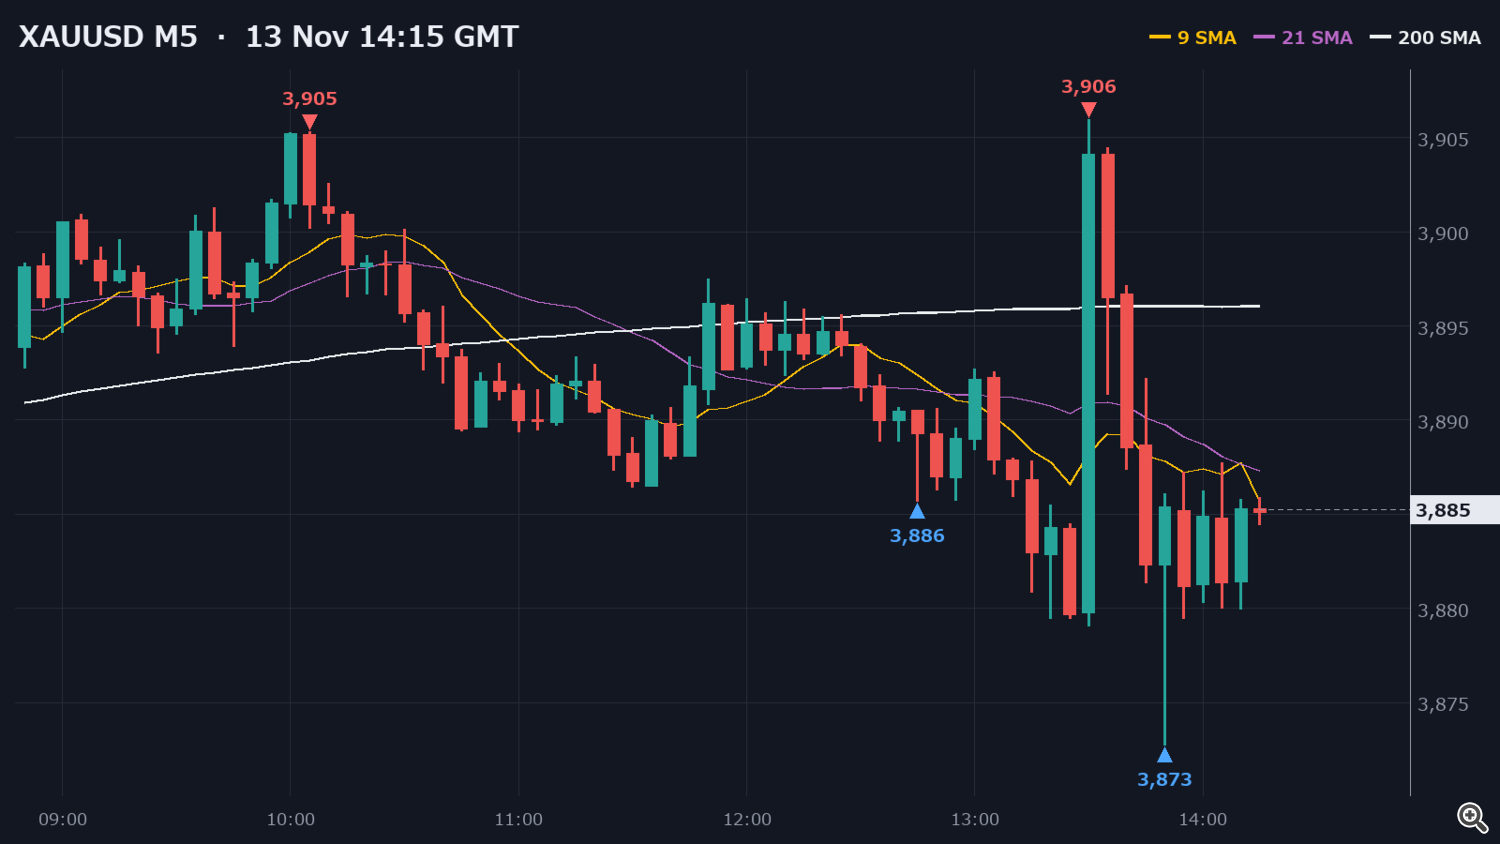
9 SMA: 3,886 · 21 SMA: 3,887 · 200 SMA: 3,896
The 13:30 candle opened at 3,880, spiked to 3,906 and closed at 3,904. The next four candles gave all of it back, and the 13:50 candle printed the low at 3,873.
The bounce from there reached 3,888 and has stalled at the London low. The M5 9 and 21 SMAs sit at 3,886–3,887, right on top of it. Price is stuck between the London low above and the floor below, so I'm not trading the middle.
After the PPI
PPI m/m came in at 0.3% vs 0.4% expected (prior 1.3%).
Gold was at 3,880 just before the release and jumped $26 to 3,906 inside the first five minutes. Thirty minutes after the release, it was back at 3,881 after a low of 3,873.
A soft PPI tends to pull yields lower, and that usually helps gold. Gold got the pop, but it stalled at the ceiling that had already held three times today and gave it all back. When gold sells off on a print that should help it, I take that as a sign the sellers are still in control. As long as price stays under 3,906, I'm favoring sells.
Today's Events (GMT)
- 15:50 — Fed's Bowman speaks
- 18:00 — Baker Hughes rig counts
I won't open a new trade in the five minutes either side of 15:50. It's Friday, so I want to be flat before the New York close.
What the Past Says
- Since November 2025, there have been 45 days when gold was still below the London low an hour into the New York session. On 87% of them, New York went on to make a new session low, and the median extension was $19. From today's 3,873, that points to the 3,852–3,855 area, right at this week's low.
- On those same 45 days, price traded back up to the London low 67% of the time, but only 24% made it back to the London high. A bounce to 3,886 is normal. A run back to 3,906 is the less likely path, which is why I keep 3,906 as my flip level.
- The 3,870–3,875 floor has been tested seven times since 1 October. Price came in from above six times, and it held on five of them. That is a small sample, but it's why I won't sell into the floor. I need a close below it first.
- Since August, the median New York session range is $54 (75 days). New York's range so far is 3,873–3,906, or $33, so there is still room for another leg.
Entry Plans
My view: down. Price is under every H1 and H4 SMA, and a soft print could not lift it through 3,906.
Flip level: 3,906. A full-bodied M15 close above it means the sellers have lost today's ceiling, and I switch to the buy side.
Main view plans
Plan 1 (main): Sell the retest of the 3,870 floor at 3,868–3,872
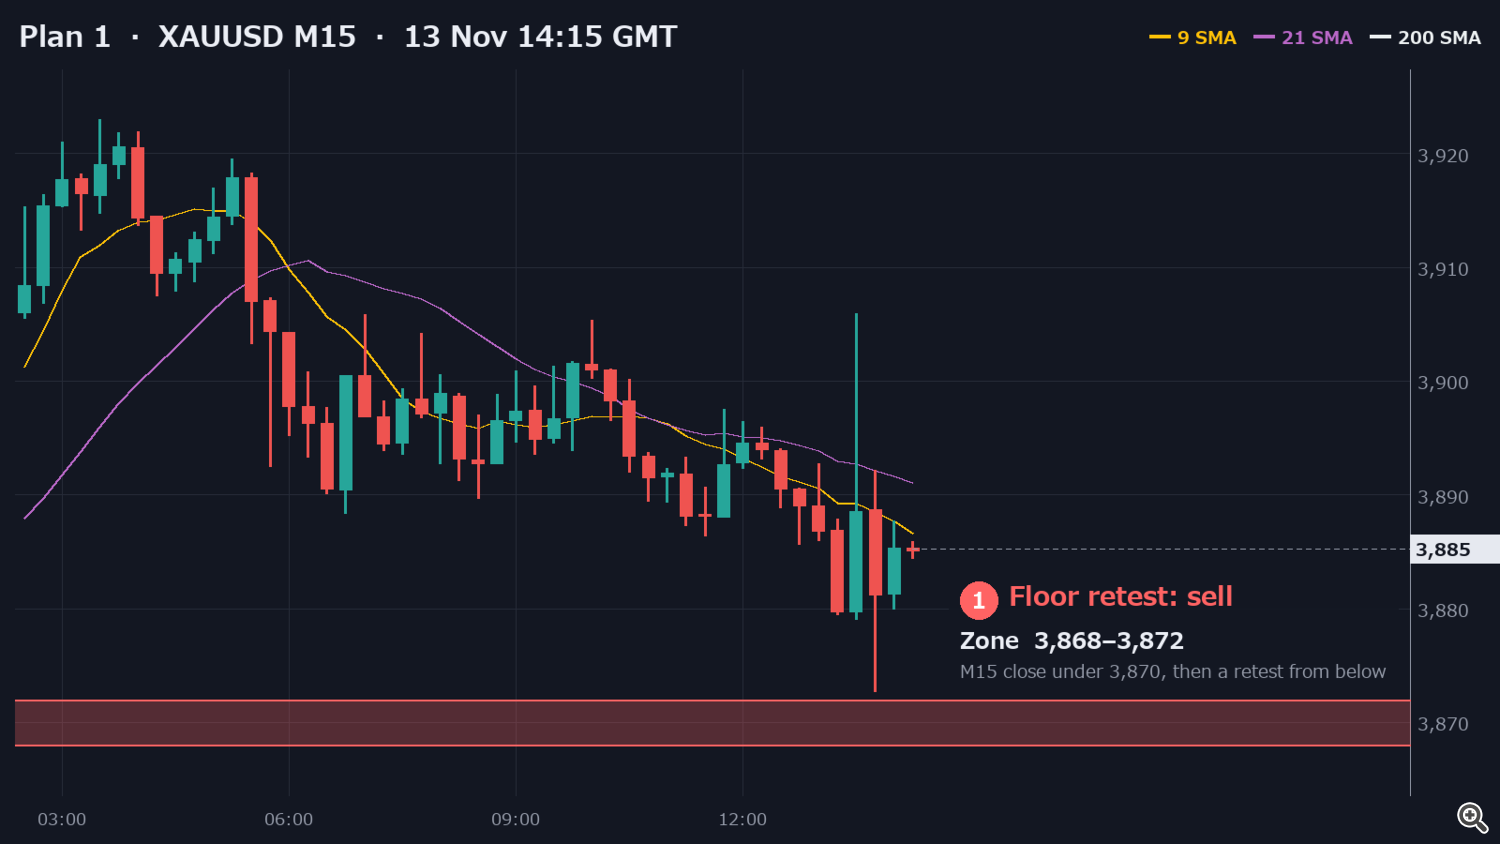
This is the floor that held yesterday's late session and the Asian open, with the 30 Oct low at 3,870. If New York pushes through it, I won't sell the breakdown candle. I need a full-bodied M15 close below 3,870, then a retest of the zone from below that gets rejected with an upper wick. I'm aiming for 3,860 first, then this week's low at 3,852, then 3,838, the 3 Oct 2025 low.
- Entry: 3,870
- SL: 3,880
- TP1: 3,860
- TP2: 3,852
- TP3: 3,838
Plan 2: Sell the 3,906 ceiling at 3,902–3,906
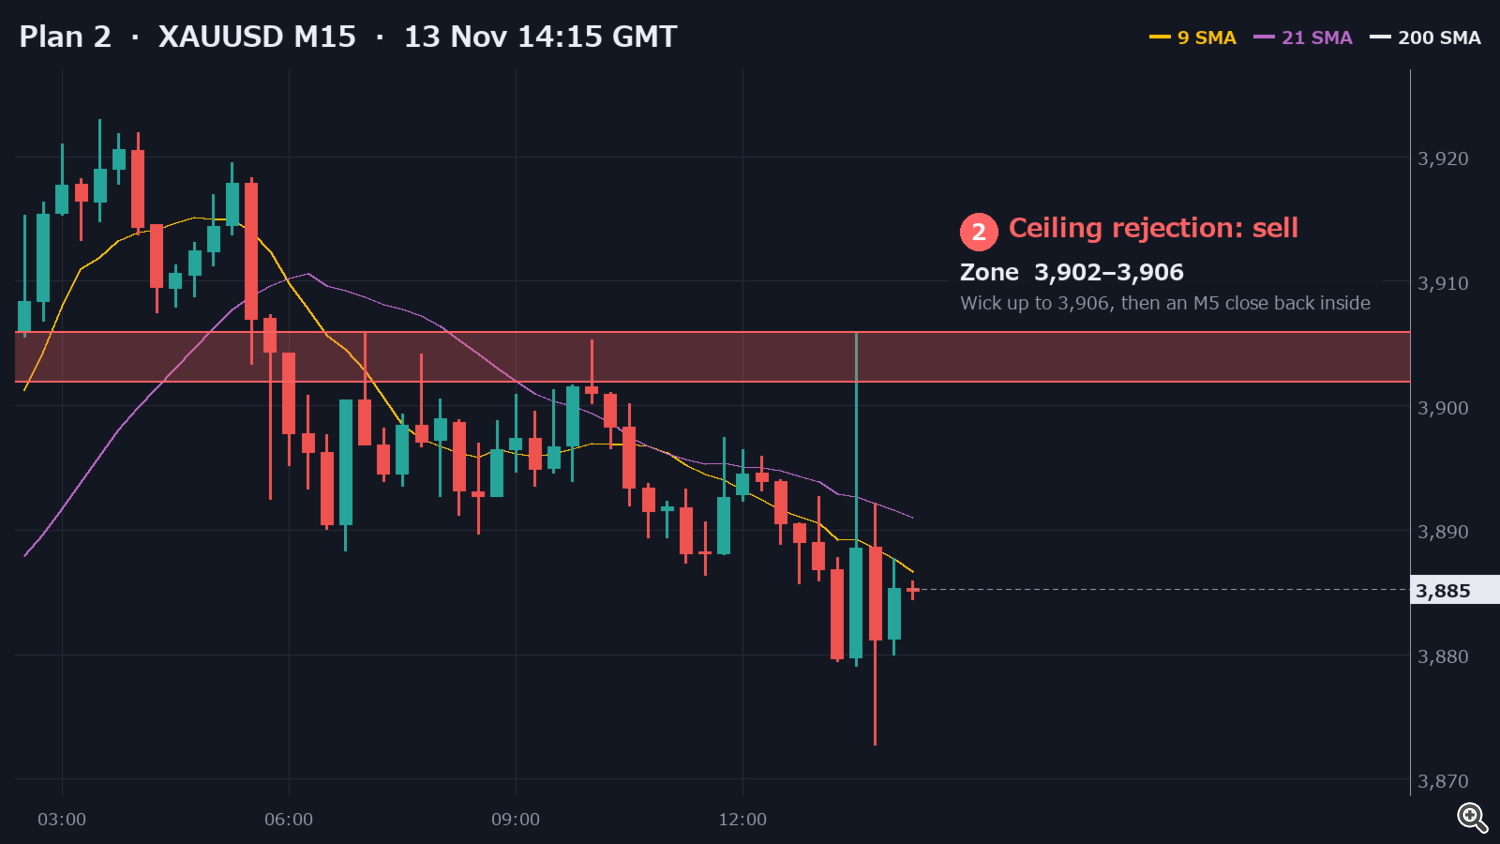
If New York first bounces back above the London low and works up through the range, I'll sell the ceiling that has rejected price four times today. I want an M5 candle to wick up to 3,906 and close back inside the zone. A wick a dollar or two above 3,906 is fine.
- Entry: 3,904
- SL: 3,912
- TP1: 3,890
- TP2: 3,875
- TP3: 3,852
If the View Flips
Plan 3: Buy the sweep of the week's low at 3,850–3,855
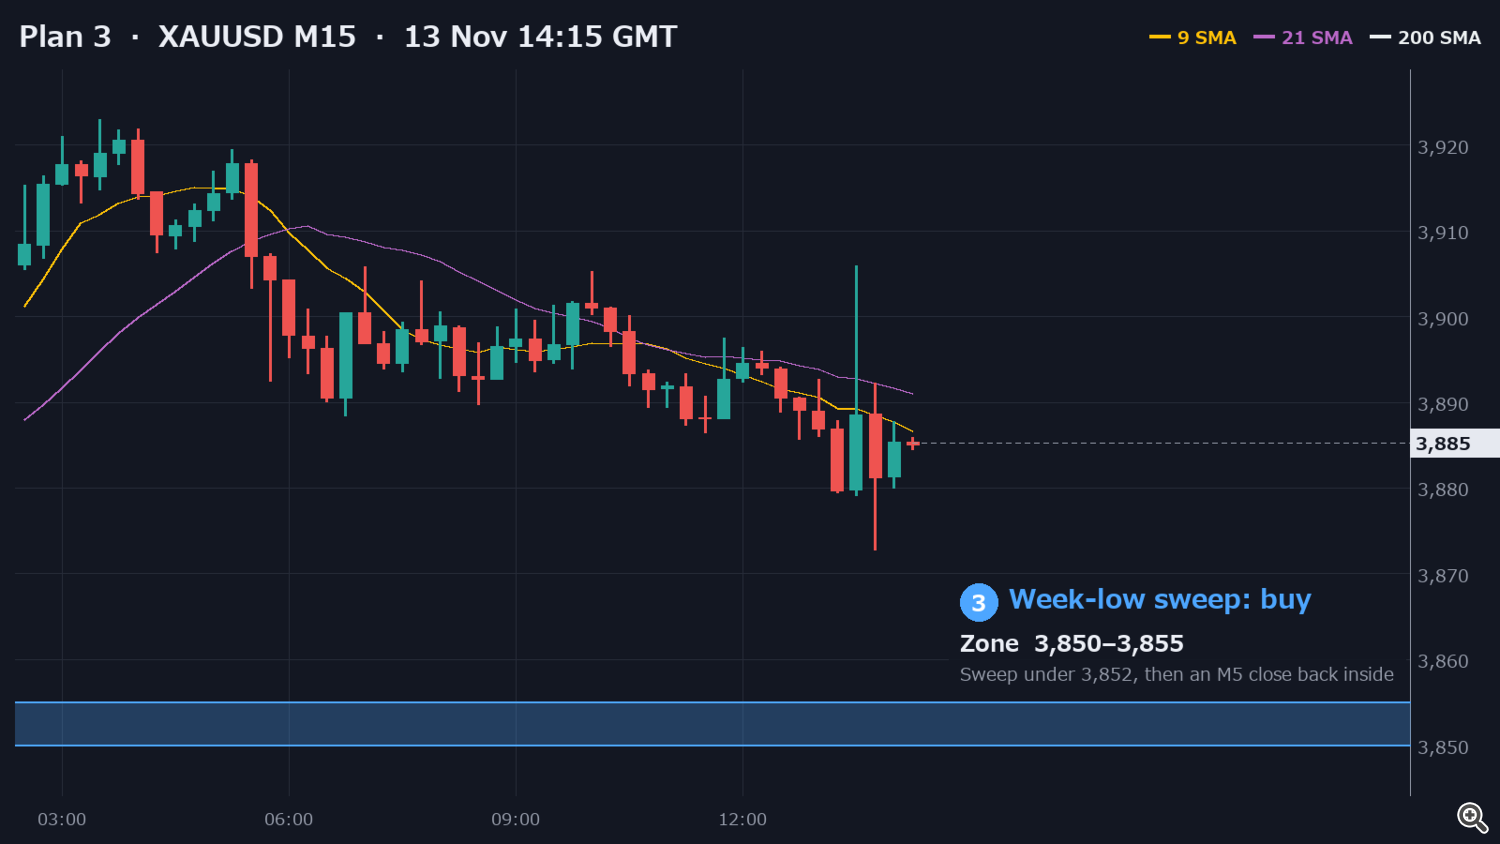
If Plan 1 plays out and price reaches this week's low, I'll watch for the flush to fail. I want price to sweep below 3,852 and an M5 candle to close back inside the zone with a long lower wick. That would be a failed breakdown at the week's low, and I'd buy for a move back to the floor, the London low and 3,906.
- Entry: 3,853
- SL: 3,843
- TP1: 3,870
- TP2: 3,886
- TP3: 3,906
Plan 4: Buy the retest of the 3,906 ceiling at 3,902–3,906
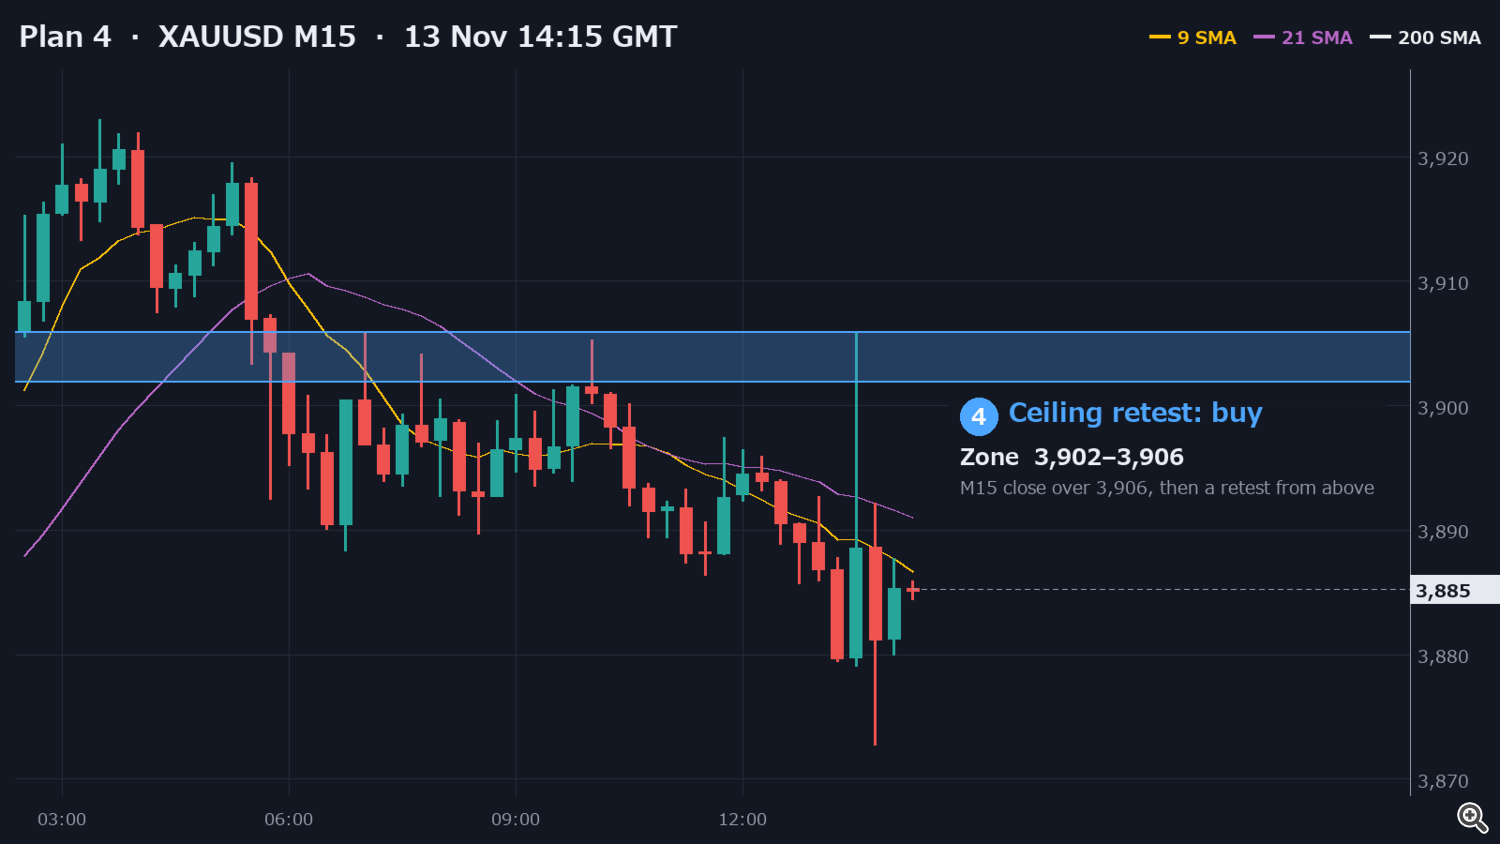
A full-bodied M15 close above 3,906 would break the level that held four times today. I'll wait for price to retest 3,902–3,906 from above and hold it with a lower wick, then buy. The targets are the 3,920 lower high from 05:00 GMT, the 3,923 Asian high, and the M15 200 SMA at 3,940.
- Entry: 3,904
- SL: 3,895
- TP1: 3,920
- TP2: 3,923
- TP3: 3,940
Summary
My main plan is to sell a retest of 3,868–3,872 after an M15 close below the floor, aiming for this week's low at 3,852. If New York bounces first, I'll sell the 3,906 ceiling instead. I switch to buying only on a sweep and reclaim of 3,852, or on an M15 close above 3,906.
Levels I'm watching:
- 3,902–3,906: today's ceiling, sell a rejection or buy the retest after an M15 close above 3,906
- 3,886–3,893: the London low and the flat H1 SMAs
- 3,870–3,875: the floor, sell the retest after an M15 close below 3,870
- 3,852: this week's low, buy a sweep and reclaim
Gold Plans on My Channel
I post my zones for the Asian, London and New York sessions on my channel, plus a recap of the previous day.
Join here: https://www.mql5.com/en/channels/kizami-gold
My Tools
- KIZAMI — https://www.mql5.com/en/market/product/203530
- SADAME — https://www.mql5.com/en/market/product/203655
- Tsurugi Gold EA — https://www.mql5.com/en/market/product/207107
- Nagi AudCad EA — https://www.mql5.com/en/market/product/208101
Trading involves risk. This is my own plan, not a recommendation.




