JET Volume Flow and JET Volume Flow PRO: buying and selling volume flow on your MetaTrader 5 chart

JET Volume Flow is a new indicator for MetaTrader 5 that shows whether the recent volume is going into rising or into falling bars. It comes in two editions: JET Volume Flow, free, with the flow line, the green and red histogram and the signal line, and JET Volume Flow PRO, which adds arrows, alerts, other timeframes, a state panel and data for Experts.
How it works
JET Volume Flow shows, in a separate window, how much of the recent volume went into rising bars and how much into falling bars. Above zero, the flow is buying (green histogram); below zero, it is selling (red histogram). Very small price moves are ignored and unusually large volume spikes are capped, so a single bar does not dominate the reading.
The flow is evaluated on the closed bar and does not repaint: in the Strategy Tester, the values of closed bars never changed. It is an indicator only: it never opens, closes or changes orders.
Free or PRO?
| Free | PRO | |
|---|---|---|
| Flow line with green and red histogram | yes | yes |
| Signal line and zero line | yes | yes |
| Editable parameters, real or tick volume | yes | yes |
| Arrows on the main chart (and in the subwindow) | — | yes |
| Signal type: zero line, signal line or both | — | yes |
| Calculation on a higher timeframe | — | yes |
| State panel with 4 timeframes | — | yes |
| Dark / light theme, interface in 11 languages | — | yes |
| Alerts: popup, sound, push notification, e-mail | — | yes |
| Data for Experts (iCustom) | — | yes |
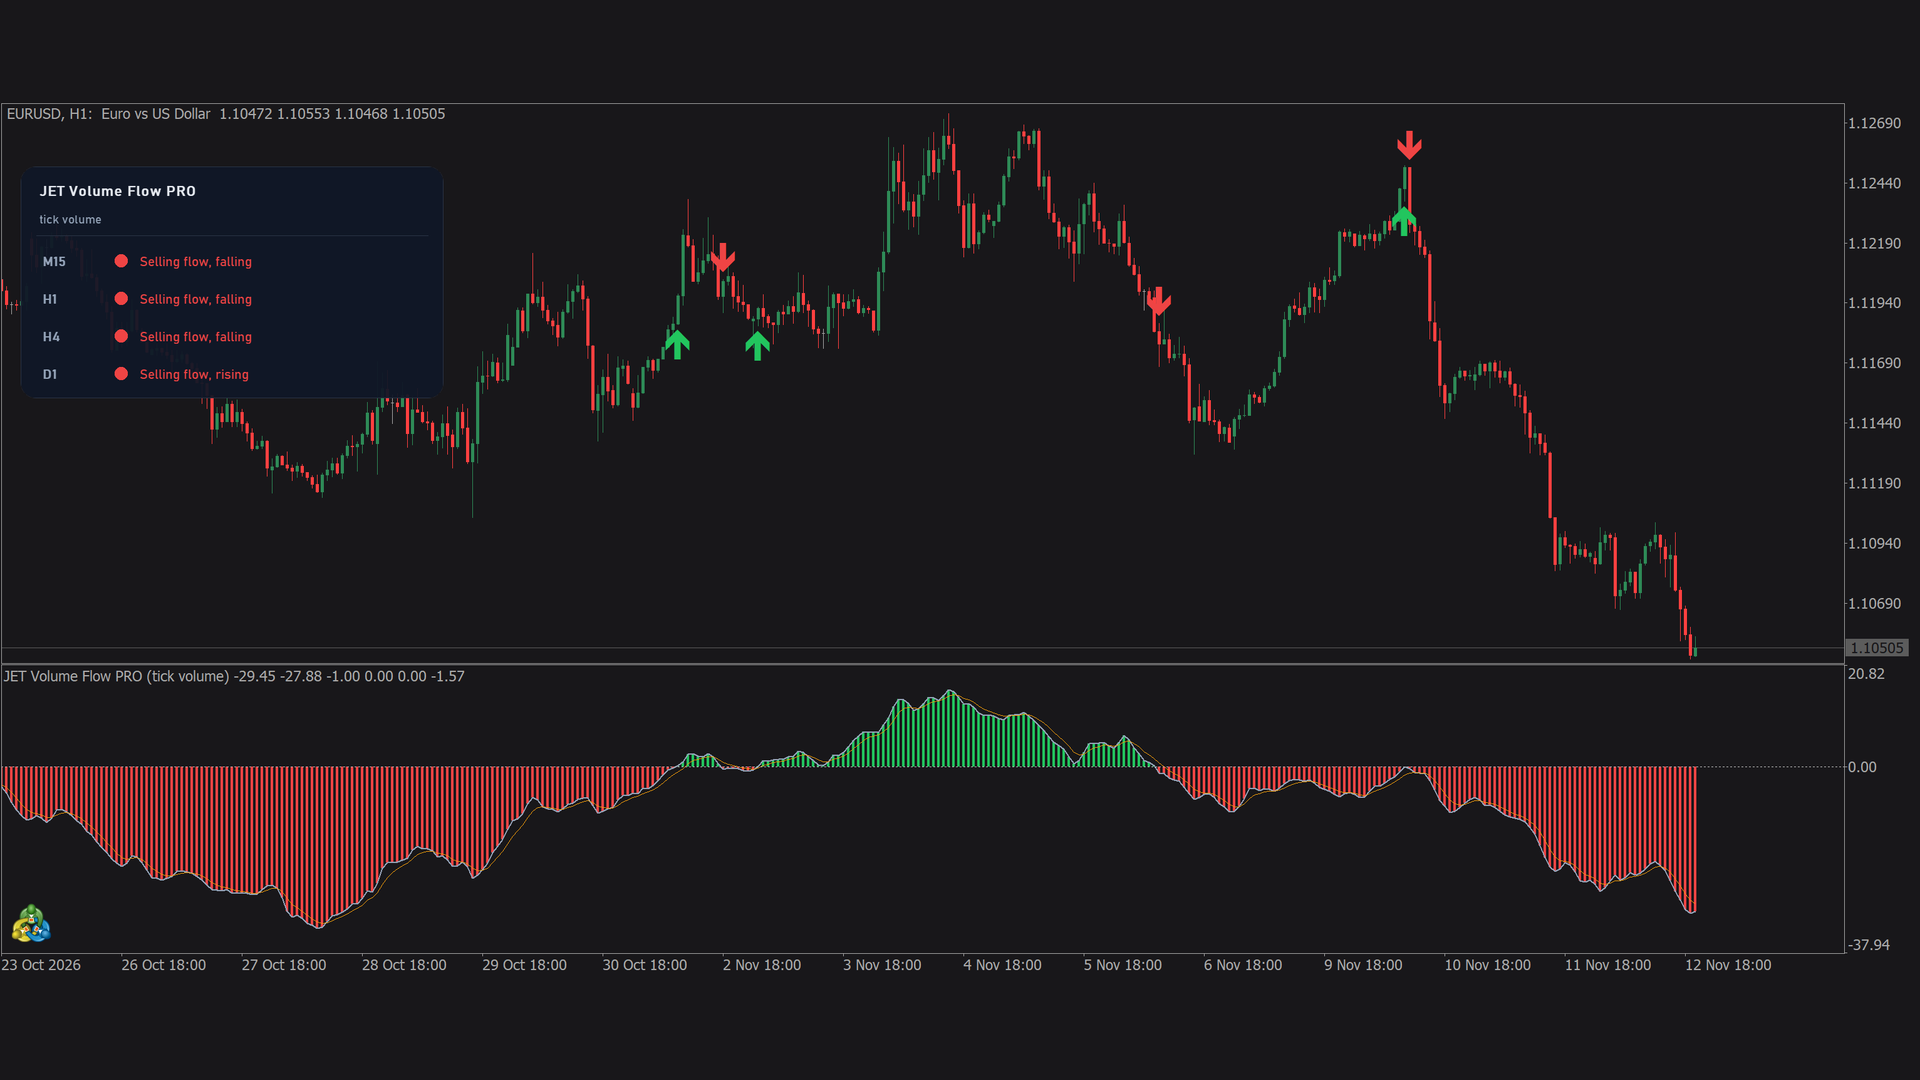
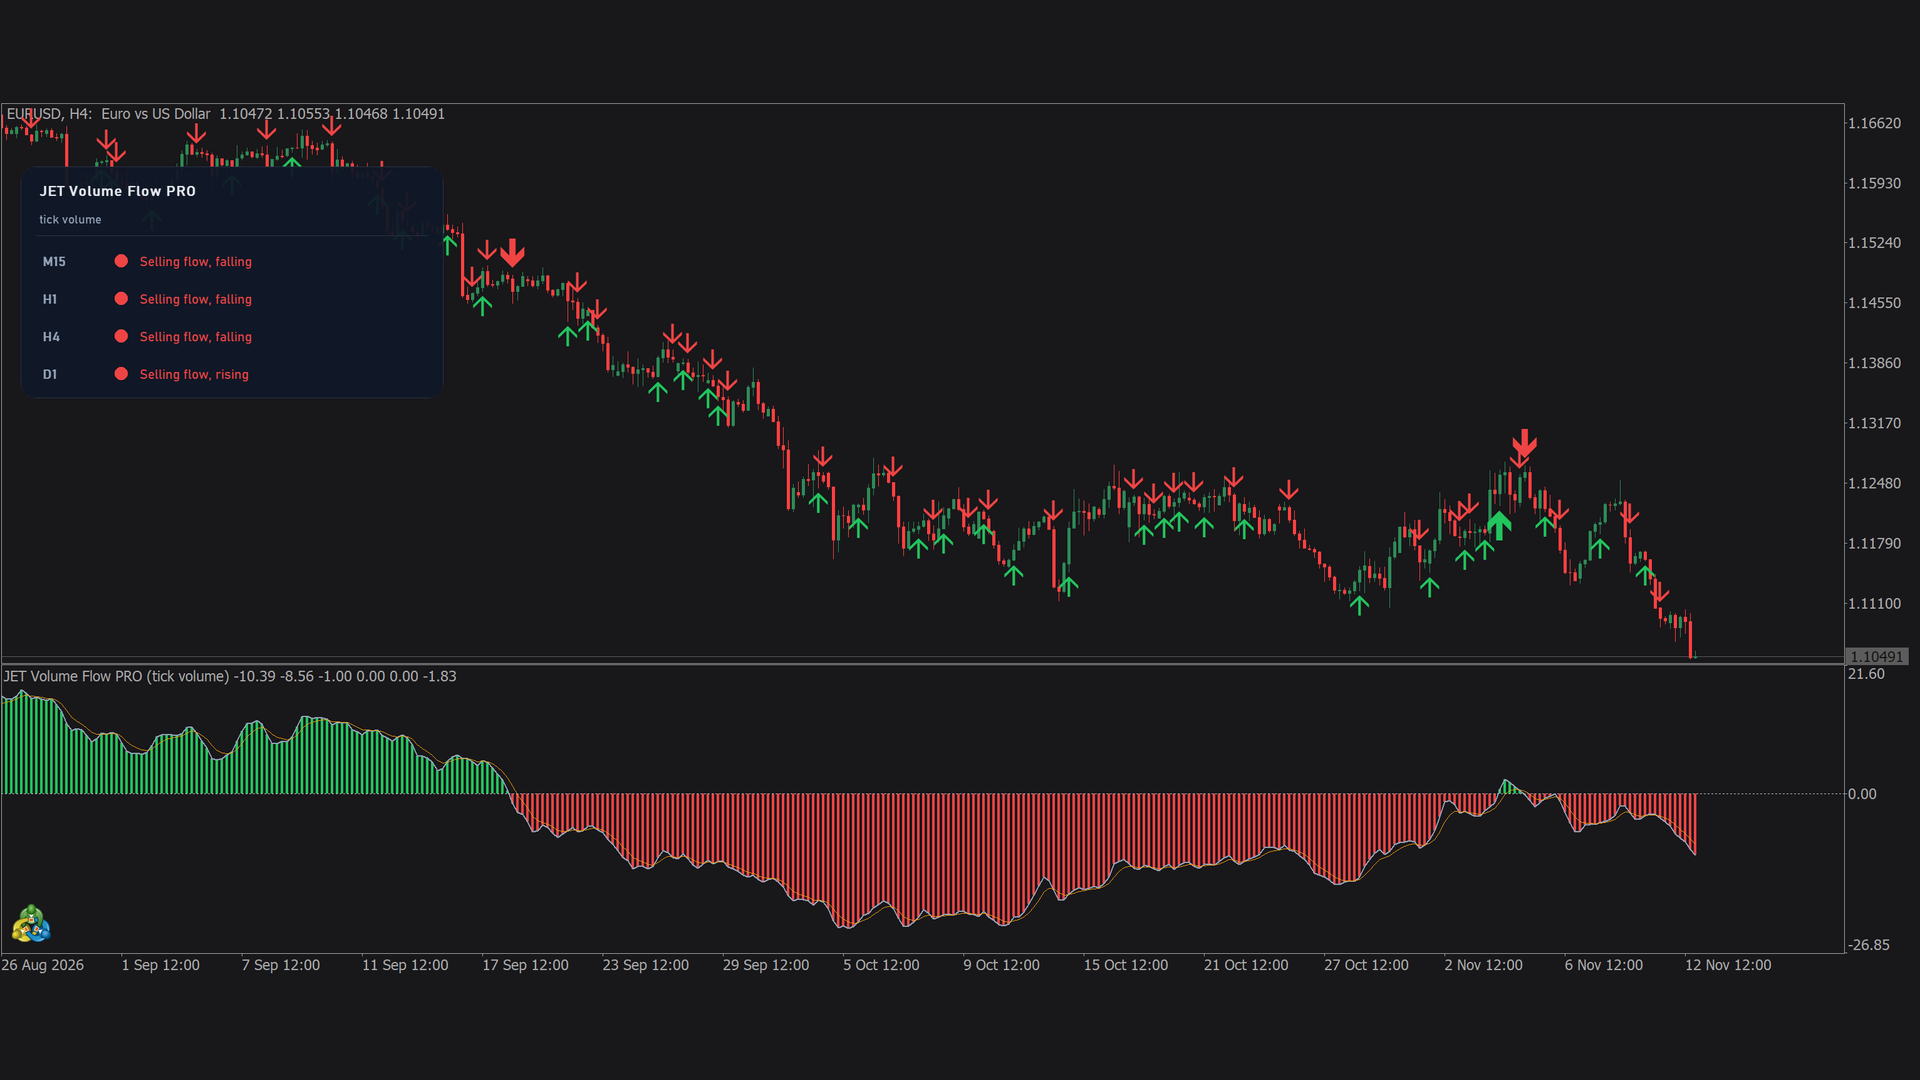
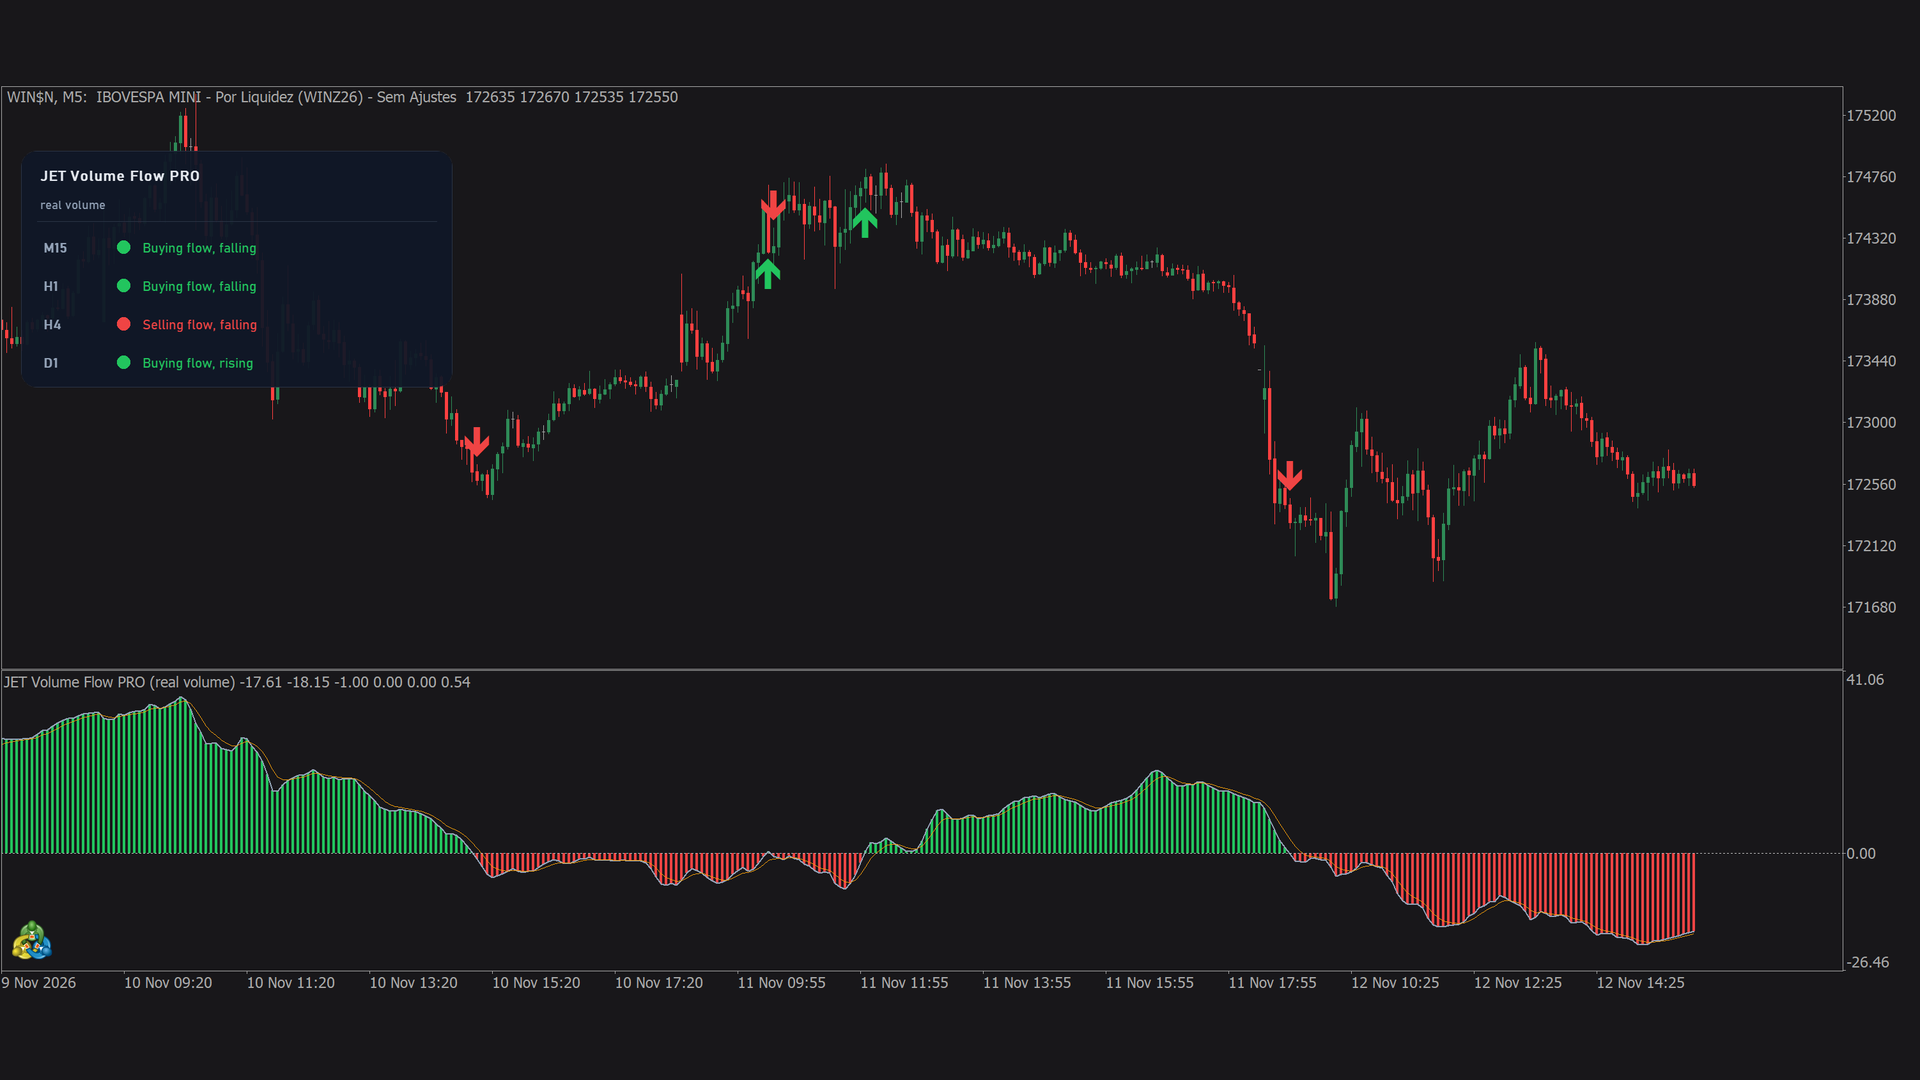
JET Volume Flow PRO shows, in a separate window, how much of the recent volume went into rising bars and how much into falling bars. Above zero, the flow is buying (green histogram); below zero, it is selling (red histogram). Very small price moves are ignored and unusually large volume spikes are capped, so a single bar does not dominate the reading. A signal line follows the flow, and the indicator marks on the chart when the flow turns to buying or selling, or crosses its signal line.
- Flow line with a histogram: green for buying flow, red for selling flow.
- Signal line (orange) and zero line.
- Arrows on the main chart (default): green below the bar when the flow turns to buying, red above the bar when it turns to selling; smaller arrows for signal line crossings. Option: show them also in the subwindow.
- Signals: zero line crossing (default), signal line crossing, or both.
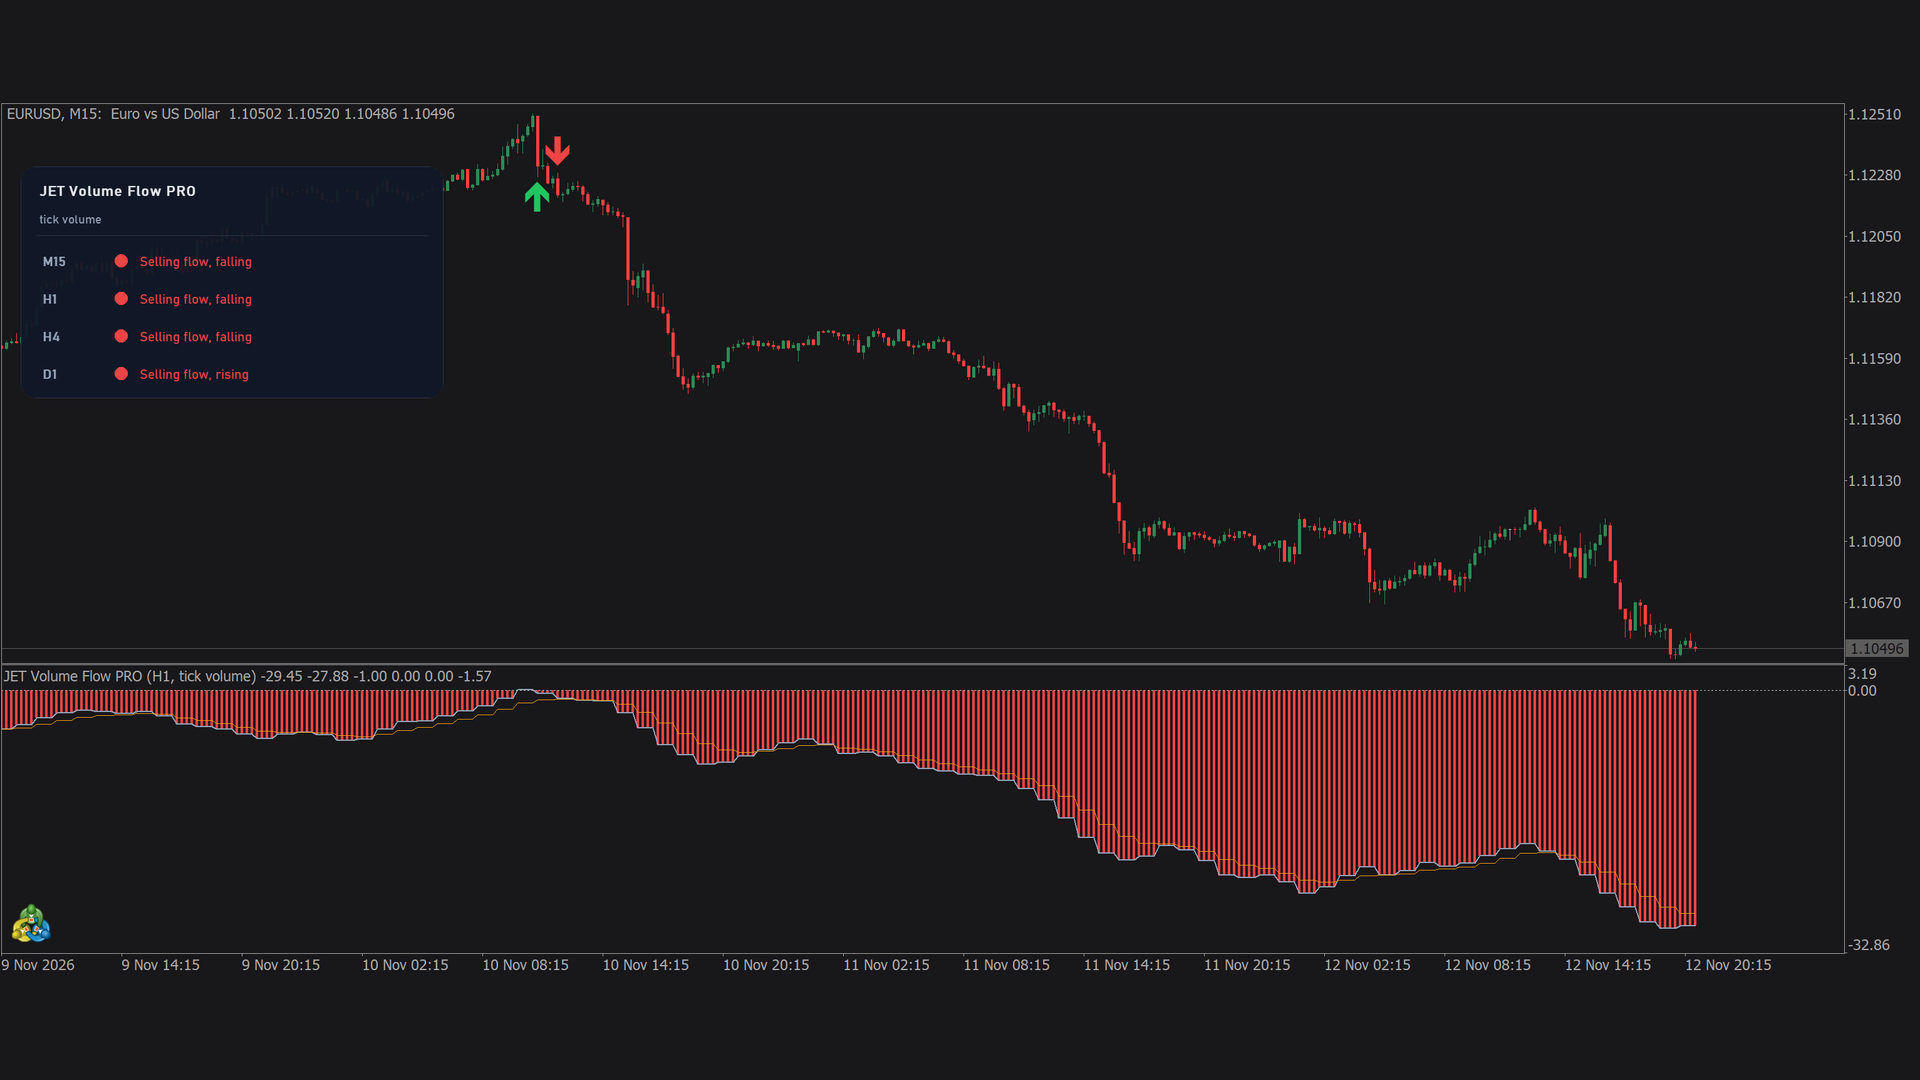
- State panel with 4 timeframes (M15, H1, H4 and D1 by default): Buying flow or Selling flow, rising or falling, and the volume in use. You can drag it anywhere on the chart.
Real or tick volume
- Automatic (default): uses real exchange volume when the broker sends it, as on B3 futures and stocks; otherwise tick volume, as on forex and CFDs.
- Or choose Real volume or Tick volume yourself. The volume in use is shown in the window title and on the panel.
Settings and timeframes
- Editable period, minimum price move, volume cut, smoothing and signal line.
- Calculation on a higher timeframe (for example H1 on an M5 chart).
- Editable colors; 5,000 bars calculated by default, and only the current bar on each tick.
Alerts on the closed bar
- Flow turned to buying, flow turned to selling, flow crossed above its signal and flow crossed below its signal, each with its own mode: popup, sound, push notification or a combination; e-mail optional.
- By default, only the alerts for the turns to buying and to selling are on.
Data for Experts (iCustom)
- Buffer 0: volume flow (positive = buying, negative = selling)
- Buffer 1: signal line
- Buffer 2: flow state (1 = buying, -1 = selling, 0 = no data)
- Buffer 3: zero line crossing (1 = turned to buying, -1 = turned to selling, 0 = none)
- Buffer 4: signal line crossing (1 = upwards, -1 = downwards, 0 = none)
- Buffer 5: difference between the flow and the signal line
- Signals are valid on closed bars (index ≥ 1); bar 0 updates with each tick.
- With a higher timeframe, the values are those of that timeframe, mapped to the chart bars.
Works on any symbol and timeframe
- Forex, indices, stocks, metals and futures such as the B3 mini index, with any broker.
- Tested on WIN (real volume), EURUSD and US500 (tick volume).
Download
- JET Volume Flow — free flow line with histogram and signal line, with the choice of volume.
- JET Volume Flow PRO — all the features above.
Questions and suggestions: send me a private message through my MQL5 profile.
Trading involves risk of loss. Volume flow is a reading of past volume, not a forecast: price can move against the flow after a signal. The indicator does not guarantee results.