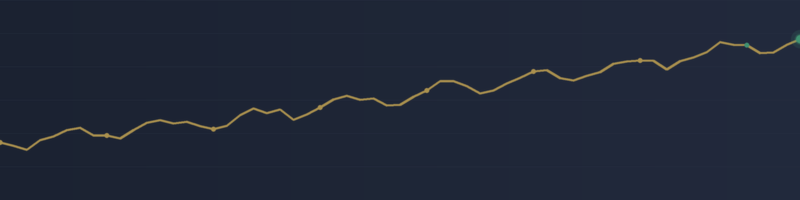
What I Learned Backtesting a Gold Dashboard Honestly (Including Everything That Didn't Work)

-
Most indicator listings show you a chart with a big green profit number and call it proof. I want to try something different: walk through the actual validation process behind SmartTrader AI Pro, including the parts that failed, because I think that's more useful to you than another cherry-picked equity curve — and honestly, it's the only way I'd trust a tool like this myself.
The starting point
The idea was simple enough: combine EMA alignment, RSI, MACD, ADX, and tick-volume into a single weighted score for XAUUSD, with a dashboard showing the reasoning behind it rather than a black-box arrow. Standard stuff. The interesting part started once I actually tested it against real history instead of assuming it would work because the logic sounded reasonable.
Finding #1: my thresholds were wrong, and I didn't know it until I checked
The scoring model was designed so 90+ meant Strong Buy and below 25 meant Strong Sell — a clean, symmetric 0-100 scale. Except when I ran it against 20 years of real XAUUSD daily data, the score never once dropped below 28. Not "rarely" — never, across two full decades. The Sell and Strong Sell categories were mathematically dead on arrival.
The fix wasn't to change the model — it was to stop assuming the score naturally spans 0-100 and instead calibrate thresholds from the actual observed distribution for each symbol and timeframe. Obvious in hindsight. Completely invisible until I actually plotted the data.
Finding #2: H1 has a real edge — but it's regime-dependent, and I almost missed that
Testing the H1 configuration against roughly a year of real ticks, I found a statistically meaningful relationship between the score and subsequent price movement. Good news. Then I split that same year into five smaller windows and checked each one independently.
Three windows: solidly positive. One window — the most recent stretch — was clearly negative. Same model, same weights, wildly different outcomes depending on the period. When I later ran this through Strategy Tester with real spread and execution, the full-year result came back barely break-even, dragged down entirely by that one bad stretch. A single aggregate backtest number would have completely hidden this. You have to look at sub-periods, not just the headline statistic, or you'll fool yourself into overconfidence.
Finding #3: M1 behaves in the opposite direction from every higher timeframe
This one genuinely surprised me. On M1, the classic trend-following readings — EMA alignment, RSI, ADX — showed a real, statistically consistent relationship with subsequent price movement, but backwards. High short-term momentum reliably preceded a pullback, not a continuation, while the higher-timeframe trend signal stayed correctly aligned in the normal direction.
I didn't trust this on the first pass — a promising result on a single short data window is exactly the kind of thing that turns out to be noise. So I pulled a much longer, genuinely independent sample (3.5 months) and ran a proper train/test split. It held up. Test-set performance actually matched training performance, which is the opposite of what overfitting looks like. That became a separate, purpose-built configuration rather than a tweak to the main model — mean-reversion and trend-following aren't the same strategy wearing different clothes, they're genuinely different bets.
Finding #4: an idea that sounded obviously correct, and was actively wrong on half the data
At one point I built a filter that reduced position size when ADX showed a weak trend, on the theory that "don't trust momentum signals when there's no real trend" is just common sense. Tested against daily data: worked exactly as expected. Tested against hourly data: the exact opposite — some of the best-performing signals were the ones with low trend strength, likely early entries into pullbacks within an existing move that a naive gate would have suppressed.
If I'd only tested on the timeframe where it worked, I'd have shipped a feature that was quietly sabotaging results on another timeframe. I didn't ship it. Sometimes the right amount of engineering is knowing when to stop.
Finding #5: a "fix" that looked great and was mostly luck
After finding H1's weak spot, I added a drawdown-based circuit breaker — stop trading entirely once losses from peak equity cross a threshold. First test: net profit flipped from negative to solidly positive. Great, right?
Except the circuit breaker had simply stopped new trades a few months in, right before the historically bad stretch. The "improvement" was largely a function of lucky timing, not a genuinely more robust system. I only found this by deliberately re-running the same test with the circuit breaker loosened, to see what happened across the entire period. Net result over the full year: back to roughly break-even. The circuit breaker is still a real, useful piece of risk control — it demonstrably caps how bad a losing stretch gets — but it doesn't fix the underlying regime-dependence, and claiming it did would have been dishonest.
Why I'm telling you all of this
Because every one of these findings could easily have been hidden behind a single, better-looking backtest summary. Aggregate statistics are extremely good at flattering a system and extremely bad at telling you when it's about to fail. The only real defense I've found is doing exactly what's above: split your data into independent windows, test everything that sounds "obviously correct" instead of assuming it, hold back anything that only proves itself once, and be honest — including in your own marketing copy — about where the edge is real and where it isn't.
SmartTrader AI Pro is what came out of this process: a scoring dashboard that documents its own validated scope (currently XAUUSD, primarily trending H1 conditions and a separately-calibrated M1 mode) rather than claiming to work everywhere. It's a decision-support and alerting tool, not a promise. If the process above is the kind of thing you'd want behind a tool before trusting it, that's what this is.
What this became
SmartTrader AI Pro is the dashboard indicator that came out of this whole process. It's not a black-box signal generator — it's a weighted-score panel for XAUUSD (EMA, RSI, MACD, ADX, tick-volume, a six-timeframe scanner, plus a separately-validated M1 counter-trend mode), built specifically so its documented scope matches what was actually measured above: real edge on H1 during trending conditions, a genuinely different validated behavior on M1, and an honest "not tested" label on everything outside that — instead of a claim that it works everywhere.
If the process in this post is the kind of thing you'd want to see behind a tool before trusting it, you can find SmartTrader AI Pro on the MQL5 Market here: https://www.mql5.com/en/market/product/186191?source=Site
Questions about any of the findings above, or about the indicator itself — drop them in the comments, I'm happy to go into more detail on any of it.




