
With this new version we brought a series of improvements, including the ability to now view Elliott wave count if you download the demo version.
V1.2 Changes
Because the panel wasn't working in the strategy tester, I added 2 new settings,
1- Auto/analyze on load = true by default
2- Analyze on new bar close = true by default
The panel is not yet working in the strategy tester due to internal programming language issues but that newer configuration will help backtest it on strategy tester. The panel is fully functional in real-time charts (Live Charts).
3-The projections now have a box height, ideal for Fibonacci cluster.
Now I'm going to explain using Bitcoin 1 Hour chart as an example.
First, I look at several counts starting from a significant minimum or maximum. We already explained in this other post how to do the counts with Elliott Wave Engine MT5.
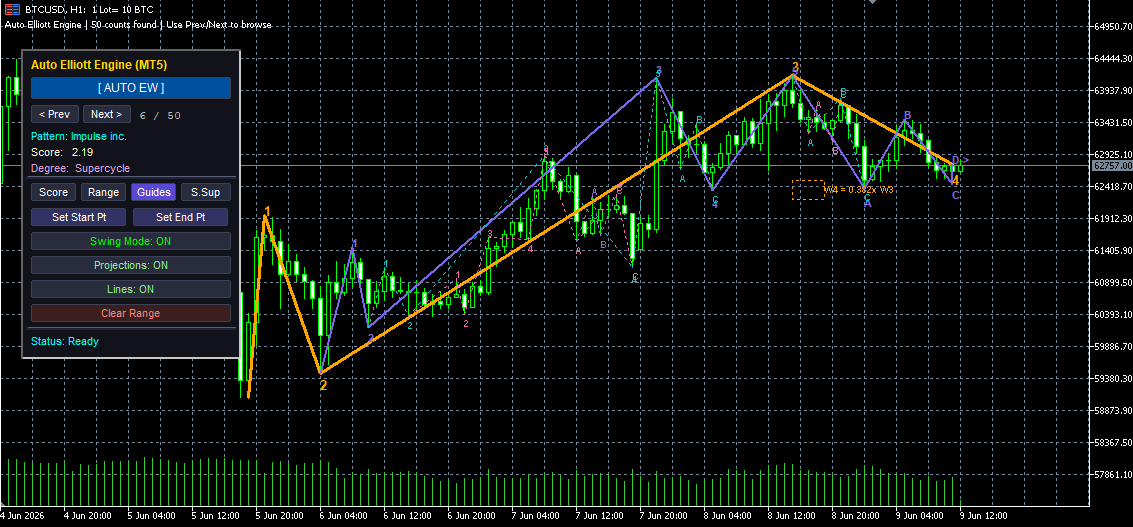
It is important to analyze alternative motive and corrective counts.
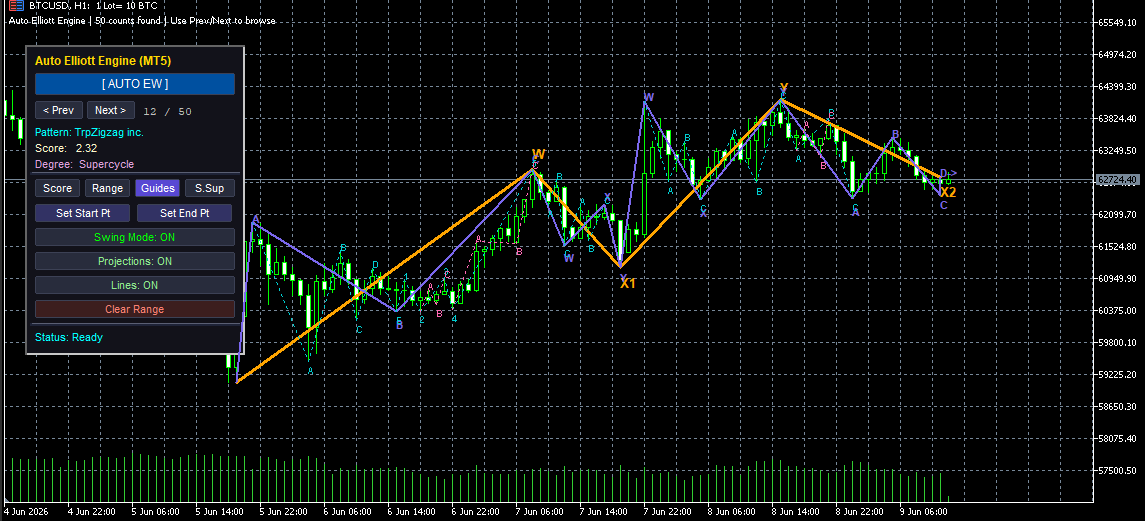
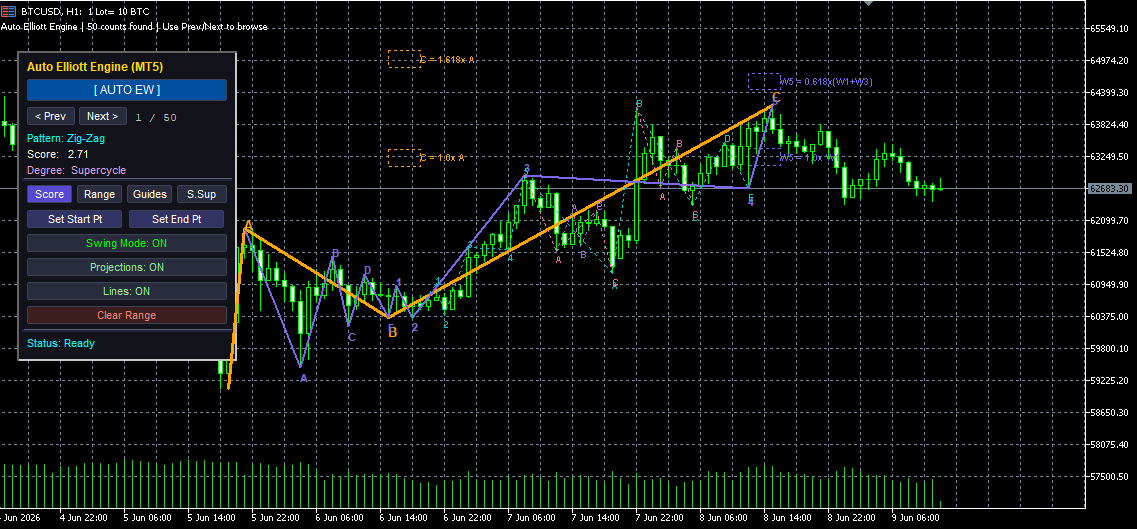
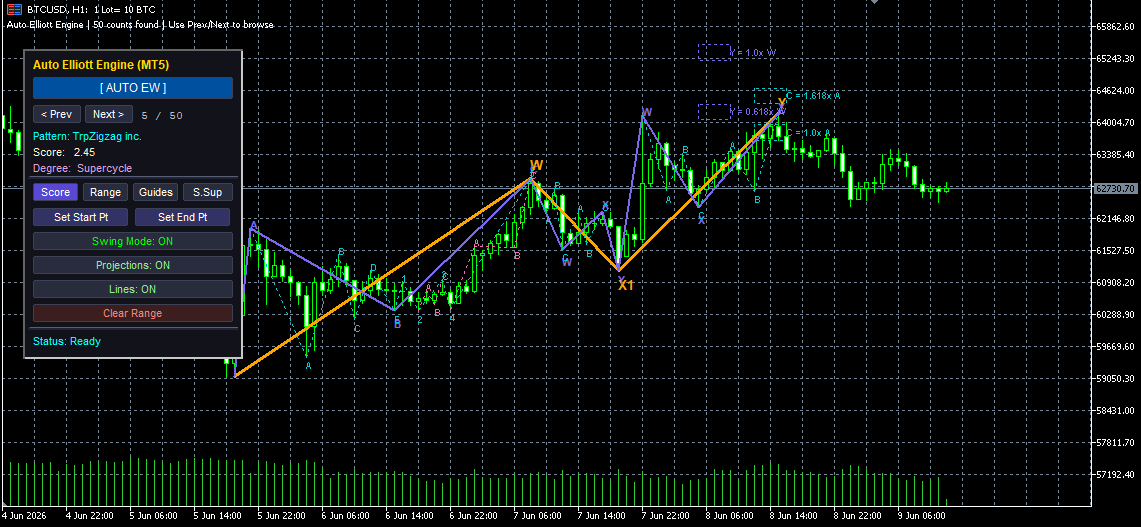
Now it's time to summarize what we've seen from the counts. The human perspective of someone who knows the guidelines and rules is important.
Some counts point to a current triangle pattern, after which there would be an upward continuation; also, below 61141 seems to be a clue to the end of the
correction and a deeper downward continuation.
Get Elliott Wave Engine MT5 V1.2 or try the demo version now.




