
Supreme Range Profile Structure User Manual for MetaTrader 4 and MetaTrader 5

1. What Supreme Range Profile Structure Is
Supreme Range Profile Structure is a chart indicator for MetaTrader 4 and MetaTrader 5. It finds sideways ranges from the chart's own swing highs and lows, shades each range, builds a volume profile inside it with its point of control (POC), marks every move that closed outside and then closed back inside with a diamond, and when closes are accepted beyond an edge it tags the break and draws a position tool with an entry, a stop and three targets. Candles inside an active range are coloured by where they close.
It does not place trades and has no access to your account. Breaks and deviations are decided on a closed bar. For the trading method behind it, read the trading guide.
2. Installation
The steps are the same on both platforms; the MetaTrader 5 and MetaTrader 4 versions are separate products.
- Buy or rent the indicator on its MQL5 Market page with your MQL5 account.
- In MetaTrader, log in to the same MQL5 account (Tools, Options, Community).
- Open the Toolbox (Ctrl+T; the Terminal window on MetaTrader 4), go to the Market tab, find Supreme Range Profile Structure under Purchased and click Install.
- In the Navigator (Ctrl+N), open Indicators, then Market, and drag Supreme Range Profile Structure onto a chart.
- Click OK to start with the defaults. Change any input later with Ctrl+I on the chart.
It runs on any symbol and any timeframe from M1 to monthly, needs no DLL, no web request and no file access, and removes everything it drew when you remove it.
On attaching, it calculates the newest 20,000 bars (Bars to calculate) before it draws, so the first picture can take a few seconds; after that only new bars are calculated. A chart that holds fewer bars uses all it has; the terminal's own limit is in Tools, Options, Charts, Max bars in chart.
3. What You See on the Chart
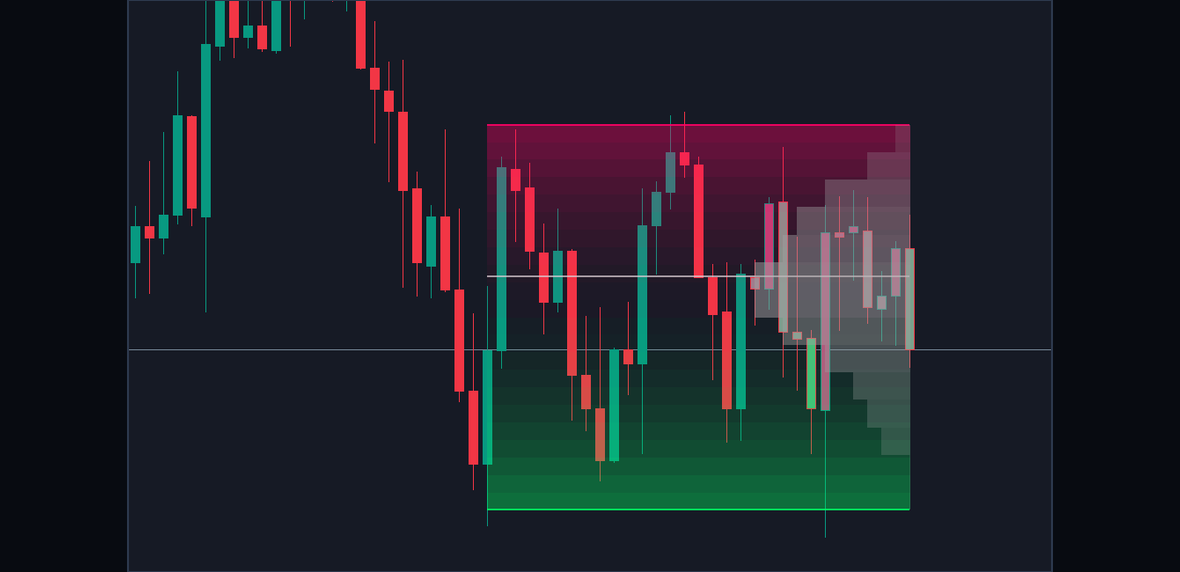
Figure 1. An active range, annotated: the two edge lines, the two-colour shading, the volume profile rows against the right end, the point of control and the tinted candles.
- The range: a band from the bar of its oldest swing to the newest bar, shaded in layers, the upper half in the Bearish colour and the lower half in the Bullish colour, strongest at the edges and clear in the middle. A completed range keeps a fainter shading.
- The edge lines: the top edge in the Bearish colour, the bottom edge in the Bullish colour. While the range is active a line grows more solid with each touch; a completed range draws both lines at one fixed strength.
- The volume profile: horizontal rows growing leftwards from the range's right end, the longest at the busiest prices. Grey (the Profile colour) while the range is active; Bullish after a breakout, Bearish after a breakdown, and still the Profile colour when a range ends by age.
- The point of control: a line across the range through the busiest row, in the chart's text colour, fainter once the range has ended.
- Diamonds: at the extreme of a move that closed outside and then closed back inside, above the range in the Bearish colour, below it in the Bullish colour.
- Break tags: BREAKOUT with an up arrow, or BREAKDOWN with a down arrow, on the broken edge at the break bar, on a plate in the break's colour.
- The position tool: a reward box and a risk box, a solid entry line, a dashed stop line, dotted TP1 and TP2 lines and a solid TP3 line, with the labels ENTRY, SL, TP1, TP2 and TP3 at its right end.
- Candle colours while a range is active, and an optional dotted equilibrium line at the middle of the range.
The Data Window (Ctrl+D) shows two values for every bar of an active range: Active Range High and Active Range Low.
4. When Things Are Calculated
- Breaks, deviations, their tags and position tools, the end of a range by Maximum Range Age, and every alert are decided when a bar closes, and never change afterwards.
- The search for a new range, edge touches, the active profile and POC, and the newest candle's colour are also worked out while a bar is forming, at most four times a second, as if the bar closed now. A range can therefore appear, or an edge move, and go again if the bar closes differently; when the bar closes, it is calculated once more, for good.
- A swing is confirmed 5 bars after it formed (Swing Length).
- On MetaTrader 5, when the last bar's time is up by the broker's clock and no tick has come (a quiet market, the weekend), the bar is treated as closed about ten seconds later.
- Everything is calculated once more from the newest bars when older history is scrolled into the chart, when the chart's colours change (the POC, the entry and stop lines and the tag plates use them), or after a gap of more than 1,000 new bars, such as a long reconnect. No alert is sent for bars calculated again.
5. Inputs
There are 47 inputs in 8 groups: six groups of the indicator's own, MetaTrader with two platform settings, and Alerts. On MetaTrader 4 each group starts with a separator line in the list of inputs; it is a label and changes nothing. A value outside its allowed range is held at the nearest end of it.
1. Swing Engine
| Input | Default | Allowed | What it changes |
|---|---|---|---|
| Swing Length | 5 | 2 to 30 | Bars on each side of a swing high or low; a swing is confirmed this many bars after it formed. Lower finds more, smaller swings and so more, tighter ranges; higher finds fewer, bigger ones. |
| Swing Memory | 10 | 4 to 20 | How many of the newest swings are kept and searched for a range. Two swings in a row on the same side merge into the more extreme one. |
| ATR Length | 14 | 2 to 1000 | Bars in the Average True Range that every width, tolerance and buffer is measured in. |
2. Range Detection
| Input | Default | Allowed | What it changes |
|---|---|---|---|
| Touches Per Edge | 2 | 2 to 5 | The fewest swing highs and the fewest swing lows a range needs. |
| Minimum Rotations | 3 | 3 to 10 | The fewest alternations between highs and lows. A range needs at least the larger of twice Touches Per Edge and this plus one swings. |
| Minimum Range Span | 8 | 3 to 100 | The fewest bars between the oldest and the newest swing of a range. |
| Edge Stability ATR | 0.30 | 0.05 to 1.0 | How tightly the swings of each edge must cluster: the highs may spread at most twice this many ATR, and so may the lows. Also how close a new swing must come to an active edge to count as a touch. |
| Minimum Width ATR | 1.0 | 0.25 to 5.0 | The smallest range height, in ATR. |
| Maximum Width ATR | 6.0 | 1.0 to 15.0 | The largest range height, in ATR. A value below Minimum Width ATR is raised to it. |
| Edge Adaptation | 0.20 | 0 to 0.50 | The share of the gap an active edge moves toward each swing that touches it. At 0 the edges stay where they were found; touches are still counted. |
| Maximum Range Age | 0 | 0 to 2000 | The most bars a range stays active after it was found. It then ends without a tag, position tool or alert, and its profile keeps the Profile colour. 0 means no limit. |
3. Volume Profile
| Input | Default | Allowed | What it changes |
|---|---|---|---|
| Range Volume Profile | true | true or false | Draw the profile rows inside each range. |
| Profile Rows | 14 | 8 to 16 | How many equal price rows the range's tick volume is spread over. |
| Profile Width % | 40 | 15 to 60 | The length of the busiest row as a share of the range's length in bars, at least 2 bars; the other rows scale from it. |
| Point of Control | true | true or false | Draw the line through the busiest row; it is drawn only while the range has volume. |
4. Breakout Structure
| Input | Default | Allowed | What it changes |
|---|---|---|---|
| Break Buffer ATR | 0.10 | 0 to 2.0 | How far beyond an edge, in ATR, a close must be to count as outside. 0 counts any close beyond the edge. |
| Break Acceptance Closes | 2 | 1 to 5 | Consecutive closes outside the buffer that confirm a breakout or a breakdown. Any other close resets the count. |
| Breakout Tag | true | true or false | Draw the BREAKOUT or BREAKDOWN tag on the broken edge at the break bar. |
| Range Deviations | true | true or false | Draw the diamonds. The deviation alerts fire either way. |
| Deviation History | 30 | 5 to 100 | How many diamonds stay on the chart; the oldest goes first, and a diamond outlives its range. |
5. Position Tool
| Input | Default | Allowed | What it changes |
|---|---|---|---|
| Breakout Position Tool | true | true or false | Draw the position tool on each break. The break alerts fire either way. |
| Position Width | 10 | 3 to 40 | How many bars the tool reaches forward from the break bar. |
| TP1 | 0.50 | 0.10 to 3.0 | The first target's distance from the entry, in range heights. |
| TP2 | 1.00 | 0.10 to 4.0 | The second target's distance from the entry, in range heights. |
| TP3 | 2.00 | 0.10 to 5.0 | The third target's distance from the entry, in range heights; the reward box reaches to it. |
| Position Labels | true | true or false | Draw the ENTRY, SL, TP1, TP2 and TP3 labels at the tool's right end. |
6. Display
| Input | Default | Allowed | What it changes |
|---|---|---|---|
| Gradient Smoothness | 22 | 12 to 24 | How many layers draw the shading; more layers give a smoother fade. |
| Completed Ranges | 10 | 1 to 10 | How many finished ranges stay on the chart with their profile, tag and position tool; the oldest goes first. |
| Range Candle Colors | true | true or false | Colour the candles of an active range by where they close. |
| Candle Transparency | 10 | 0 to 70 | The transparency of those candle colours, in percent. |
| Equilibrium | false | true or false | A dotted line at the middle of each range. |
| New Range Cooldown | 4 | 0 to 50 | Bars to wait after a range ends before the search for the next one starts. |
| Profile | 160,160,160 | any colour | The active profile, the candle colour at mid-range, and the profile of a range that ends by age. |
| Bullish | 0,255,102 | any colour | The lower half of the shading, the bottom edge line, low diamonds and bullish candles; on a breakout the tag, the reward box, the targets and the finished profile. |
| Bearish | 255,0,102 | any colour | The upper half of the shading, the top edge line, high diamonds and bearish candles; on a breakdown the tag, the reward box, the targets and the finished profile. |
7. MetaTrader
| Input | Default | Allowed | What it changes |
|---|---|---|---|
| Bars to calculate (0 = all) | 20,000 | 0 or more | How many of the newest bars the ranges are calculated over; 0 takes the whole chart. |
| Pin position labels inside the chart | true | true or false | Keep a fresh position tool and its labels inside the chart when the space right of the last bar is narrow. |
8. Alerts
| Input | Default | Allowed | What it changes |
|---|---|---|---|
| Enable alerts | true | true or false | The master switch of every alert. |
| Alert: Range Breakout | true | true or false | Alert when a range breaks upward. |
| Alert: Range Breakdown | true | true or false | Alert when a range breaks downward. |
| Alert: Range High Deviation | true | true or false | Alert when a move above a range closes back inside. |
| Alert: Range Low Deviation | true | true or false | Alert when a move below a range closes back inside. |
| Channel: popup window | true | true or false | Deliver alerts in the terminal's alert window. |
| Channel: sound | false | true or false | Play a sound with each alert. |
| Sound file (in the terminal's Sounds folder) | alert.wav | a file name | The sound file to play. |
| Channel: push notification | false | true or false | Send alerts to the MetaTrader app on your phone. |
| Channel: e-mail | false | true or false | Send alerts by e-mail. |
6. Setting Up Alerts
- Keep Enable alerts on and choose the conditions. All four are on by default.
- Choose the channels. The alert window is on by default.
- Sound: switch it on and name a .wav file from the Sounds folder of the terminal's installation folder, for example alert.wav.
- Push notification: in Tools, Options, Notifications, enable push notifications, enter the MetaQuotes ID shown in the MetaTrader app on your phone and click Test; then switch the push channel on. The terminal limits how many notifications a program may send per minute.
- E-mail: in Tools, Options, Email, enable e-mail, enter your mail server, login, password and the From and To addresses and click Test; then switch the e-mail channel on. The subject names the indicator, the symbol and the timeframe, for example Supreme Range Profile Structure EURUSD H1.
The messages carry your broker's name as the terminal reports it and the chart's symbol:
Supreme Range Profile Structure broke upward | Your Broker:EURUSD Supreme Range Profile Structure broke downward | Your Broker:EURUSD Supreme Range Profile Structure deviated above the range and confirmed back inside | Your Broker:EURUSD Supreme Range Profile Structure deviated below the range and confirmed back inside | Your Broker:EURUSD
Every alert fires once per condition per closed bar, and never for history or in the Strategy Tester. The drawing switches change what you see, not what fires. A move that becomes a break sends the break alert only. Nothing fires for a new range, an edge touch, a range that ends by age, or price reaching a level of the position tool.
7. Bars to Calculate and Pin Position Labels
Bars to calculate (20,000 by default; 0 = the whole chart) limits the calculation to the newest bars. Where that window starts decides which swings are remembered first and so which range is found first: with another value, the first ranges found may differ. When you scroll older history into the chart or change the value, everything is calculated once more from the newest bars.
Pin position labels inside the chart (on): a fresh break's position tool reaches 10 bars past its break bar (Position Width), often past the last bar, and its labels start at its right end. While the last bar is on screen and the space right of it is too narrow, the tool then ends closer to the last bar so its widest label stays inside the chart. Off, the tool always keeps its exact bars; use the chart shift to make room.
8. MetaTrader 5 and MetaTrader 4: How the Drawing Differs
MetaTrader 5 paints everything over the candles with real transparency, as one image that follows every scroll, zoom and price-scale change, so the candles show through the shading. The candle colours tint only the inside of each body; the wick and the outline keep your chart's colours.
MetaTrader 4 draws the shading, the profile rows and the boxes behind the candles, in solid colours that are the blend of the transparent colours over your chart's background, and the lines and tags over the candles. It colours the candle bodies in 26 steps: 12 from the Bullish colour to the Profile colour, 12 from the Profile colour to the Bearish colour, and the full Bullish and Bearish colours for a close beyond an edge. Each tinted bar takes the nearest step. The candle colours are drawn on a candlestick chart only.
The calculation, the ranges, the levels and the alerts are the same on both platforms.
9. Performance Notes
- The first calculation covers the newest Bars to calculate bars; after that each closed bar is calculated once, and the forming bar at most four times a second. MetaTrader 4 repaints the forming bar at most once a second.
- A lower Bars to calculate starts faster, but the first ranges found may differ.
- A profile is built again from at most 1,500 bars back when an edge moves.
- On MetaTrader 4 every range is drawn from many rectangles; fewer Completed Ranges, Profile Rows or a lower Gradient Smoothness give a lighter chart.
10. Troubleshooting
There is no active range. A range needs alternating swing highs and lows that cluster: Touches Per Edge on each side, each side within twice Edge Stability ATR, a height inside the width window and a span of Minimum Range Span bars. A trending market rarely passes. After a range ends, the swings are cleared and New Range Cooldown bars must pass, so a new range needs fresh swings.
Too few or too many ranges. A higher Edge Stability ATR, a wider width window, a lower Minimum Range Span or a lower Swing Length find more ranges; the opposite settings find fewer and larger ones.
A range appeared on the newest bar and went away. The search also runs on the forming bar; a range found there goes again if the bar closes differently.
The edges moved. That is Edge Adaptation: each touch moves its edge 20 percent of the way toward the swing.
Price closed outside, but there is no BREAKOUT or BREAKDOWN. A break needs Break Acceptance Closes closes in a row beyond the edge plus the buffer; a close inside the buffer resets the count, and wicks never count.
The diamond is not on the bar where price came back. By design it marks the move's extreme, on the bar that made it.
Price went outside and came back, but there is no diamond. A deviation needs a close beyond the buffer, then a close back between the edges while the range is active. A move that becomes a break gets no diamond. Check Range Deviations and Deviation History.
A diamond sits where no range is drawn. Diamonds outlive their range until Deviation History removes them.
A range turned grey and ended without a break. Maximum Range Age is above 0.
Older ranges disappeared. Completed Ranges keeps the ten newest.
The position tool is shorter than Position Width. Pin position labels inside the chart is keeping its labels inside a narrow right margin; scroll or switch it off.
Some candles are not coloured. Only candles of an active range are, and not the bar that ends it. On MetaTrader 4 the chart must show candlesticks.
My chart shows other ranges than another chart of the same symbol. Ranges come from your broker's candles and the profile from its tick volume; the start of the window matters too.
No alerts arrive. Check the condition's switch, Enable alerts and a channel. Alerts fire only on bars that close while the indicator runs; push and e-mail also need the terminal's settings.
11. Frequently Asked Questions
Does it repaint? Breaks, deviations, their tags and position tools never change after their bar closes. The active range, its edges and profile are worked out on the forming bar too, so the newest part of the chart can change until that bar closes.
Can I use it in the Strategy Tester? Yes, in visual mode. Alerts never fire in the tester, and a non-visual run draws nothing.
Does it need real volume? It uses MetaTrader's tick volume for the profile and the POC.
How do I read the position tool's prices? The labels carry no prices. The levels are reference levels measured from the range, not a forecast. In the Data Window, the Active Range High and Active Range Low of the last bar before the break bar are the edges the tool was measured from, unless a swing confirmed on the break bar moved an edge.
12. Support
Ask in the Comments (Discussion) section of the product's page on mql5.com. Give the platform and its build, the symbol and timeframe, your broker, any inputs you changed, a screenshot, and the lines of the Experts and Journal tabs from that time.
13. Version History
- 1.00: first release for MetaTrader 4 and MetaTrader 5.
Risk Disclaimer
Trading leveraged products such as forex and CFDs carries a high level of risk and may not be suitable for all investors. Supreme Range Profile Structure is an analysis tool, not financial advice. Test it on a demo account before trading real money.