SMC Algo Spartan for MT4 and MT5: User Guide and Trading Manual

1. Introduction
SMC Algo Spartan is a smart money concepts indicator for MetaTrader 4 and MetaTrader 5. It finds the swing highs and lows on your chart, names every break of structure as a BOS (the trend continues) or a CHoCH (the trend turns), marks the order block each break leaves behind, and prints a buy or sell arrow when price comes back into a live block and a candle rejects it. Each arrow carries a plan: an entry, a stop and two targets, drawn with their prices.
This guide covers version 1.00 on both platforms: installation, how the indicator decides, how to read the chart, all 44 inputs, alerts and three ways to trade with it.
Key features: - Market structure with BOS (dotted) and CHoCH (solid) lines and labels, teal for breaks up and orange for breaks down - Order blocks marked at every break, up to four live per side, ended by the close that goes through them - Retest arrows on closed bars, one per block, in the direction of the structure by default - A plan for every arrow: entry, stop beyond the block plus 0.2 ATR, TP1 at 1R and TP2 at 2R - Four alert events through popup, sound, push notification and e-mail - Same calculation on MT4 and MT5: identical inputs, swings, breaks, blocks, arrows and levels
Get the indicator (a free demo is available on both pages):
MetaTrader 5: SMC Algo Spartan MT5
MetaTrader 4: SMC Algo Spartan MT4
TIP: The indicator draws and alerts. It does not place trades. Decide your position size from the stop distance before you act on an arrow, and try every change of settings on a demo account first.
2. How the Indicator Works
Swings
A swing high is a high that no candle within Swing length bars on either side goes beyond (5 by default); a swing low is the mirror image. A swing is confirmed only when those bars to its right have closed, so at the default it appears five bars after the candle that made it. Each swing can be broken once.
Breaks: BOS and CHoCH
A candle that closes above the last swing high breaks structure up; a close below the last swing low breaks it down. A wick beyond the level is not a break. If the structure already pointed the way of the break, it is a BOS, drawn dotted. If it pointed the other way, it is a CHoCH, drawn solid, and the structure turns. The line runs from the swing to the breaking candle, with its label in the middle.
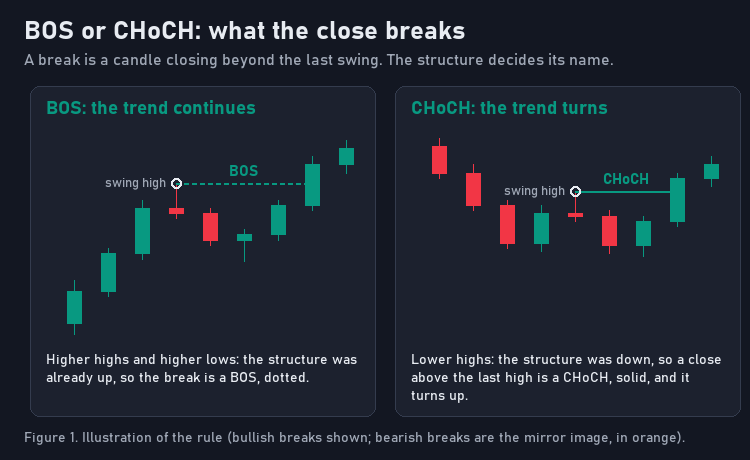
Figure 1. Illustration of the rule. Bearish breaks are the mirror image, in orange.
Order blocks
At each break the indicator looks back to the last opposite swing (at most 100 bars) and marks one candle as the order block: the candle with the lowest low before a break up, or the highest high before a break down. The block is that candle's high-to-low range, drawn as a box that extends to the right on every new bar while the block lives.
A bullish block ends on the first close below its bottom; a bearish block on the first close above its top. At most four blocks live on each side; a fifth removes the oldest.
Retest arrows
A buy arrow prints on a candle that, on its close: has its low at or below the top of a live bullish block marked on an earlier bar; closes above its open; does not close below the block's bottom; and, with Only trade in direction of structure on, comes while the structure is up. Each block gives one arrow at most, and a candle gives one buy arrow at most. A sell arrow is the mirror image.
The plan
Each arrow draws four lines, 20 bars long, with their prices at the right end:
- entry: the arrow candle's close (dotted grey),
- sl: for a buy, the lower of the block's bottom and the candle's low, minus 0.2 x ATR(14); for a sell, the higher of the block's top and the candle's high, plus 0.2 x ATR(14) (red),
- tp1: entry plus one times the risk for a buy, minus for a sell (green),
- tp2: two times the risk (cyan).
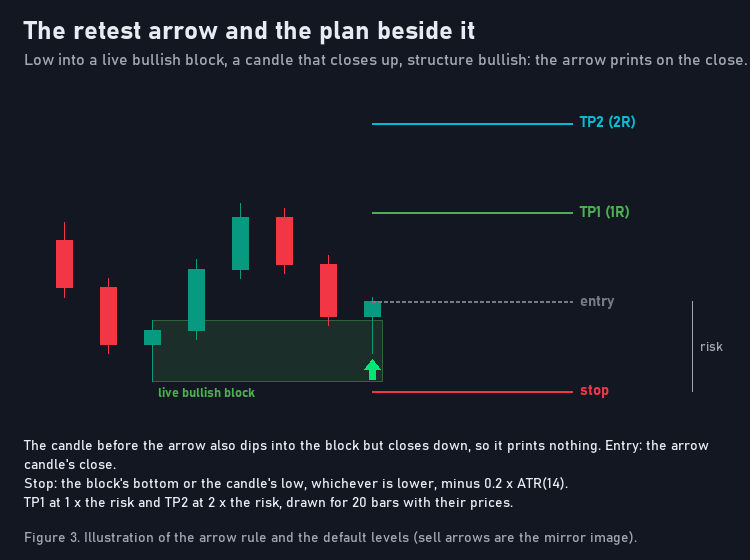
Figure 3. Illustration of the arrow rule and the default levels.
NOTE: Every break, block, arrow, level and alert is decided on a closed bar. The forming bar is never calculated, so an arrow appears when its bar has closed, in practice when the next bar opens, and once printed it does not move or disappear. What changes later is by design: a live block's box grows to the right, a block disappears (or turns grey) when a close goes through it, and the oldest drawings are removed beyond the limits described in section 6.
3. Installation from the MQL5.com Market
- Open the product page for your platform: MT5 or MT4.
- Click Buy (or Free Demo to test first) and complete the purchase with your MQL5.com account.
- In MetaTrader, log in to the same MQL5.com account under Tools > Options > Community.
- The indicator installs automatically. Find it in the Navigator under Indicators > Market. If it is not there yet, restart MetaTrader or right-click the Navigator and choose Refresh.
- Drag it onto a chart, review the inputs and click OK.
NOTE: A free demo version is available for testing. Market demos run in the Strategy Tester: start a visual test to see the structure, blocks, arrows and levels on history. Alerts never fire in the tester, so the demo shows everything except alerts.
4. Reading the Chart
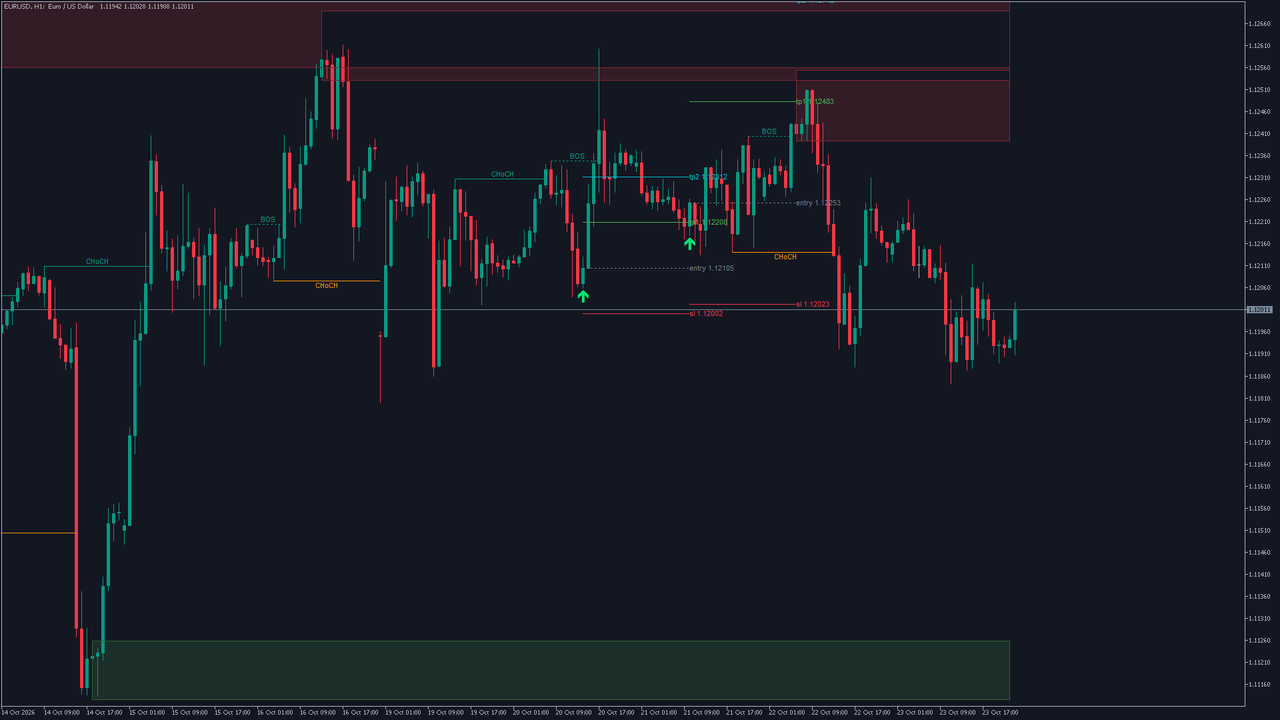
Everything on the chart, from left to right in time:
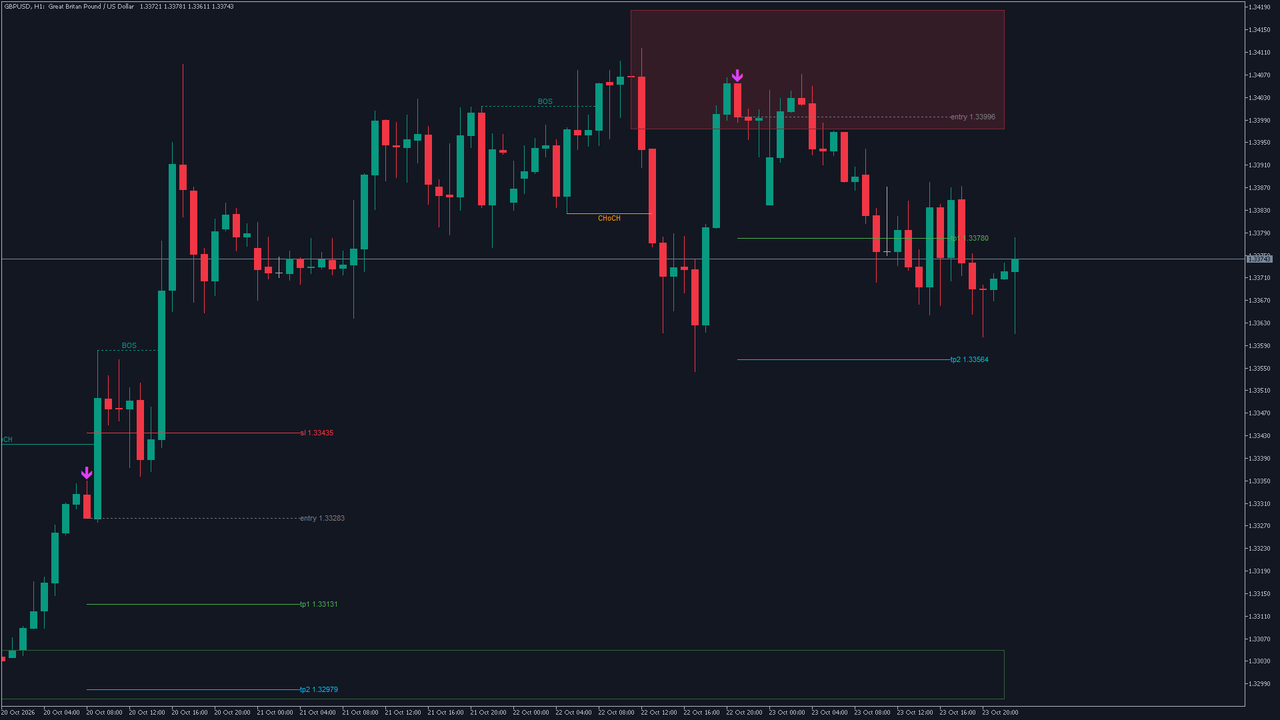
- Structure lines and labels. Dotted lines labelled BOS and solid lines labelled CHoCH, teal for breaks up and orange for breaks down. The colour of the newest label is the current structure.
- Order blocks. Green boxes are live bullish blocks, red boxes live bearish blocks. A box that still reaches the latest bars is alive; a block that was closed through is gone (or grey, if you keep mitigated blocks).
- Arrows. A green arrow under a candle is a buy retest; a magenta arrow over a candle is a sell retest.
- Plans. Next to each recent arrow, the entry, sl, tp1 and tp2 lines with their prices. The last five plans stay on the chart.
A four-question read works on any chart: what colour is the newest label, where are the live blocks against price, what does the newest arrow's plan say, and what would make the next arrow print.
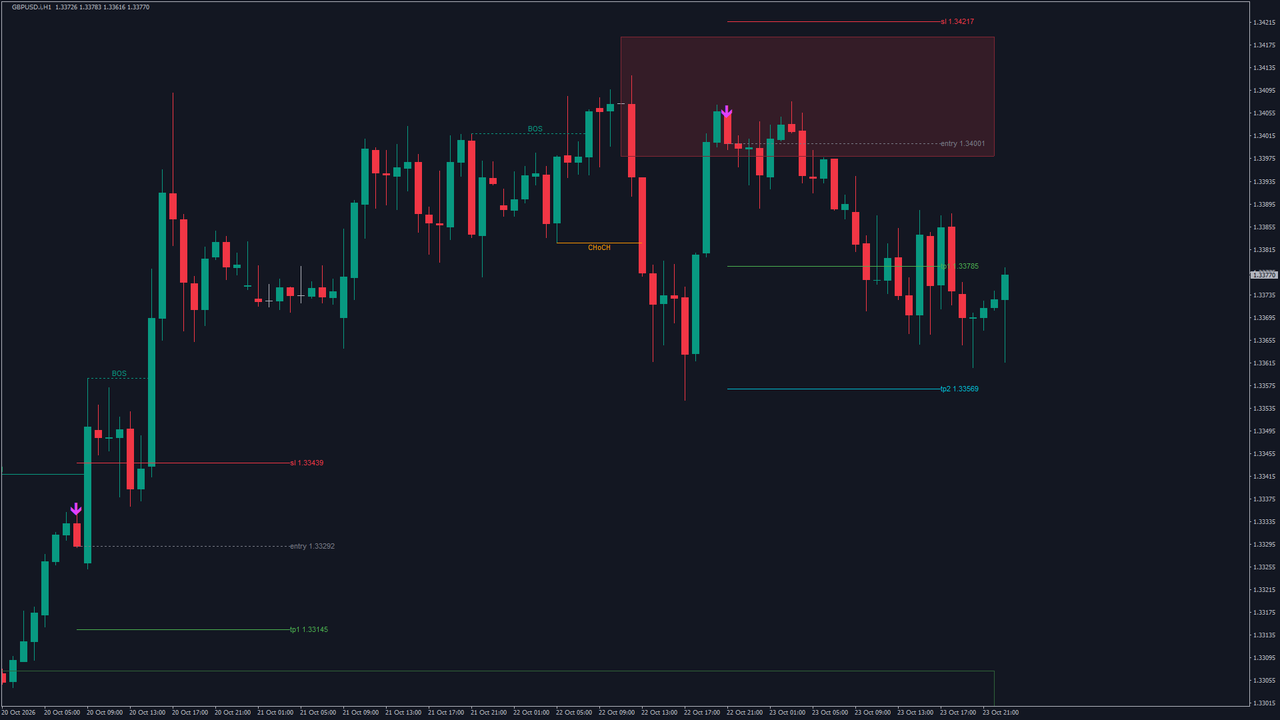
On MetaTrader 4 the chart looks the same. The only visible difference is that the order block border is drawn with four lines instead of a rectangle outline.
5. Colours and Background
The block fills and borders are shaded over your chart's own background colour (the fill at 85 percent transparency, the border at 50 percent, a kept mitigated block at 88 percent), so they read on dark and light chart themes. If you change the chart background while the indicator runs, the shading follows. Every colour can be changed in the Colors group.
6. Input Parameters Reference
All 44 inputs, in the order of the settings dialog. MetaTrader 5 shows the groups as headings; MetaTrader 4 shows them as separator lines with the same names.
Market Structure (BOS / CHoCH)
| Input | Default | What it does |
|---|---|---|
| Swing length | 5 | Bars on each side a swing high or low must beat. Smaller finds more, smaller swings and confirms sooner; larger keeps the bigger turns and confirms later |
| Show structure lines + labels | true | Draws the break lines and their labels. Off hides them; breaks are still detected and still create blocks |
| Show BOS | true | Draws the continuation breaks |
| Show CHoCH | true | Draws the breaks that turn the structure |
Order Blocks
| Input | Default | What it does |
|---|---|---|
| Show order blocks | true | Marks order blocks. Off also stops the arrows and plans, which come only from blocks |
| Create OB only on CHoCH (reversal) | false | Marks blocks only at a change of character; continuation breaks leave none |
| Only trade in direction of structure | true | Buy arrows only while the structure is up, sell arrows only while it is down. Off shows retests against the structure too |
| Max active OB per side (1-20) | 4 | Live blocks kept per side; a new one beyond this removes the oldest |
| Remove OB when mitigated | true | Removes a block on the close that goes through it. Off keeps it, stopped at that bar, in the mitigated colour |
Signals
| Input | Default | What it does |
|---|---|---|
| Show entry arrows | true | Draws the buy and sell arrows. Off hides the arrows only; plans and alerts still follow the same retests |
SL / TP
| Input | Default | What it does |
|---|---|---|
| Show SL/TP with arrows | true | Draws the entry, stop and target lines for each arrow |
| ATR length | 14 | ATR period behind the stop buffer |
| SL buffer (x ATR) | 0.2 | Extra distance beyond the block or candle for the stop, in ATR |
| TP1 risk:reward | 1.0 | TP1 distance in multiples of the entry-to-stop risk |
| TP2 risk:reward | 2.0 | TP2 distance in multiples of the risk |
| Show TP2 | true | Draws the second target |
| SL/TP line length (bars) | 20 | How many bars to the right the plan lines run |
| Max trades kept on chart (1-50) | 5 | Plans kept on the chart; a new one beyond this removes the oldest |
| Show price in labels | true | Prints the price after entry, sl, tp1 and tp2; off prints the names only |
Colors
| Input | Default | What it does |
|---|---|---|
| Bullish OB fill | #4CAF50 | Fill of bullish blocks (green, shaded over the background) |
| Bullish OB border | #4CAF50 | Border of bullish blocks |
| Bearish OB fill | #F23645 | Fill of bearish blocks (red) |
| Bearish OB border | #F23645 | Border of bearish blocks |
| Mitigated OB (if kept) | #787B86 | Grey of a block kept after it was closed through |
| Bullish BOS/CHoCH | #089981 | Teal of breaks up and their labels |
| Bearish BOS/CHoCH | #FF9800 | Orange of breaks down and their labels |
| Buy arrow | #00E676 | Buy arrows (green) |
| Sell arrow | #E040FB | Sell arrows (magenta) |
| Entry line | #787B86 | Dotted entry line and its label |
| SL line | #F23645 | Stop line and its label |
| TP1 line | #4CAF50 | TP1 line and its label |
| TP2 line | #00BCD4 | TP2 line and its label (cyan) |
MetaTrader
| Input | Default | What it does |
|---|---|---|
| Bars to calculate (0 = all) | 5000 | How many recent bars the calculation covers. 0 covers the whole history and takes longer to load |
| Keep object limits (500 lines, 500 labels, 200 boxes) | true | Removes the oldest drawings beyond these counts. Off keeps every drawing in the window |
| Label font size | 8 | Size of the BOS, CHoCH and price labels, from 6 to 20 |
Alerts
| Input | Default | What it does |
|---|---|---|
| Enable alerts | true | Master switch for every alert |
| Alert: buy (bullish OB retest) | true | Alert on each buy retest |
| Alert: sell (bearish OB retest) | true | Alert on each sell retest |
| Alert: bullish CHoCH | true | Alert when the structure turns up |
| Alert: bearish CHoCH | true | Alert when the structure turns down |
| Channel: popup window | true | MetaTrader's alert window, which plays its own sound |
| Channel: sound | true | Plays a sound when the popup is off |
| Channel: push notification | false | Sends to the MetaTrader mobile app |
| Channel: e-mail | false | Sends to the address set in the terminal |
7. Alert Configuration
Each alert names the event, the symbol, the timeframe and the close of the bar that triggered it:
BUY (bullish OB retest) on <symbol> <timeframe> @ <close> SELL (bearish OB retest) on <symbol> <timeframe> @ <close> Bullish CHoCH on <symbol> <timeframe> @ <close> Bearish CHoCH on <symbol> <timeframe> @ <close>
For example: BUY (bullish OB retest) on EURUSD H1 @ 1.12253 . An e-mail carries the subject SMC Algo Spartan <symbol> <timeframe> .
Push notifications: install the MetaTrader app on your phone, copy its MetaQuotes ID into Tools > Options > Notifications on the desktop terminal, enable notifications, press Test, then set Channel: push notification to true.
E-mail: fill in the SMTP server, login and addresses under Tools > Options > Email, press Test, then set Channel: e-mail to true.
Rules that apply to every channel: - Alerts are evaluated on closed bars only and each event fires once per bar. - No alert fires for bars in history when the indicator loads, and none fires in the Strategy Tester. - Alerts fire only while the terminal is running and the chart is open. - With several charts open, each chart alerts for its own symbol and timeframe.
8. Trading Strategies
These are three ways to use the indicator, not recommendations. Test any of them on a demo account before using it with real money.
Strategy 1: Retests with the higher timeframe
Trade on one timeframe and read the structure on the next one up with the same indicator (H1 with H4, M15 with H1). Take only arrows whose direction matches the newest label on both charts. Enter after the arrow's close, put the stop where the plan draws it, size the position so that the stop equals your fixed risk per trade, and decide one rule for TP1 before the entry: take half and move the stop to the entry, or close at TP1, or hold for TP2.
Strategy 2: Reversals only
Set Create OB only on CHoCH (reversal) to true. Blocks are then marked only where the structure turns, and every arrow is the first retest after a change of character. Fewer arrows means more waiting; use the CHoCH alerts to know when a new reversal block exists.
Strategy 3: Structure map with your own entries
Switch Show entry arrows and Show SL/TP with arrows off and keep the structure and blocks. The chart becomes a map of breaks and live zones for your own entry method, with the CHoCH alerts telling you when the structure turns. This suits traders who already have an entry trigger and want the structure marked consistently.
TIP: Keep a log of the arrows you take and skip, with the higher-timeframe structure at the time. After fifty entries the log tells you more about your own use of the indicator than any count in a guide.
9. Troubleshooting
No arrows for a long time. Normal on many charts: an arrow needs a live, unused block on the side of the structure, a candle reaching into it and a close the right way. Switching Only trade in direction of structure off or using a smaller Swing length shows more.
No order blocks or arrows at all. Check that Show order blocks is true; arrows come only from blocks. Very short histories need a few swings before the first break can happen.
Arrows but no plan lines. Show SL/TP with arrows is false, or the chart has fewer bars than the ATR length at that point.
Drawings near the left edge differ from another chart. The calculation starts at the first bar of the Bars to calculate window. Use the same value on charts you compare.
Old drawings disappear. The chart keeps at most 500 lines, 500 labels and 200 boxes and removes the oldest first, and keeps the last five plans. Set Keep object limits to false or raise Max trades kept on chart to keep more.
Slow loading on a long chart. Bars to calculate (5000) limits the work to recent history; 0 calculates everything and takes longer.
No push notification or e-mail. Check the channel is true in the inputs and the terminal passes its Test under Tools > Options > Notifications or Email. A popup proves the indicator is firing. Alerts fire only on closed bars, only while the terminal runs, never in the tester.
Not in the Navigator. Restart or refresh, and check the terminal is logged in with the MQL5.com account you bought with (Tools > Options > Community). Look under Indicators > Market.
10. FAQ
Q: Does it repaint? A: No break, block, arrow, level or alert is decided on a forming bar, and none changes once printed. A swing is confirmed a fixed number of bars after it forms (five at the default), which is a delay, not a repaint. Live block boxes grow to the right and dead blocks are removed, by design.
Q: Which timeframes can I use? A: Any, from M1 to monthly. The swing length counts bars, so the swings are shorter in time on lower timeframes. The ATR in the stop buffer is the chart's own timeframe.
Q: Which markets? A: Any symbol, because it reads open, high, low and close only. The charts measured for the trading guide covered forex, gold and silver, Bitcoin and Ether, stock indices and crude oil. Prices print in the symbol's own digits.
Q: What differs between MT4 and MT5? A: Only one detail of the drawing: MT4 draws a block's border with four lines instead of a rectangle outline. The calculation, inputs, arrows and levels are the same.
Q: Why is there no win rate? A: A win rate depends on how the trade is managed after the entry, which the indicator does not do. The same arrow can reach TP1 and fail at TP2, or the reverse with a different buffer, so a single figure would describe a management rule you may not use. Test your own rule on a demo account.
Q: Do alerts work in the Strategy Tester? A: No, and not for history either. The demo, which runs in the tester, shows the structure, blocks, arrows and levels but no alerts.
Q: Can I run it on several charts? A: Yes. Each chart has its own copy, drawings and alerts, and every alert names its symbol and timeframe.
Q: Does it place trades or work as a trading robot? A: No. It is an indicator: it draws and alerts, and every order is yours.
11. Support and Contact
Product pages:
MetaTrader 5: SMC Algo Spartan MT5
MetaTrader 4: SMC Algo Spartan MT4
Developer: Kestutis Balciunas, profile forexobroker on MQL5.com. Use the Message button on the profile or the product page.
Getting help: 1. Post general questions in the Comments section of the product page, so the answer helps other users too. 2. Send a private message for anything about your account or purchase. 3. Include your platform (MT4 or MT5) and build, broker, symbol and timeframe, any inputs you changed, a screenshot of the chart, and any message from the Experts tab.
Updates arrive through the MQL5 Market. A free demo version is available for testing before purchase.
12. Risk Disclaimer
Trading foreign exchange, contracts for difference, crypto assets and other leveraged instruments carries a high level of risk and may not be suitable for all investors. Leverage amplifies both profits and losses, and you can lose more than your deposit.
SMC Algo Spartan is an analysis tool. It does not place, modify or close orders, and no arrow, level or alert is a recommendation to trade. The counts in this guide describe what the indicator drew on real prices; they are not trading results and do not predict future results. Use a stop loss, practise on a demo account first, and only trade with capital you can afford to lose. The developer accepts no liability for trading decisions made with this tool.