Smart Money Concepts Indicator for MT4 and MT5: How to Trade BOS, CHoCH and Order Block Retests

1. Introduction
Smart money concepts give a trader a clear vocabulary for price: swing highs and lows, breaks of structure, changes of character and the order blocks those breaks leave behind. The vocabulary is easy to learn. Applying it the same way on every chart is the hard part. Two traders marking the same chart by hand will disagree about which swing counts, whether a break was a BOS or a CHoCH, and which candle is the order block.
That is why I built a smart money concepts indicator for MT4 and MT5 that marks all of it by fixed rules, on closed bars, and then does one more thing: when price comes back into a live order block and a candle rejects it, it prints an arrow with an entry, a stop and two targets beside it.
This guide explains the concepts first and the tool second. You will see how the indicator finds swings, how it decides between a break of structure and a change of character, where an order block comes from and when it ends, what has to happen for a retest arrow to print, and how the plan levels are calculated. The second half is practical: a ten-second chart read, a six-step workflow, the three mistakes that cost the most, ten real chart examples and the full parameter reference.
One point up front: the indicator does not trade. It draws and it alerts. Every order, every position size and every exit decision stays with you.
The indicator is available on the MQL5 Market for both platforms:
MetaTrader 5: SMC Algo Spartan MT5
MetaTrader 4: SMC Algo Spartan MT4
2. Market Structure in One Page
Market structure is the sequence of swing highs and swing lows that price leaves behind.
- In an up-trend price makes higher highs and higher lows. Each pullback stops above the last low, and each rally goes beyond the last high.
- In a down-trend price makes lower highs and lower lows.
- A range is the stretch where neither happens cleanly.
The structure only changes when a swing is broken. A rally that stops below the last high is still part of a down-trend. A close above that high is the event that matters, and smart money concepts give that event two different names depending on what came before it.
The word "close" is deliberate. A wick that pokes above a swing high and falls back is not a break in this method. The candle has to close beyond the level. This is the single most important rule in the indicator: every decision it makes is taken when a bar closes, never while it is forming.
3. Break of Structure and Change of Character
A break is a candle that closes beyond the last swing high (a break up) or beyond the last swing low (a break down). What the break is called depends on the structure at the moment it happens:
- BOS (break of structure): the break goes the way the structure already pointed. A close above the last high while the structure is up is a BOS. The trend continues. The indicator draws it as a dotted line from the swing to the breaking candle, labelled BOS.
- CHoCH (change of character): the break goes against the structure. A close above the last high while the structure is down is a CHoCH, and from that bar the structure is up. The indicator draws it as a solid line, labelled CHoCH.
Breaks up are drawn in teal and breaks down in orange, so the colour of the newest label tells you the current structure at a glance: a teal label means the last break was up, an orange label means it was down.
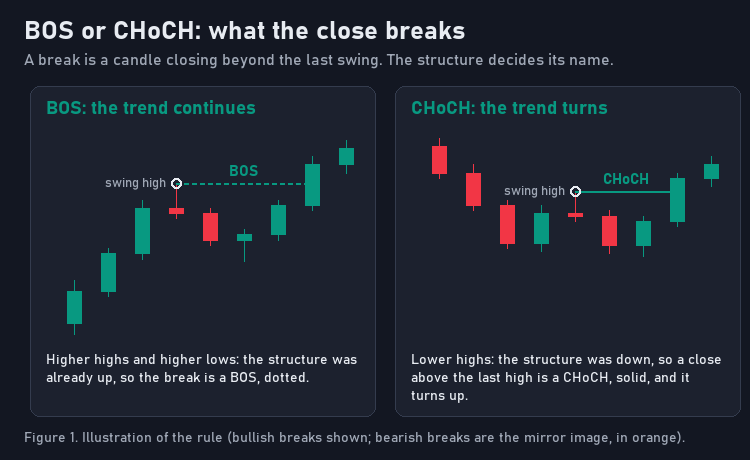
Figure 1. Illustration of the rule. Bullish breaks are shown; bearish breaks are the mirror image, in orange.
Each swing can be broken only once. After a close above a swing high, that high is spent, and the next break up needs a new swing high to form first.
4. Introducing SMC Algo Spartan, a Smart Money Concepts Indicator for MT4 and MT5
SMC Algo Spartan is the tool I built to put these rules on the chart without judgement calls. It runs on MetaTrader 4 and MetaTrader 5 with one shared calculation: the same swings, the same breaks, the same order blocks, the same arrows and the same levels on both. The one visible difference is cosmetic: MetaTrader 4 draws an order block's border with four lines where MetaTrader 5 uses a rectangle outline.
What it draws:
- Structure lines with BOS and CHoCH labels, teal for breaks up and orange for breaks down.
- Order blocks: green boxes for bullish blocks, red for bearish, up to four live on each side.
- Retest arrows: a green buy arrow below the candle or a magenta sell arrow above it, decided on the close.
- The plan for each arrow: entry, stop, TP1 and TP2 lines with their prices, drawn 20 bars to the right.
- Alerts for buys, sells and both kinds of CHoCH, through a popup, a sound, a push notification or an e-mail.
Every value the calculation produces was compared bar by bar with the reference recordings of the design on both builds: 23,087,874 values per platform across 26 combinations of settings, plus 19 drawing tests that compare every line, box and label, with no differences. On fourteen live MetaTrader 4 broker charts, the number of buy and sell arrows the indicator drew equals the number its own calculation finds on the same bars.
The indicator is available on the MQL5 Market for both platforms:
MetaTrader 5: SMC Algo Spartan MT5
MetaTrader 4: SMC Algo Spartan MT4
5. How the Indicator Finds a Swing
A swing high is a high that no candle within Swing length bars on either side goes beyond. At the default of 5, a high needs five lower highs to its left and five to its right. A swing low is the mirror image.
The five bars on the right are the price of certainty. A swing high can only be confirmed five bars after it formed, because the indicator has to see those five bars first. This is not a flaw that can be engineered away: any method that confirms a swing before the bars on its right exist is guessing, and a guess can change. The indicator never guesses. It waits five bars and then the swing is fixed.
The setting changes the picture more than any other:
- A smaller swing length (3, for example) finds more, smaller swings. Breaks come sooner and more often, and so do order blocks and arrows. It suits traders who work inside the day's moves.
- A larger swing length (10, for example) keeps only the bigger turns. Breaks are rarer and carry more weight, and the confirmation takes longer.
Five is the default because it keeps the swings a trader would mark by eye on most timeframes without marking every wiggle.
6. Order Blocks: Where They Come From and When They End
In smart money concepts, an order block is the last area where the move that broke structure began. The indicator defines it exactly:
- For a break up, it looks back from the breaking candle to the last swing low and takes the candle with the lowest low in that stretch. That candle's high and low become the bullish order block.
- For a break down, it takes the candle with the highest high since the last swing high. That candle becomes the bearish order block.
The look-back is capped at 100 bars, so a very old swing does not stretch a block across half the chart.
The block is drawn as a box that starts at its candle and runs to the right while it is alive. Every break marks a block by default, so a BOS and a CHoCH both leave one behind. If you want blocks only where the structure turns, the setting Create OB only on CHoCH (reversal) does exactly that (section 10).
A block ends in one of two ways:
- A close through its far side. A bullish block ends when a candle closes below its bottom; a bearish block ends when a candle closes above its top. By default the box is removed. With Remove OB when mitigated switched off, it stays on the chart in grey, stopped at the bar that closed through it, so you can study it later.
- Too many blocks on one side. At most Max active OB per side blocks (4 by default) live on each side. When a fifth bullish block is marked, the oldest bullish block is removed.
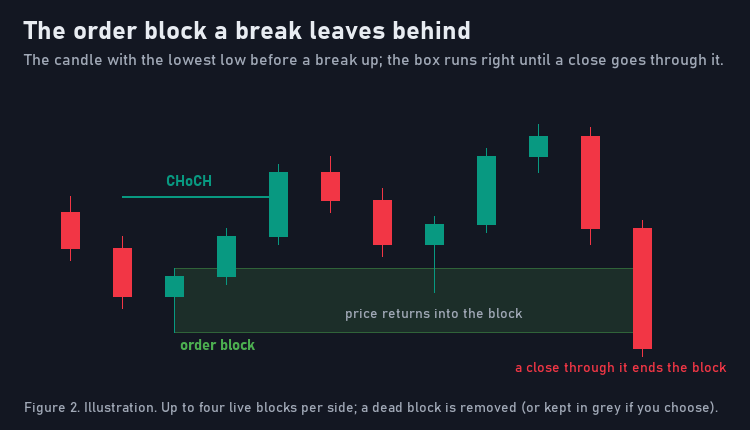
Figure 2. Illustration. A dead block is removed, or kept in grey if you choose.
7. The Retest Arrow
An order block on its own is a zone. The arrow is the event inside that zone. A buy arrow prints on a candle when all of these are true on its close:
- The block is a live bullish block, marked on an earlier bar.
- The candle's low reaches the block: it touches or goes below the block's top.
- The candle closes up: its close is above its open.
- The candle does not close through the block: a close below the block's bottom would end the block instead.
- With Only trade in direction of structure on (the default), the structure is up at that bar.
- The block has not printed an arrow before. Each block gives one arrow at most.
A sell arrow is the mirror image: the high reaches a live bearish block, the candle closes down, it does not close above the block's top, the structure is down, and the block is unused.
Rule 3 does a lot of quiet work. A candle that dips into a bullish block and closes down is price still pushing through the zone. The indicator waits for a candle that shows rejection. Rule 5 keeps the arrows on the side of the current structure; switch it off and you also see the retests against it, which some traders want for counter-trend work and most should leave alone.
All six conditions are checked on the close. An arrow never appears on a forming candle and never disappears once printed.
8. The Plan Levels: Entry, Stop, TP1 and TP2
Each arrow comes with a plan drawn to its right, 20 bars long, with the price printed at the end of each line:
- Entry: the close of the arrow candle (a dotted grey line).
- Stop: beyond the block or the candle, whichever is further, plus a small buffer. For a buy it is the lower of the block's bottom and the candle's low, minus 0.2 times the ATR(14). For a sell it is the higher of the block's top and the candle's high, plus the same buffer.
- Risk: the distance from the entry to the stop.
- TP1: one times the risk from the entry (1R).
- TP2: two times the risk from the entry (2R).
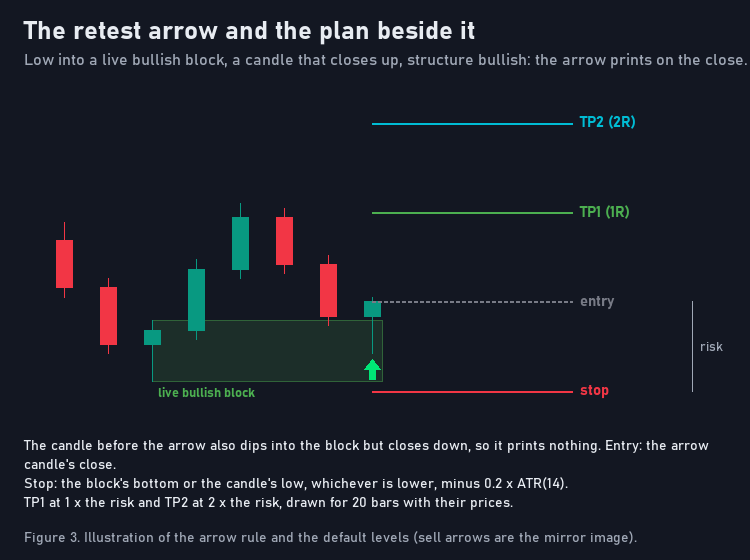
Figure 3. Illustration of the arrow rule and the default levels. Sell arrows are the mirror image.
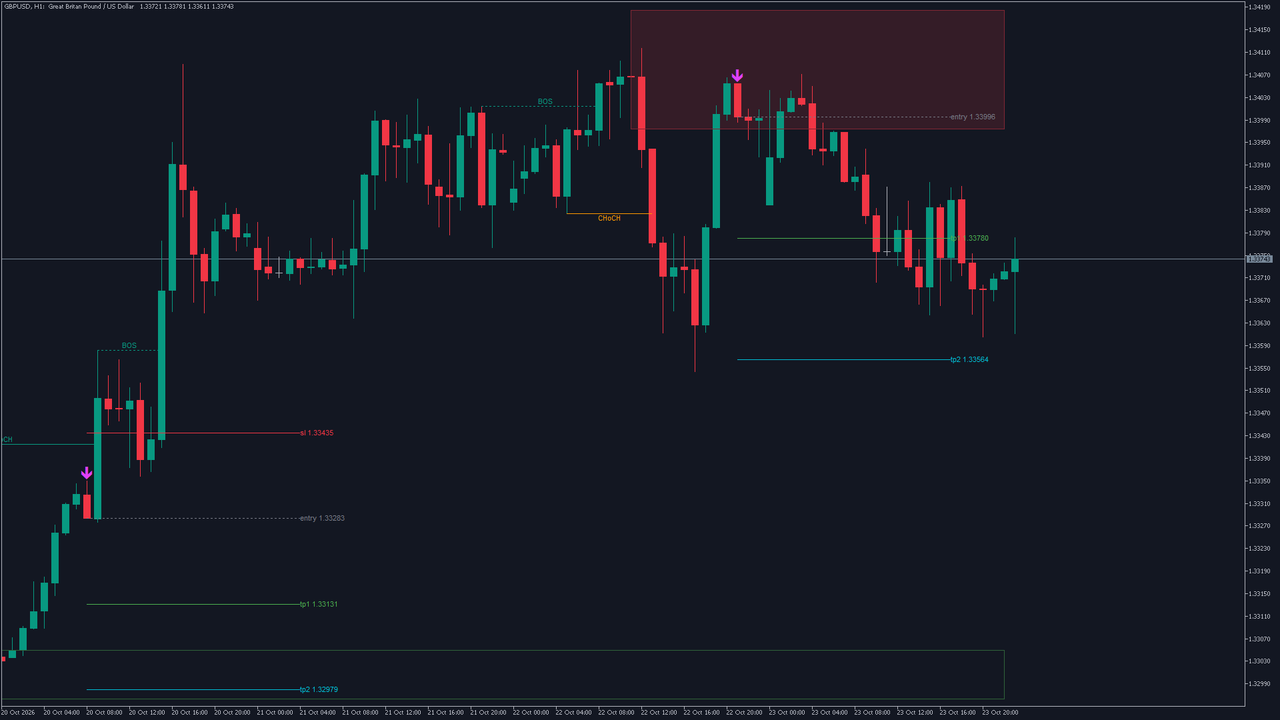
Here is a real one. On GBPUSD H1 (MetaTrader 5, broker demo feed), a sell arrow printed on the bar of 22 October 2026, 21:00 server time. Its plan reads entry 1.33996, stop 1.34212, TP1 1.33780 and TP2 1.33564. The risk is 0.00216, about 21.6 pips; TP1 sits one risk below the entry and TP2 two risks below.
The levels are a plan, not a forecast. The entry is the close of the arrow candle; any order you place will fill at a later price, and on a fast bar that difference can be a meaningful part of the risk. The last five plans stay on the chart (Max trades kept on chart), so older ones clear away on their own.
9. What Repaints and What Does Not
"Does it repaint?" deserves an exact answer, because an indicator that rewrites its past makes every chart example worthless.
Fixed once drawn, all decided on closed bars: - every BOS and CHoCH line and label, - the creation of every order block, - every arrow and its four levels, - every alert.
Expected to change after being drawn, by design: - a live order block's box grows one bar to the right with every new bar, - a block disappears (or turns grey) on the close that goes through it, - the oldest block on a side is removed when a fifth one is marked, - the oldest plan is removed when a sixth one prints, - beyond 500 lines, 500 labels or 200 boxes on the chart, the oldest drawings are removed first (switch Keep object limits off to keep everything).
The built-in lag: a swing is known five bars after it forms (at the default swing length), and a break is known on the close of the breaking candle. Nothing is calculated on the forming bar.
One practical note: the calculation starts at the first bar of the window set by Bars to calculate (5,000 by default). A chart with a different window can show different drawings near the left edge of the window, where the first swings are still being found. Use the same setting on charts you compare.
10. The Settings That Change the Picture Most
Swing length (default 5) sets the size of the swings, as described in section 5.
Create OB only on CHoCH (reversal) (default off) keeps only the blocks where the structure turns. Continuation blocks after a BOS are not marked, so every arrow is a retest of a turn, and there are fewer arrows. Fewer arrows is not the same as better arrows: it is a different question asked of the chart.
Only trade in direction of structure (default on) is the trend filter of section 7. Off, the indicator also prints retests against the current structure.
Max active OB per side (default 4) and Remove OB when mitigated (default on) decide how crowded the chart gets. Keeping mitigated blocks in grey is useful for study and noisy for trading.
The plan settings (SL buffer (x ATR) 0.2, TP1 risk:reward 1.0, TP2 risk:reward 2.0) change only where the levels are drawn. They do not change which arrows print.
11. The Ten-Second Read
Before any decision, read a chart in this order:
- The last label. Its colour is the current structure: teal up, orange down. Whether it says BOS or CHoCH tells you if the structure has just turned or is continuing.
- The live blocks. Where are they against price? In an up-structure, the bullish blocks below price are where buy arrows can come from. Bearish blocks above price are where the structure would be tested if it turned.
- The newest arrow. Its entry, stop and targets are the plan on the table, if it is recent enough to matter.
- What prints next. A candle that dips into a live block in the direction of the structure and closes the right way.
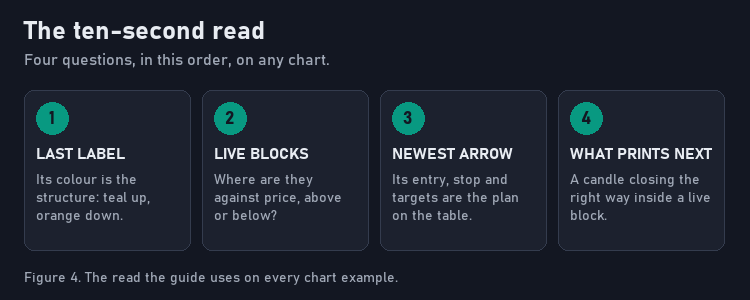
Figure 4. The read every chart example in section 14 follows.
12. A Practical SMC Trading Workflow
The indicator decides what is on the chart. Six decisions stay with you.
Step 1. Read the structure one timeframe up. If you trade H1, look at H4 first with the same indicator. An H1 buy arrow in an H4 up-structure trades with both; the same arrow in an H4 down-structure is a counter-trend trade, whatever H1 says.
Step 2. Find the block worth waiting for. A fresh block, not yet traded, in the direction of both structures, with room to the next opposing block for at least the first target.
Step 3. Wait for the close. Set the alert and let the arrow come to you. Entering while the candle is still inside the block is entering before the rule has decided (see section 13).
Step 4. Check the plan against your account. The stop distance is drawn for you. Decide your risk per trade in money, divide it by the stop distance's value per lot, and round down to the broker's lot step. If the result is below the minimum lot, or the spread is a large share of the risk, skip the trade.
Step 5. Place the order yourself. A market order after the close, or a limit order at the entry price if you prefer to wait for it. Put the stop where the plan draws it.
Step 6. Manage by a rule you chose before the entry. At TP1, either take part off and move the stop to the entry, or close everything, or hold for TP2. Any of the three can work; switching between them trade by trade is what turns a plan into guesswork. Decide in advance as well what an opposite CHoCH means for an open trade.
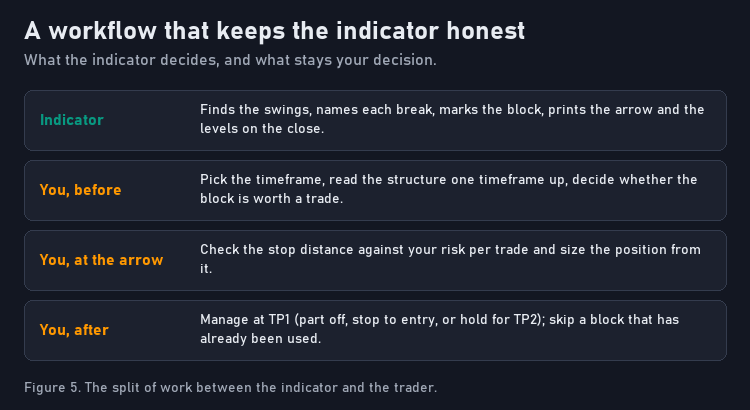
Figure 5. What the indicator decides, and what stays your decision.
13. Three Mistakes That Cost the Most
Trading every arrow as if it were the same. An arrow with the higher timeframe behind it and an arrow against it look identical on the lower chart. Step 1 of the workflow exists for this reason.
Entering before the close. A candle inside a block that is going to print a buy arrow and a candle that is going to close through the block look the same until the close. The indicator waits; a trader who does not is taking a different trade from the one the arrow describes.
Moving the stop. The stop is placed beyond the block on purpose: if price closes through the block, the reason for the trade is gone. Widening the stop as price approaches it keeps a trade alive that the method itself has already closed.
14. Real Chart Examples
The captures below are real charts with the indicator at its default inputs: nine from MetaTrader 5 and one from MetaTrader 4, all from broker demo feeds, captured on 25 October 2026. Times are broker server time. Each subsection reports the facts of the moment of capture: the structure, the live blocks and the newest arrow with its plan. They show how to read the indicator; they are not records of trades.
EURUSD H1, MetaTrader 5
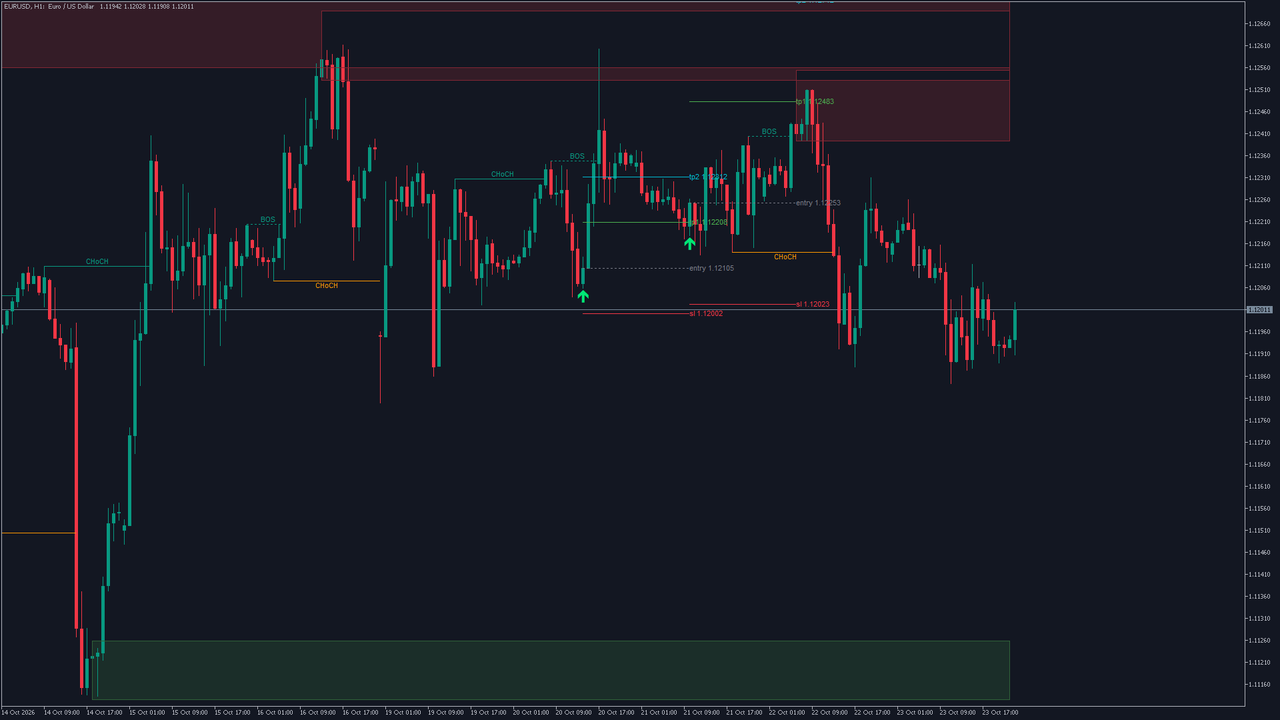
Structure: down. Live blocks: one bullish, four bearish. The newest arrow is a buy from 21 October, 10:00, with entry 1.12253, stop 1.12023, TP1 1.12483 and TP2 1.12712. After it, an orange CHoCH turned the structure down, so with the trend filter on no further buy arrows can print until a teal CHoCH turns it back. This is the ten-second read in action: the newest arrow and the current structure disagree, and the label tells you which is newer.
GBPUSD H1 close-up, MetaTrader 5
Structure: down. Live blocks: three bullish, one bearish. The newest arrow is the sell from section 8 (22 October, 21:00): entry 1.33996, stop 1.34212, TP1 1.33780, TP2 1.33564. The close-up shows the whole sequence on one screen: the orange CHoCH that turned the structure down, the bearish block above it, the candle that reached into the block and closed down, and the plan to its right.

Gold (XAUUSD) H1, MetaTrader 5
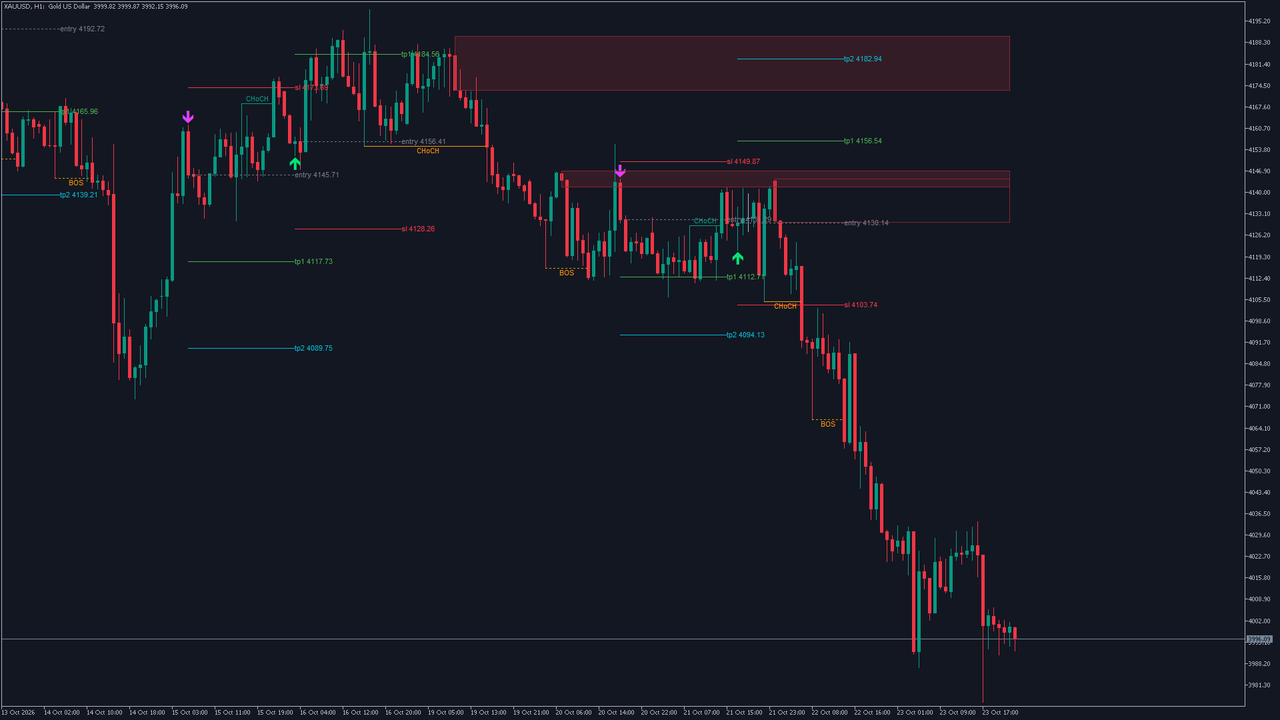
Structure: down. Live blocks: none bullish, four bearish. The newest arrow is a buy from 21 October, 17:00: entry 4130.14, stop 4103.74, TP1 4156.54, TP2 4182.94, a risk of 26.40. Since then the structure has turned down and four bearish blocks sit above price. In a chart like this the read is simple: the buy plan belongs to a structure that no longer exists, and the next arrow, if any, would be a sell from one of those four blocks.
Gold (XAUUSD) H4, MetaTrader 5
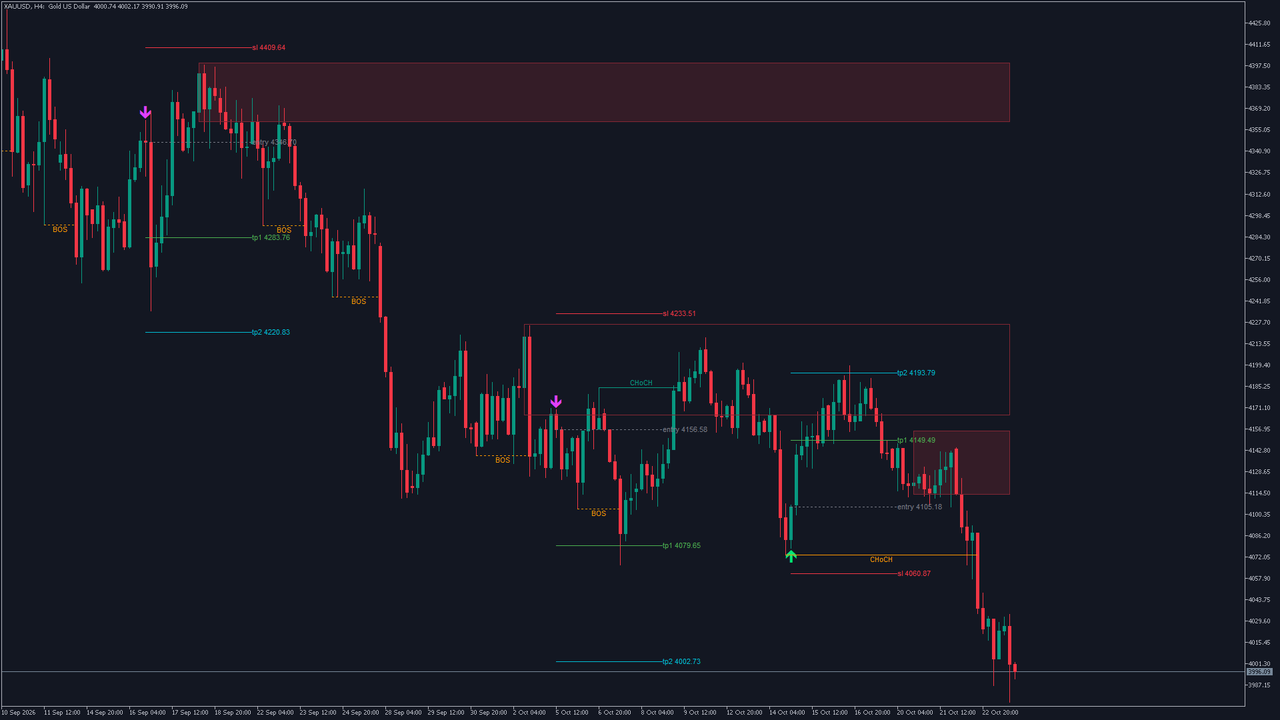
The same market one timeframe up, as step 1 of the workflow asks. Structure: down. Live blocks: none bullish, four bearish. The newest arrow is a buy from 14 October, 20:00: entry 4105.18, stop 4060.87, TP1 4149.49, TP2 4193.79. H1 and H4 agree on a down-structure, so on this pair of charts a sell arrow on H1 would trade with both timeframes and a buy arrow against both.
EURUSD M15, MetaTrader 5
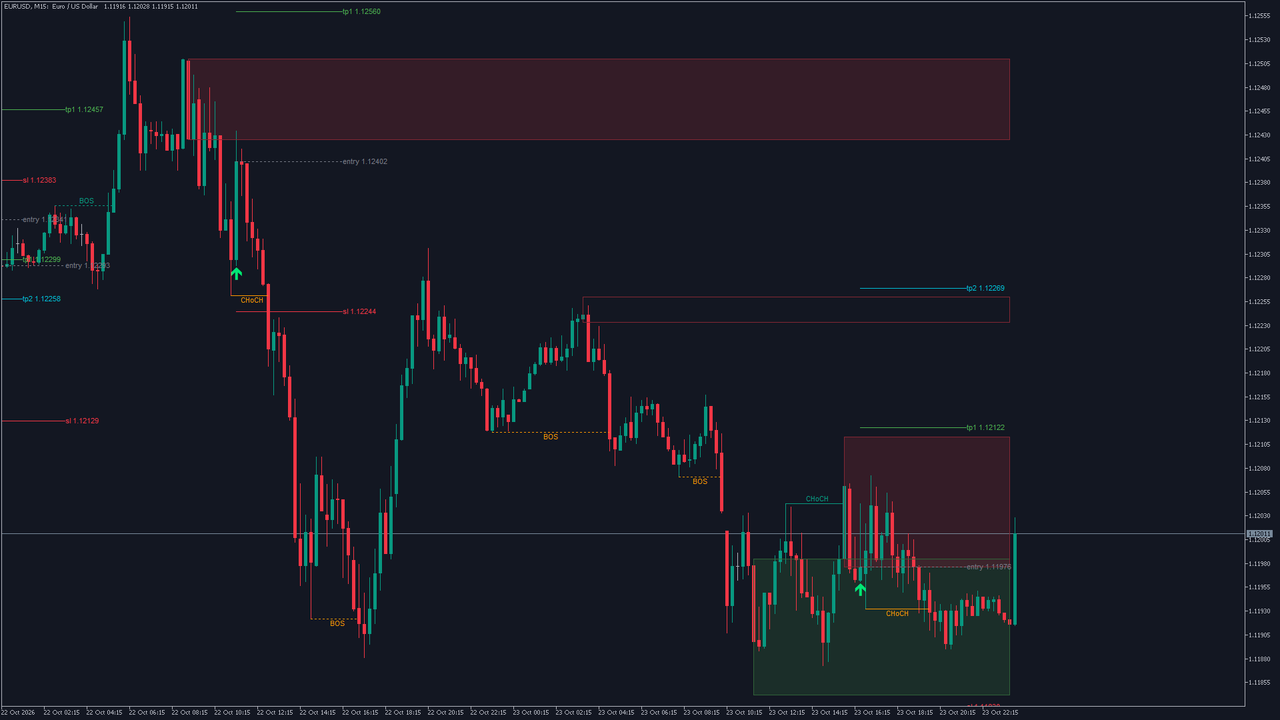
Structure: down. Live blocks: one bullish, four bearish. The newest arrow is a buy from 23 October, 16:30: entry 1.11976, stop 1.11830, TP1 1.12122, TP2 1.12269. On M15 the same swing length of 5 covers about an hour and a quarter on each side of a swing, so structure turns more often than on H1 and the plans are tighter: this stop is 14.6 pips from the entry.
Nasdaq 100 H1, MetaTrader 5
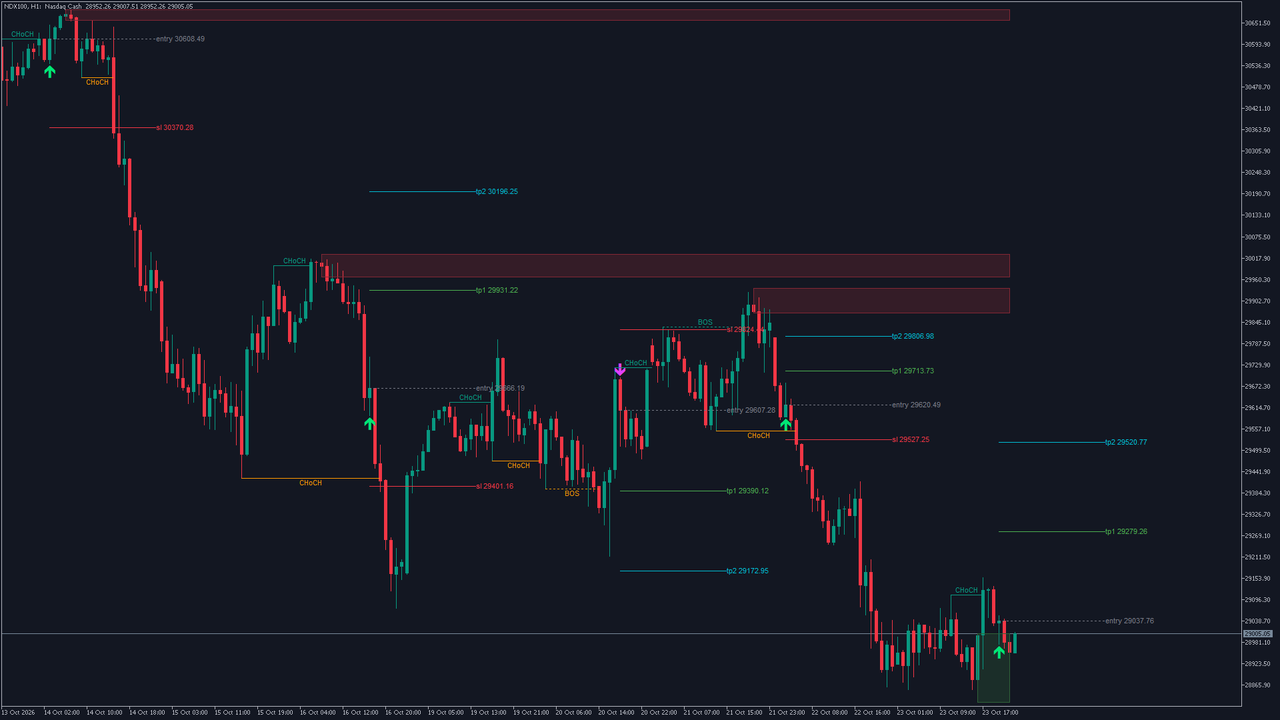
Structure: up. Live blocks: one bullish, three bearish. The newest arrow is a buy from 23 October, 20:00, close to the right edge of the chart: entry 29037.76, stop 28796.26, TP1 29279.26, TP2 29520.77. Here the newest arrow and the current structure agree, and the three bearish blocks above price mark where the up-structure would be tested.
Bitcoin H1, MetaTrader 5
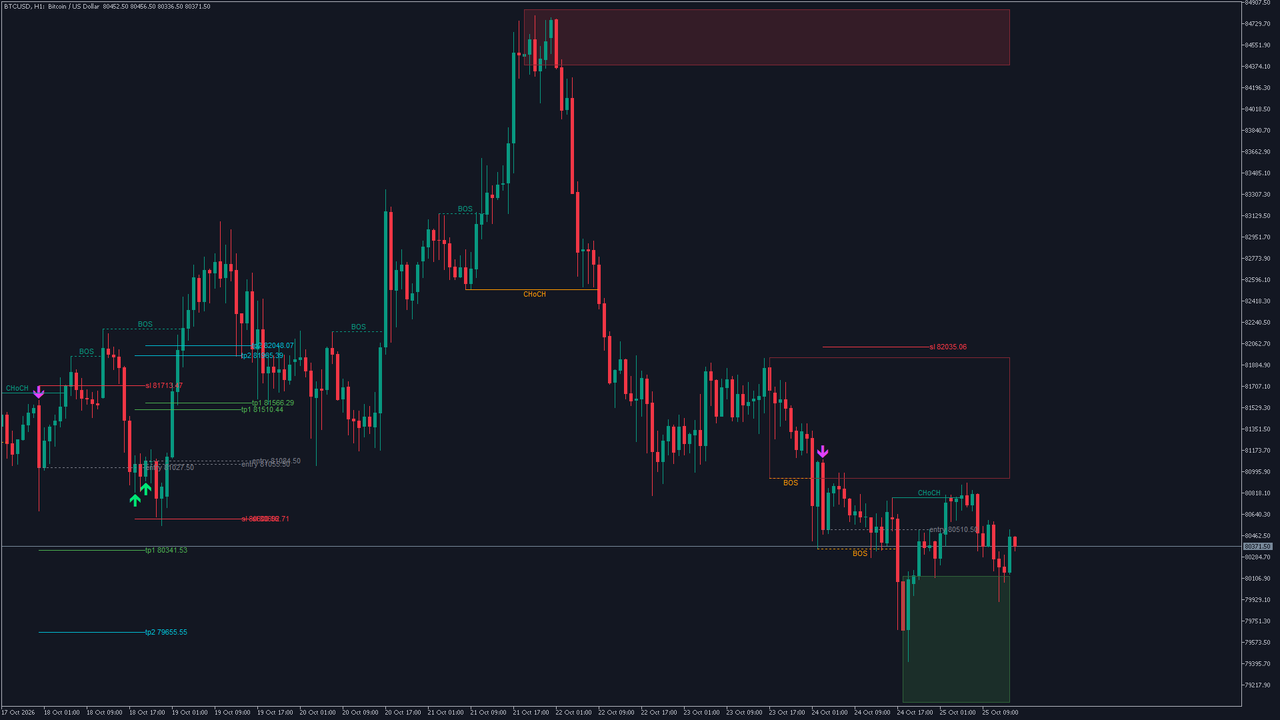
Structure: up. Live blocks: one bullish, three bearish. The newest arrow is a sell from 24 October, 03:00: entry 80510.50, stop 82035.06, TP1 78985.94, TP2 77461.38. The plan is wide in price because the stop sits beyond a bearish block plus 0.2 ATR on a volatile market. Step 4 of the workflow matters most on charts like this one: the position size has to come from that distance.
DAX 40 H1, MetaTrader 5
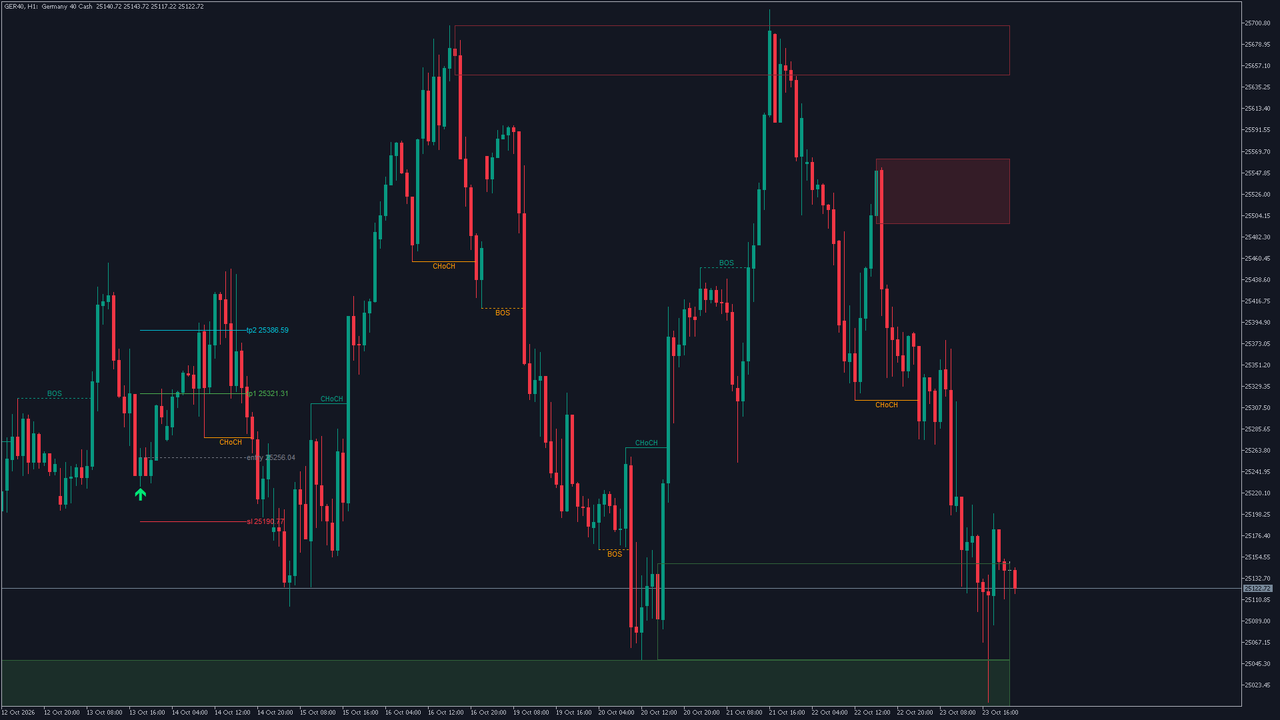
Structure: down. Live blocks: three bullish, three bearish. The newest arrow is a buy from 13 October, 18:00: entry 25256.04, stop 25190.77, TP1 25321.31, TP2 25386.59. Twelve days without a new arrow on an active index shows how selective the rules are: the structure turned more than once in that time, and still no candle met all six conditions of section 7 at a live, unused block.
USDJPY H1, MetaTrader 5
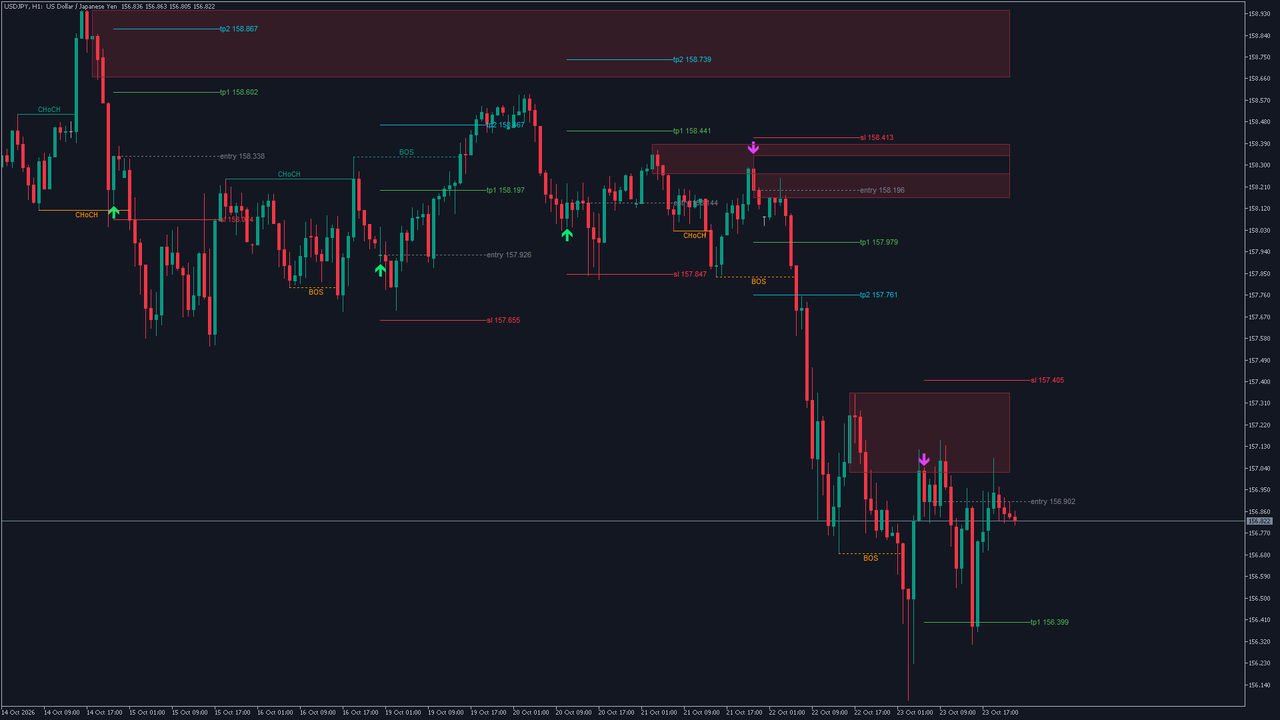
Structure: down. Live blocks: none bullish, four bearish. The newest arrow is a sell from 23 October, 06:00: entry 156.902, stop 157.405, TP1 156.399, TP2 155.896. Arrow and structure agree, and the sell came from one of the bearish blocks above price after the structure turned down.
EURUSD H1, MetaTrader 4
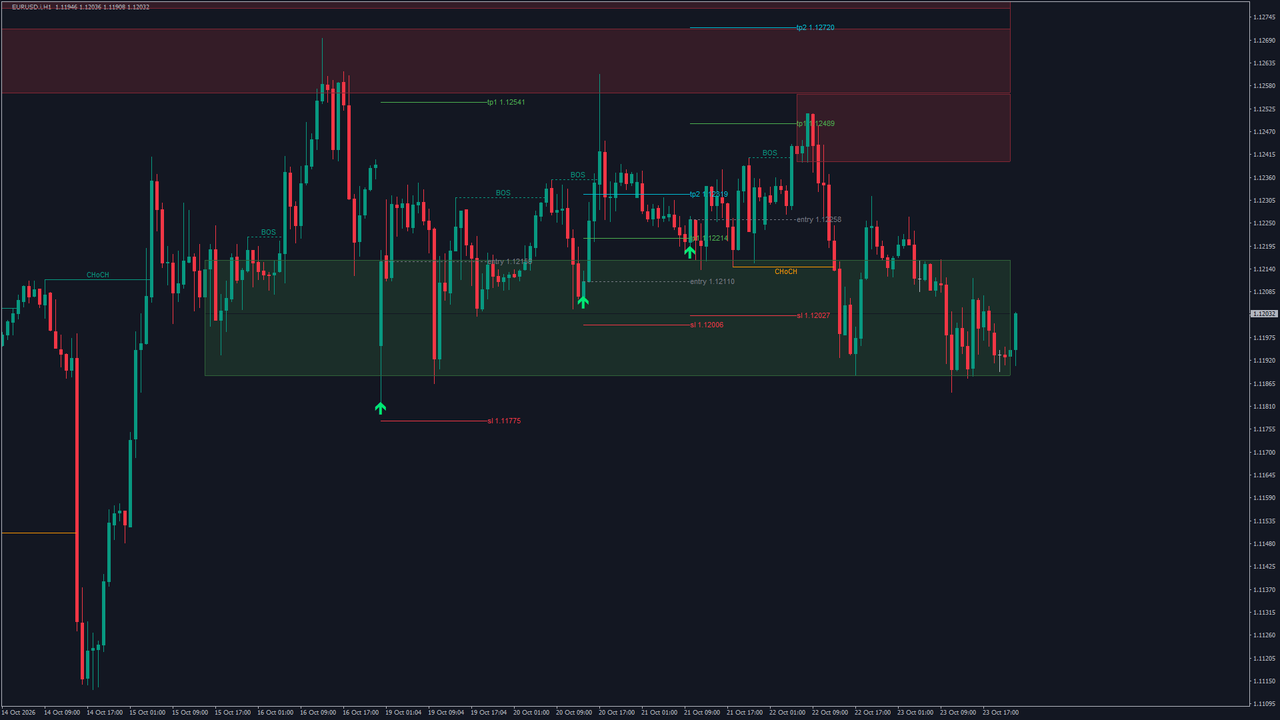
The MetaTrader 4 version on a different broker's demo feed. Structure: down. Live blocks: one bullish, three bearish. The newest arrow is the same buy as on MetaTrader 5, on the bar of 21 October, 10:00, with entry 1.12258, stop 1.12027, TP1 1.12489 and TP2 1.12720. The prices differ from the MetaTrader 5 example by a few points because the two brokers' quotes differ; the arrow lands on the same bar because the rules are the same.
15. Alerts
Four events can alert, each with its own switch, and every alert is evaluated on a closed bar:
- a buy (bullish order block retest),
- a sell (bearish order block retest),
- a bullish CHoCH,
- a bearish CHoCH.
The message names the event, the symbol, the timeframe and the close of the bar:
BUY (bullish OB retest) on <symbol> <timeframe> @ <close> SELL (bearish OB retest) on <symbol> <timeframe> @ <close> Bullish CHoCH on <symbol> <timeframe> @ <close> Bearish CHoCH on <symbol> <timeframe> @ <close>
A real one, from the EURUSD H1 example: BUY (bullish OB retest) on EURUSD H1 @ 1.12253 .
The channels are a popup window (on by default), a sound (on; it plays only when the popup is off, because the popup has its own sound), a push notification to the MetaTrader mobile app (off) and an e-mail (off). Push and e-mail use the terminal's own settings under Tools > Options. Each event fires once per bar, and no alert fires for history or in the Strategy Tester.
16. Installation from the MQL5 Market
Install directly from the MQL5 Market; no manual file copying is required.
- Open the product page for your platform (the links are in sections 1, 4 and 18).
- Buy the indicator on the product page. A free demo is available on the Market page if you want to try it in the Strategy Tester first; alerts stay silent there by design.
- The indicator installs automatically into your terminal through your MQL5 account.
- In MetaTrader, find it in Navigator > Indicators > Market. If it does not appear yet, restart MetaTrader or refresh the Navigator.
- Drag it onto a chart, review the inputs and click OK.
17. Parameter Reference
All 44 inputs, in dialog order and grouped as they appear in the settings. The user manual explains each one in more depth.
Market Structure (BOS / CHoCH)
| Input | Default | What it does |
|---|---|---|
| Swing length | 5 | Bars on each side that a swing high or low must beat; also the confirmation delay |
| Show structure lines + labels | true | Draws the BOS and CHoCH lines and labels |
| Show BOS | true | Draws the continuation breaks |
| Show CHoCH | true | Draws the breaks that turn the structure |
Order Blocks
| Input | Default | What it does |
|---|---|---|
| Show order blocks | true | Marks blocks; off also stops the arrows, which come from blocks |
| Create OB only on CHoCH (reversal) | false | Marks blocks only at a change of character |
| Only trade in direction of structure | true | Buy arrows only in an up-structure, sell arrows only in a down-structure |
| Max active OB per side (1-20) | 4 | Live blocks kept per side; the oldest goes first |
| Remove OB when mitigated | true | Removes a block that is closed through; off keeps it in grey |
Signals
| Input | Default | What it does |
|---|---|---|
| Show entry arrows | true | Draws the buy and sell arrows (the plans and alerts do not depend on it) |
SL / TP
| Input | Default | What it does |
|---|---|---|
| Show SL/TP with arrows | true | Draws the entry, stop and target lines for each arrow |
| ATR length | 14 | ATR period behind the stop buffer |
| SL buffer (x ATR) | 0.2 | Extra distance beyond the block or candle for the stop |
| TP1 risk:reward | 1.0 | TP1 distance in multiples of the risk |
| TP2 risk:reward | 2.0 | TP2 distance in multiples of the risk |
| Show TP2 | true | Draws the second target |
| SL/TP line length (bars) | 20 | How far to the right the plan lines run |
| Max trades kept on chart (1-50) | 5 | Plans kept on the chart; the oldest goes first |
| Show price in labels | true | Prints the price after entry, sl, tp1 and tp2 |
Colors
| Input | Default | What it does |
|---|---|---|
| Bullish OB fill | #4CAF50 | Green fill of bullish blocks (shaded over your chart background) |
| Bullish OB border | #4CAF50 | Border of bullish blocks |
| Bearish OB fill | #F23645 | Red fill of bearish blocks |
| Bearish OB border | #F23645 | Border of bearish blocks |
| Mitigated OB (if kept) | #787B86 | Grey of a block kept after it was closed through |
| Bullish BOS/CHoCH | #089981 | Teal of breaks up |
| Bearish BOS/CHoCH | #FF9800 | Orange of breaks down |
| Buy arrow | #00E676 | Green buy arrows |
| Sell arrow | #E040FB | Magenta sell arrows |
| Entry line | #787B86 | Grey dotted entry line |
| SL line | #F23645 | Red stop line |
| TP1 line | #4CAF50 | Green TP1 line |
| TP2 line | #00BCD4 | Cyan TP2 line |
MetaTrader
| Input | Default | What it does |
|---|---|---|
| Bars to calculate (0 = all) | 5000 | The calculation window; 0 uses the whole history |
| Keep object limits (500 lines, 500 labels, 200 boxes) | true | Removes the oldest drawings beyond these counts; off keeps everything |
| Label font size | 8 | Size of the BOS, CHoCH and price labels (6 to 20) |
Alerts
| Input | Default | What it does |
|---|---|---|
| Enable alerts | true | Master switch for every alert |
| Alert: buy (bullish OB retest) | true | Alert on each buy arrow |
| Alert: sell (bearish OB retest) | true | Alert on each sell arrow |
| Alert: bullish CHoCH | true | Alert when the structure turns up |
| Alert: bearish CHoCH | true | Alert when the structure turns down |
| Channel: popup window | true | MetaTrader's alert window, with its sound |
| Channel: sound | true | A sound when the popup is off |
| Channel: push notification | false | To the MetaTrader mobile app |
| Channel: e-mail | false | To the address set in the terminal |
18. Conclusion
Smart money concepts are only as useful as the consistency with which they are applied. SMC Algo Spartan applies them the same way on every chart and every bar: swings confirmed by a fixed number of bars, every break named BOS or CHoCH by the structure before it, an order block marked for each break and ended by the close that goes through it, and a retest arrow only when a candle reaches into a live block, closes the right way and agrees with the structure. Each arrow arrives with an entry, a stop beyond the block and two targets, and all of it is decided on closed bars.
What it leaves to you is the part no indicator should take over: reading the higher timeframe, choosing which blocks are worth a trade, sizing the position from the stop and managing the trade by a rule you set in advance. If you want a smart money concepts indicator for MT4 and MT5 that marks structure and order blocks by fixed rules and shows its plan, the product pages have the full details:
MetaTrader 5: SMC Algo Spartan MT5
MetaTrader 4: SMC Algo Spartan MT4
Questions about the settings or the workflow are welcome in the comments below.
Risk Disclaimer
Trading foreign exchange, CFDs, indices, commodities and cryptocurrencies on margin carries a high level of risk and may not be suitable for every investor. You can lose some or all of the money you trade with. SMC Algo Spartan is an analysis tool: it does not trade, and no arrow, level or alert is a recommendation to buy or sell. Past chart behaviour does not indicate future results. Test any approach on a demo account first and trade only with money you can afford to lose.