Panther Trade Scenario indicator trade review on XAUUSD from May 18 to 22, 2026

Today we will review trades based on the indicator Panther Trade Scenario on XAUUSD for the week from May 18 to 22, 2026, and see how a ready-made scenario on the chart helps make decisions without guesswork or unnecessary doubts.
The report will show all situations formed by the indicator signals: where the entry appeared, where the risk was predefined, what target was built into the scenario, and how each trade eventually played out. This format allows you to evaluate not only the weekly result but also the working principle of Panther Trade Scenario in real market conditions.
✅ Main result (with filters applied)
+ 8102 pips in one week
With 2 losing trades
Win Rate: 85.7%
XAUUSD review
The first signal for XAUUSD was received on May 18 for a sell trade. The Panther Trade Scenario indicator formed a short scenario: the price was located in the Short only zone, and the direction on the panel was identified as bearish. However, the signal appeared at 22:46 GMT, which was already outside trading hours. According to the trading rules, such entries are not not considered, so the signal was classified as weak and the trade was deliberately skipped.
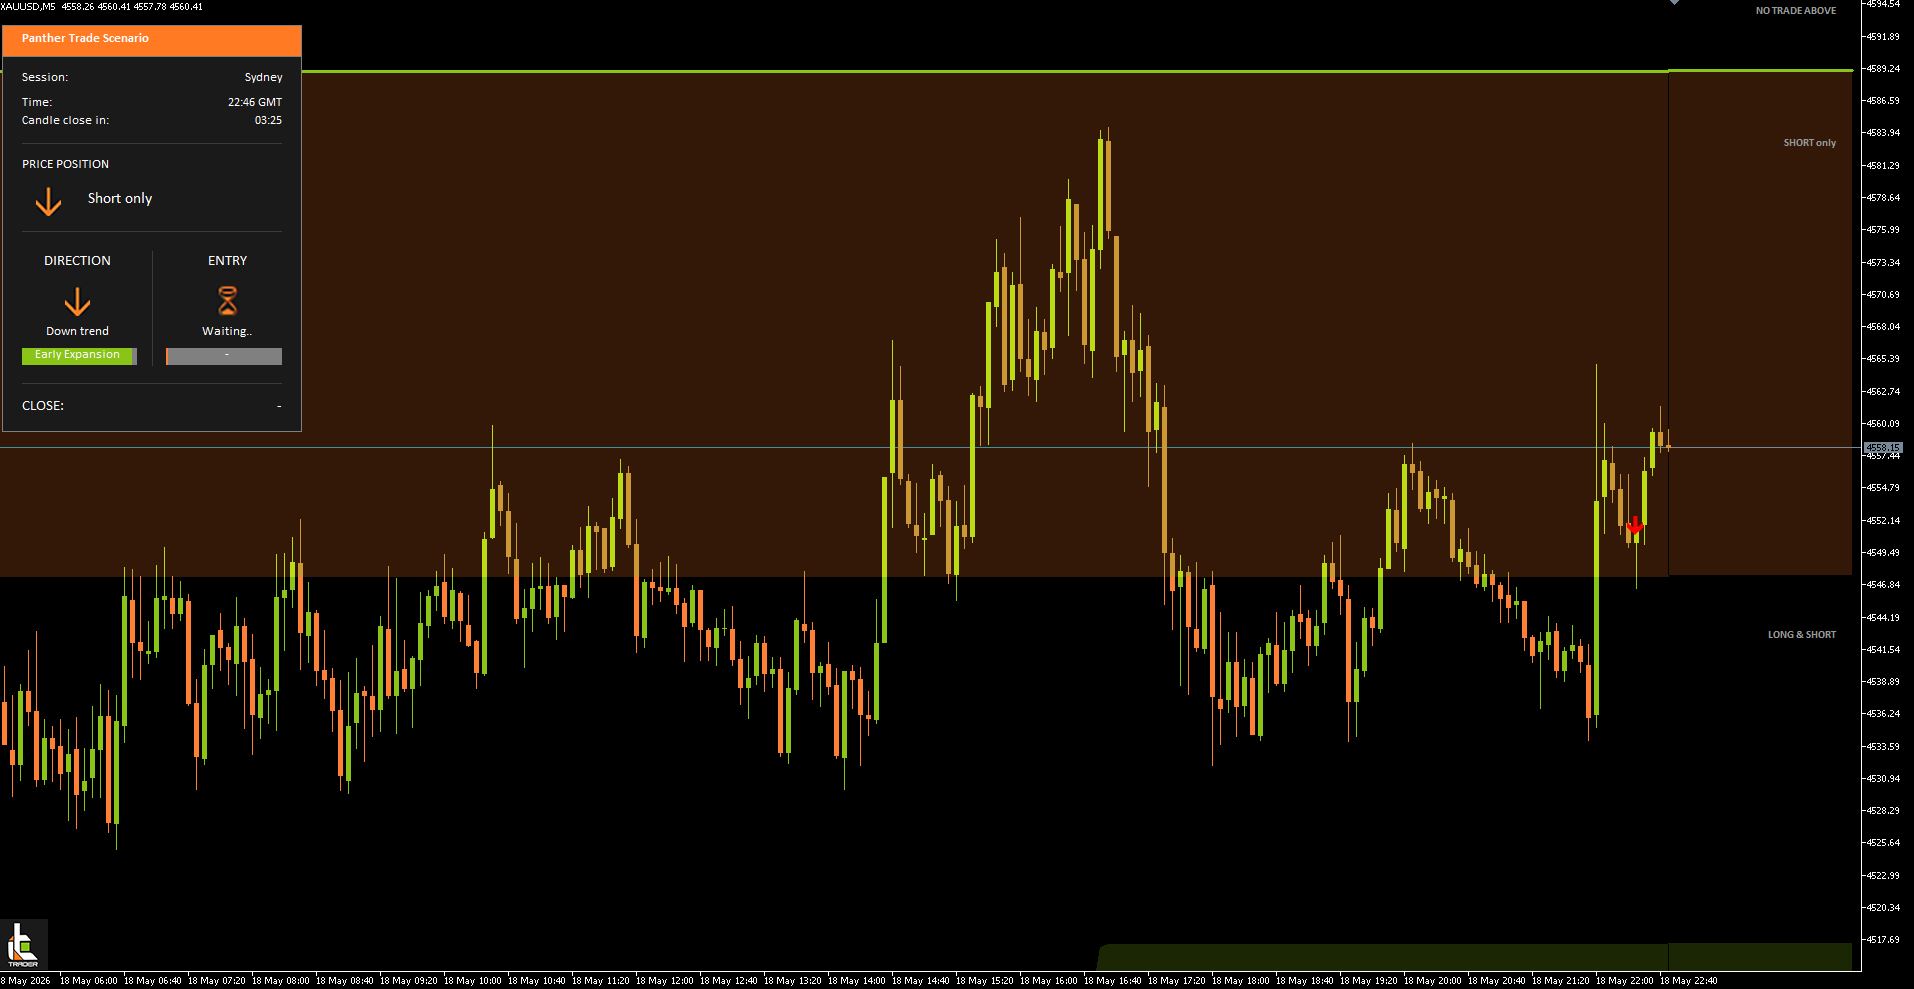
Fig. 1. The trade was not opened: a weak signal formed outside trading hours
The next two signals were also received for sell trades, but both were classified as weak. The first one formed late in the evening on May 18, after trading hours had already ended. The second signal appeared during the night session on May 19, also outside the Panther Trade Scenario trading window. Although the indicator showed a short scenario, according to the trading rules such entries are not considered, so both trades were deliberately skipped.
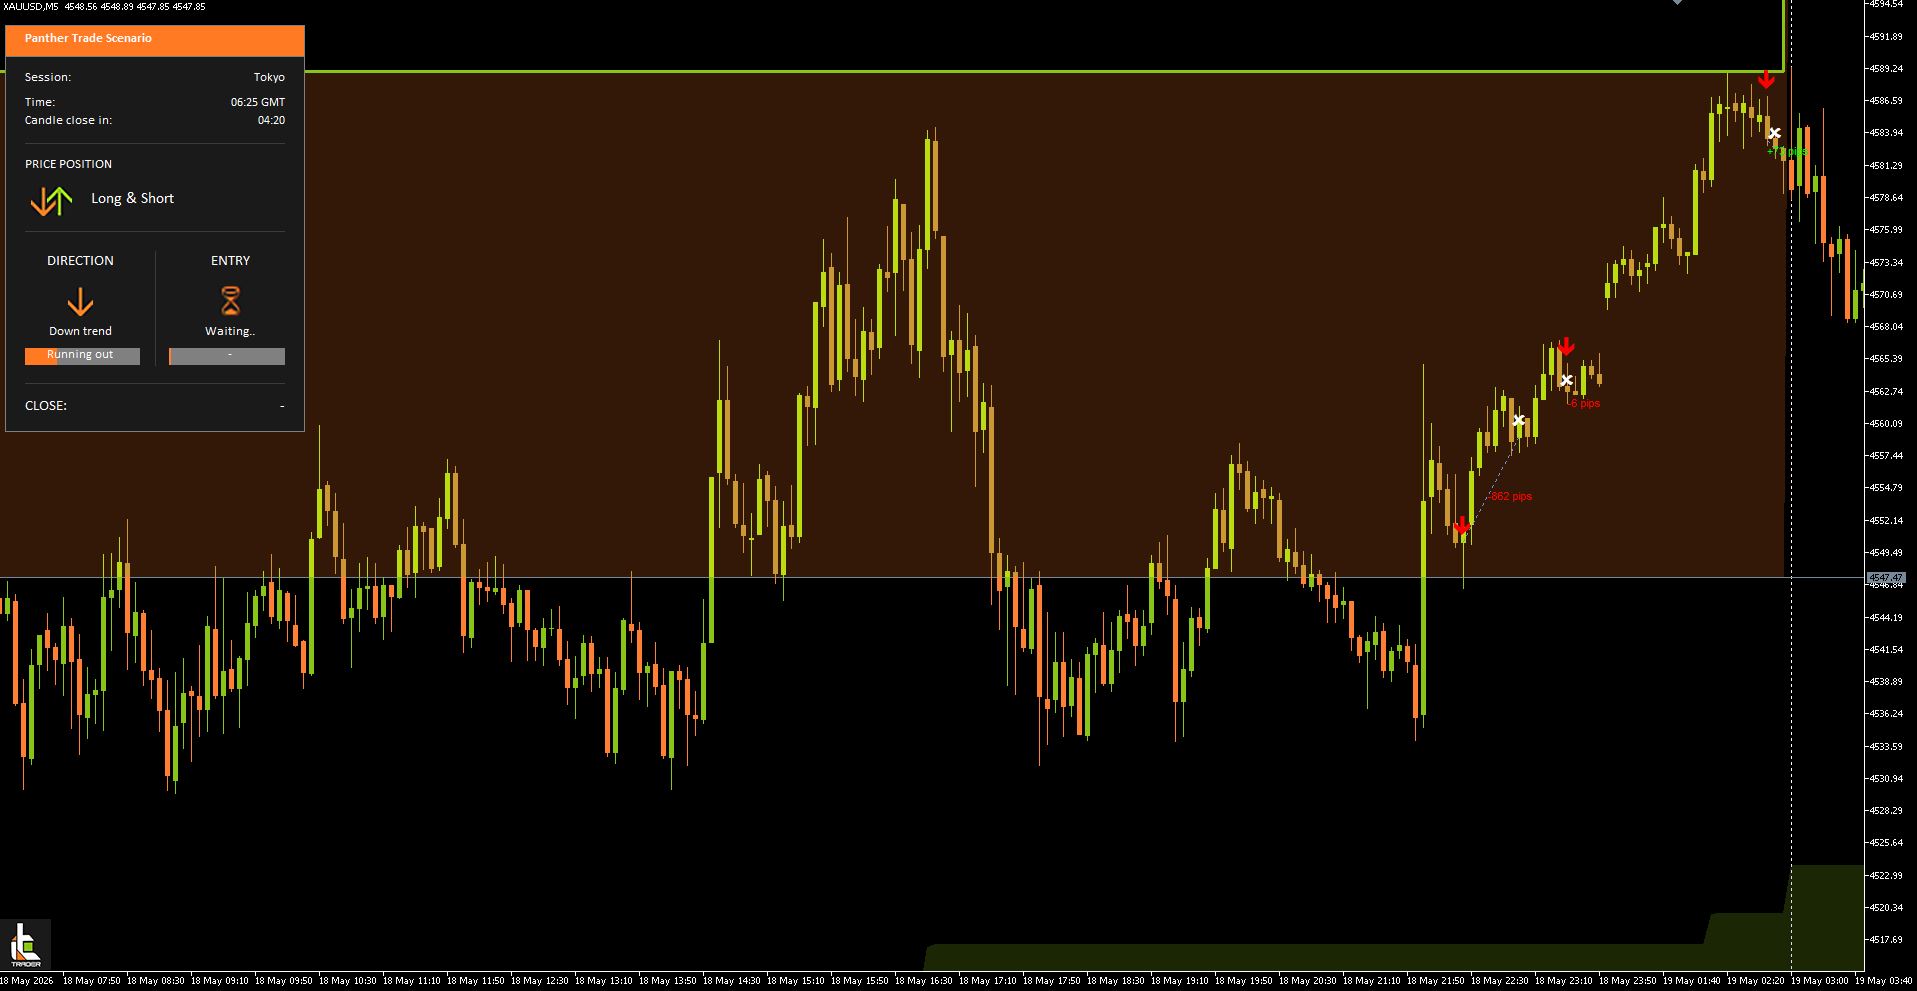
Fig. 2. Trades were not opened: weak signals formed outside trading hours
The next signals for XAUUSD were received on May 19 for sell trades. The first entry formed after the price started developing a bearish movement, while confirmation for a sell trade in line with the current structure appeared on the lower timeframe.
The second trade was opened after a local pullback, when the Panther Trade Scenario indicator once again formed confirmation on the lower timeframe. The price continued moving downward, so the second entry also moved in the direction of the signal and was closed with a profit.
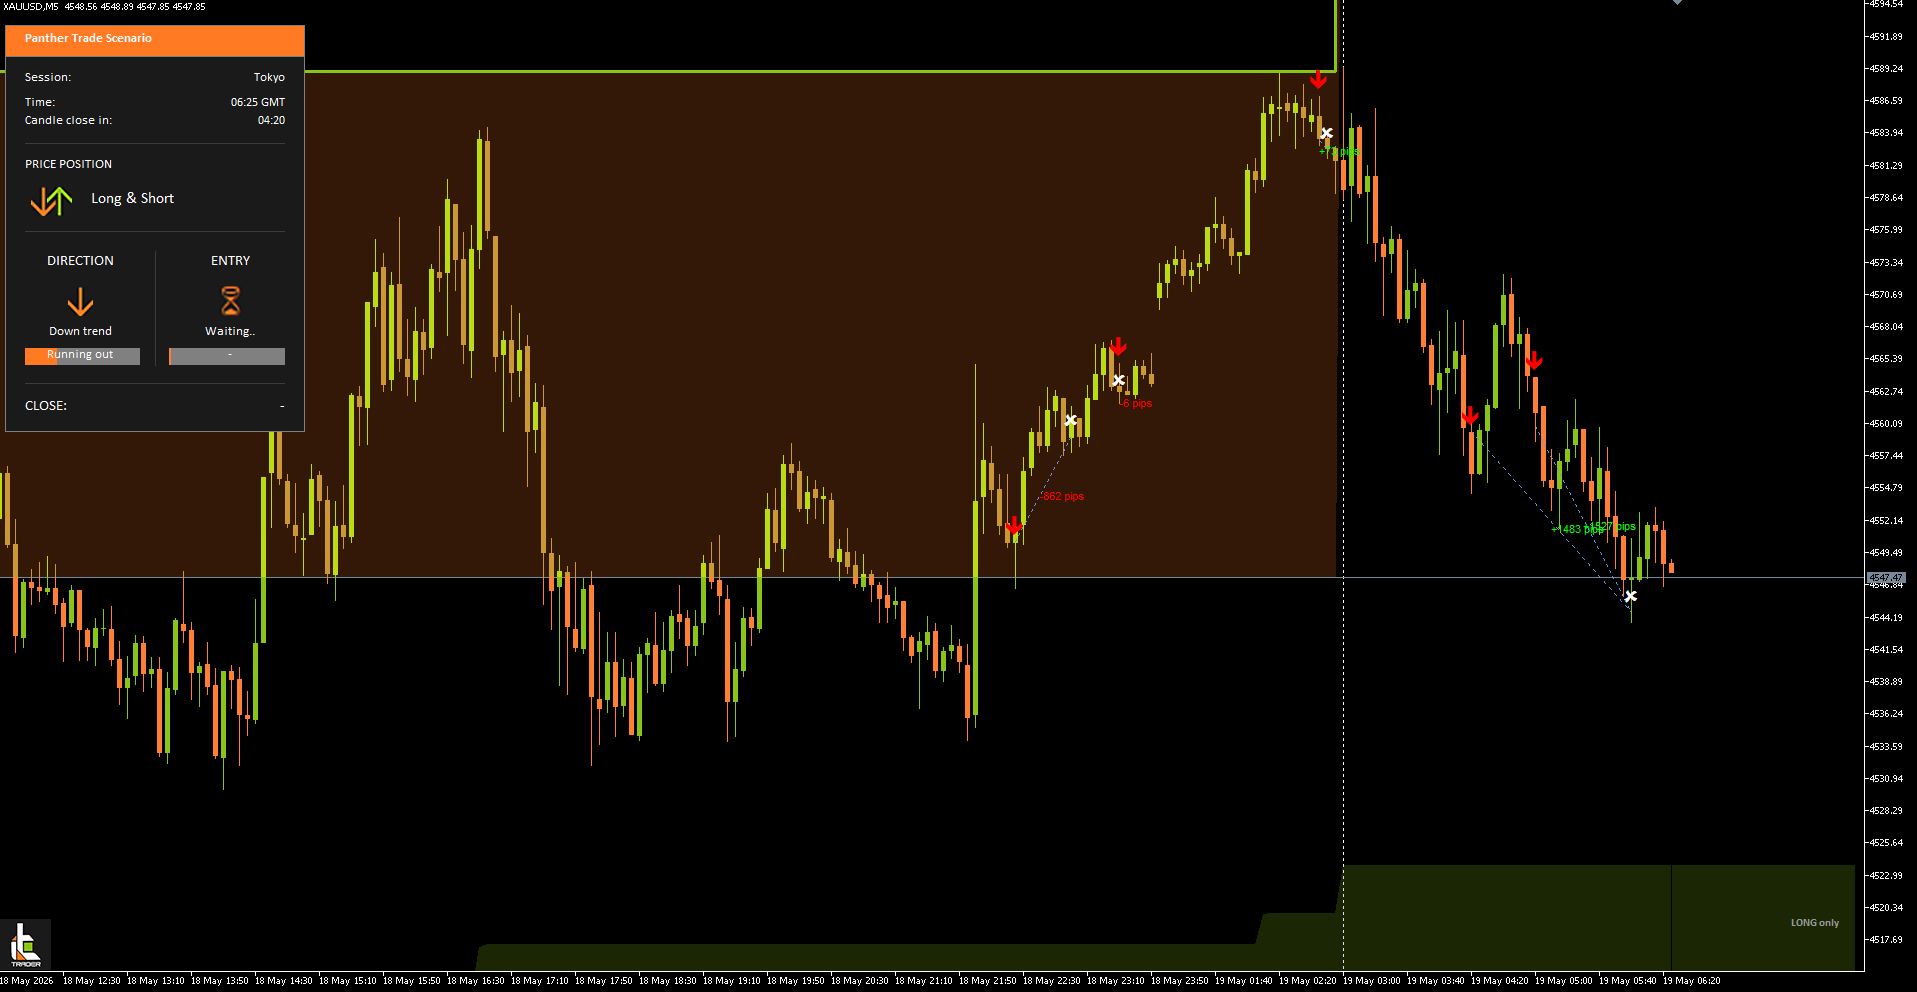
Fig. 3. Both trades closed with profit, the total result was +3010 pips
The next three signals were received on May 20–21 for sell trades. The Panther Trade Scenario indicator showed a short scenario, however all three signals appeared outside trading hours. According to the selection rules, only signals formed between 04:00 and 15:00 GMT qualify for trading. The first signal appeared late in the evening on May 20, while the next two appeared during the night session on May 21, so all of them were classified as weak and no trades were opened.
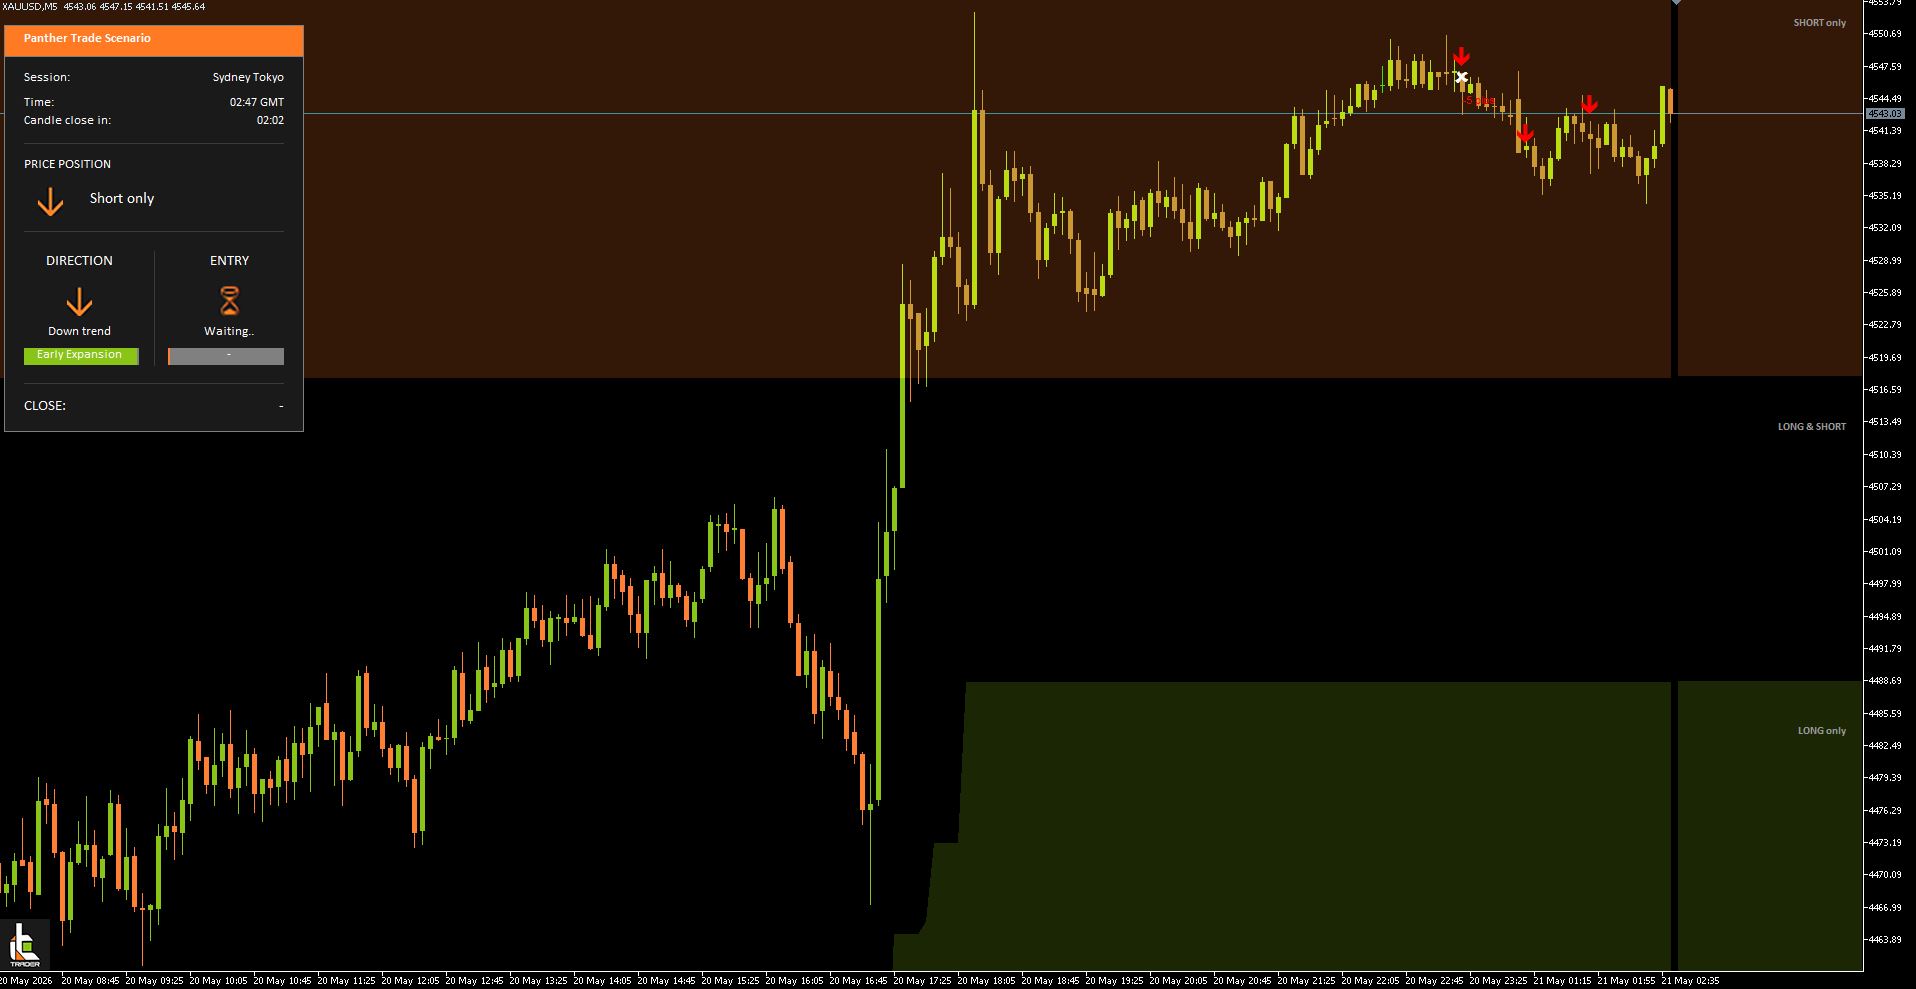
Fig. 4. Trades were not opened: three weak signals formed outside trading hours 04:00–15:00 GMT
The next signal was received for a buy trade and was classified as strong. After the structure changed, the Panther Trade Scenario indicator identified the beginning of a bullish movement and formed a scenario in the direction of the new trend. Confirmation for an entry appeared on the lower timeframe, so the trade was opened at the very beginning of the upward movement.
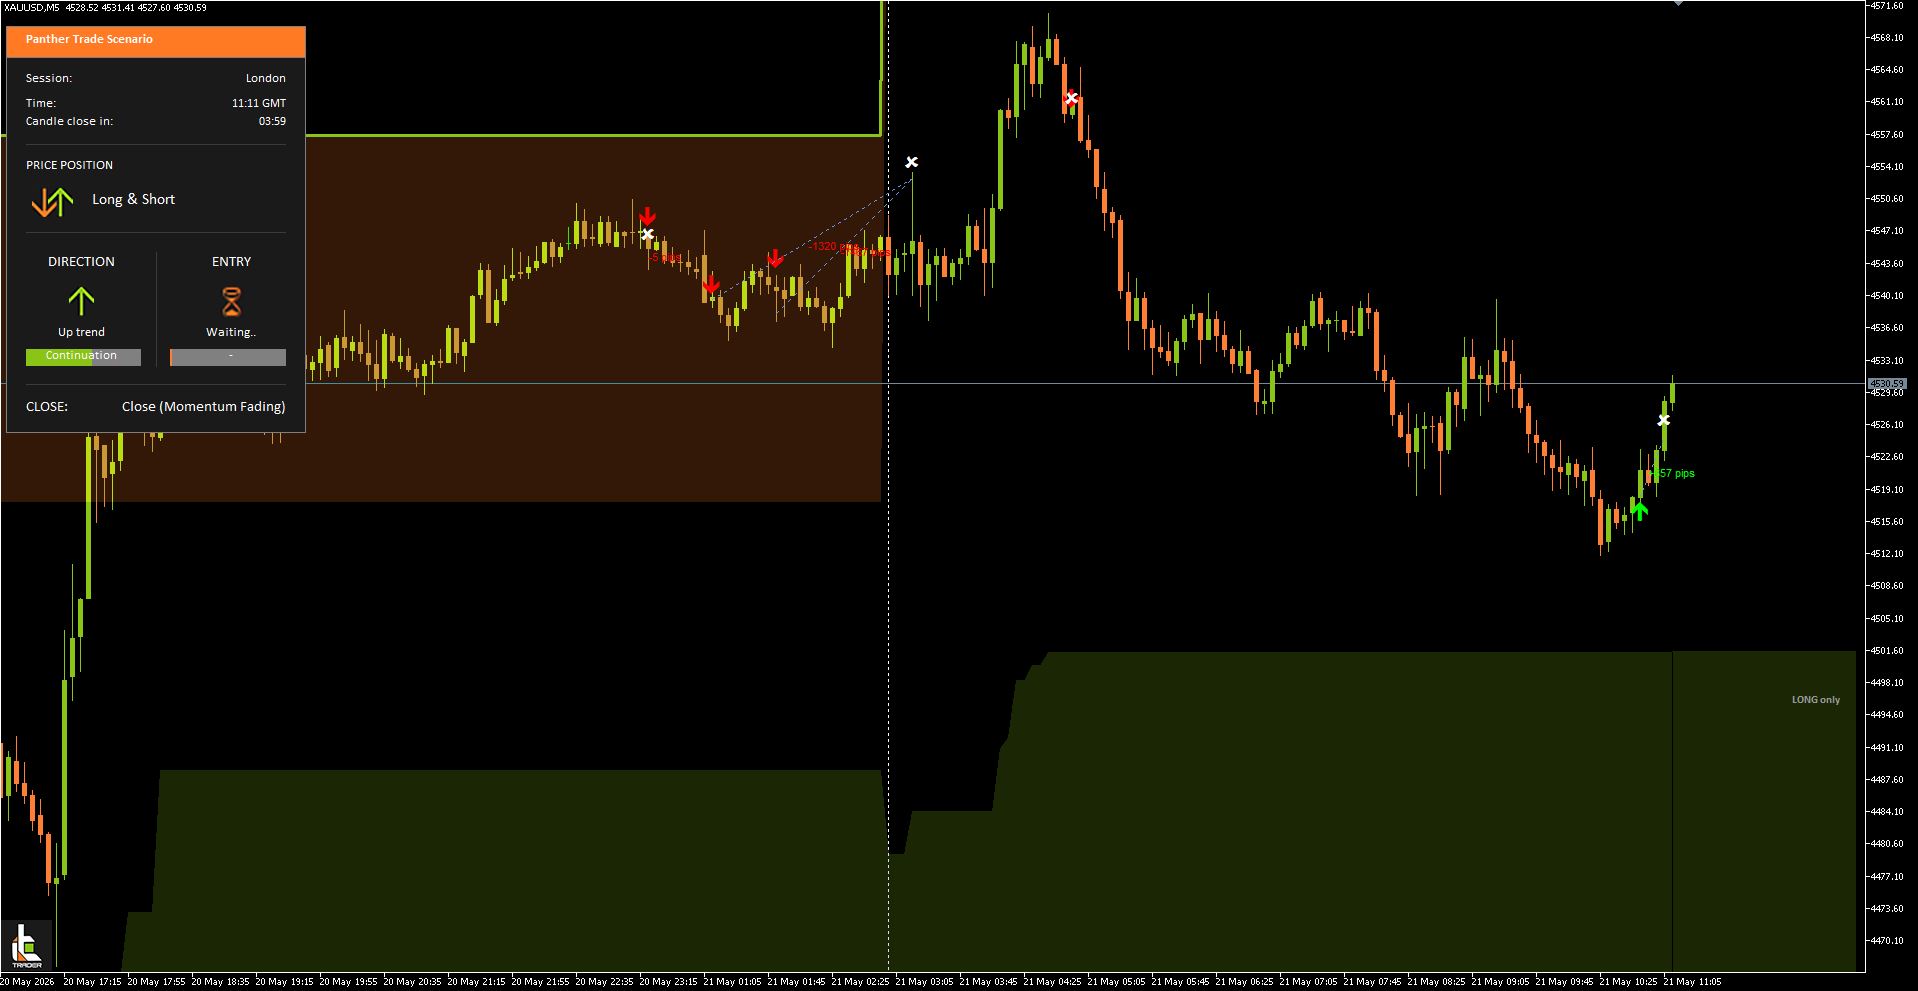
Fig. 5. The trade closed with a profit of +657 pips
The next signal was received for a buy trade, however it was classified as weak. The signal appeared at 16:15 GMT, which was already after the end of the trading window. According to the Panther Trade Scenario rules, only signals formed between 04:00 and 15:00 GMT qualify for trading, therefore no trade was opened based on this signal.
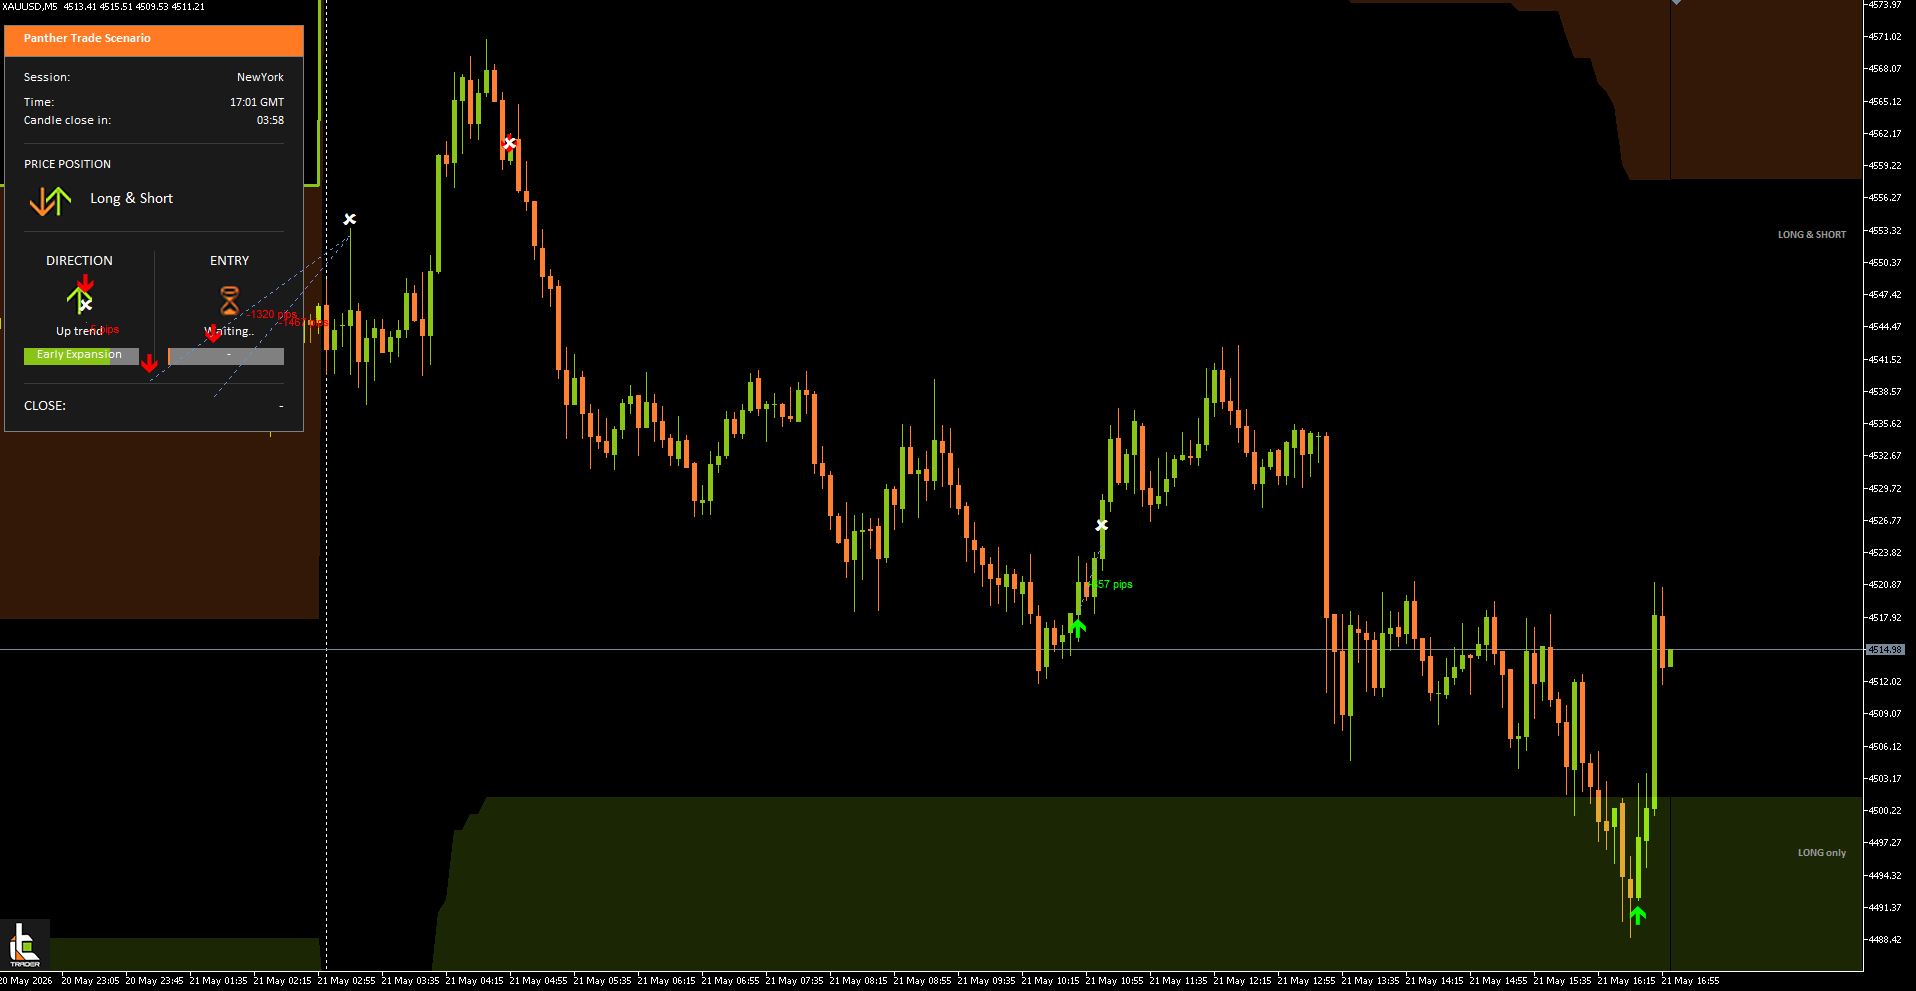
Fig. 6. The trade was not opened: a weak signal formed after the end of the 04:00–15:00 GMT trading window
A strong buy signal was received on May 22. After the decline, the price formed conditions for a long scenario, while confirmation for an entry appeared on the lower timeframe. The first long trade was opened based on this signal.
After that, the price made a local pullback, but the long structure remained intact. When a new confirmation in the direction of the upward movement appeared on the lower timeframe, a second buy position was opened. The price then made an upward impulse, but after it ended the movement started slowing down and signs of a possible short reversal appeared. At that moment, both trades were closed with a profit.
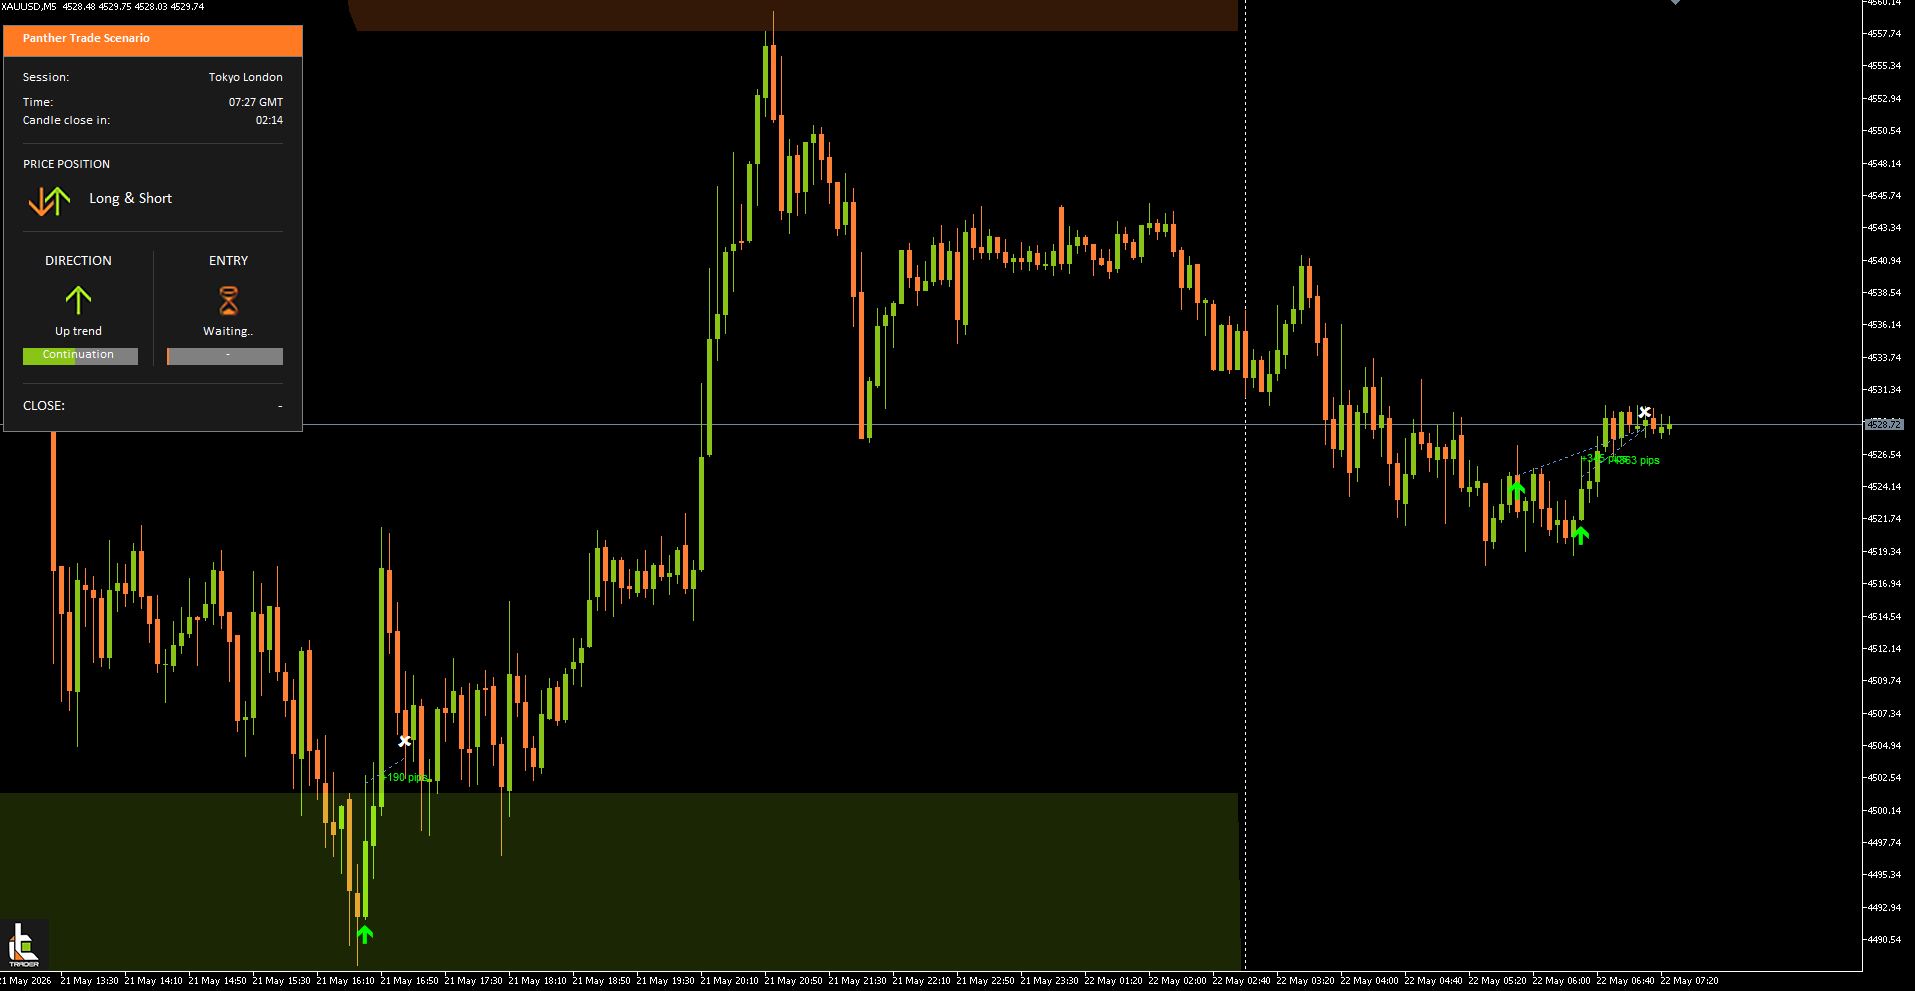
Fig. 7. Both trades closed with profit, the total result was 708 pips
Later that day, five buy trades on XAUUSD were opened consecutively. All signals appeared during trading hours, therefore they qualified for trading. The long scenario remained intact on the higher timeframe, while the Panther Trade Scenario indicator consistently provided confirmations on the lower timeframe after local price pullbacks.
The first trade was opened after the price started recovering from the decline and a buy confirmation appeared on the lower timeframe. After that, the upward movement continued and the position was closed with a profit.
The second trade was opened after the next pullback, while the long structure was still intact. The indicator once again formed a buy entry point, and the price continued moving in the direction of the signal.
After that, the market shifted into a more sideways movement, but the structure on the higher timeframe remained bullish. Therefore, the following signals were also considered as a continuation of the long scenario. The third, fourth, and fifth trades were opened as new confirmations appeared on the lower timeframe. Some movements were short, but each position moved in the direction of the signal and was closed according to the trade management rules.
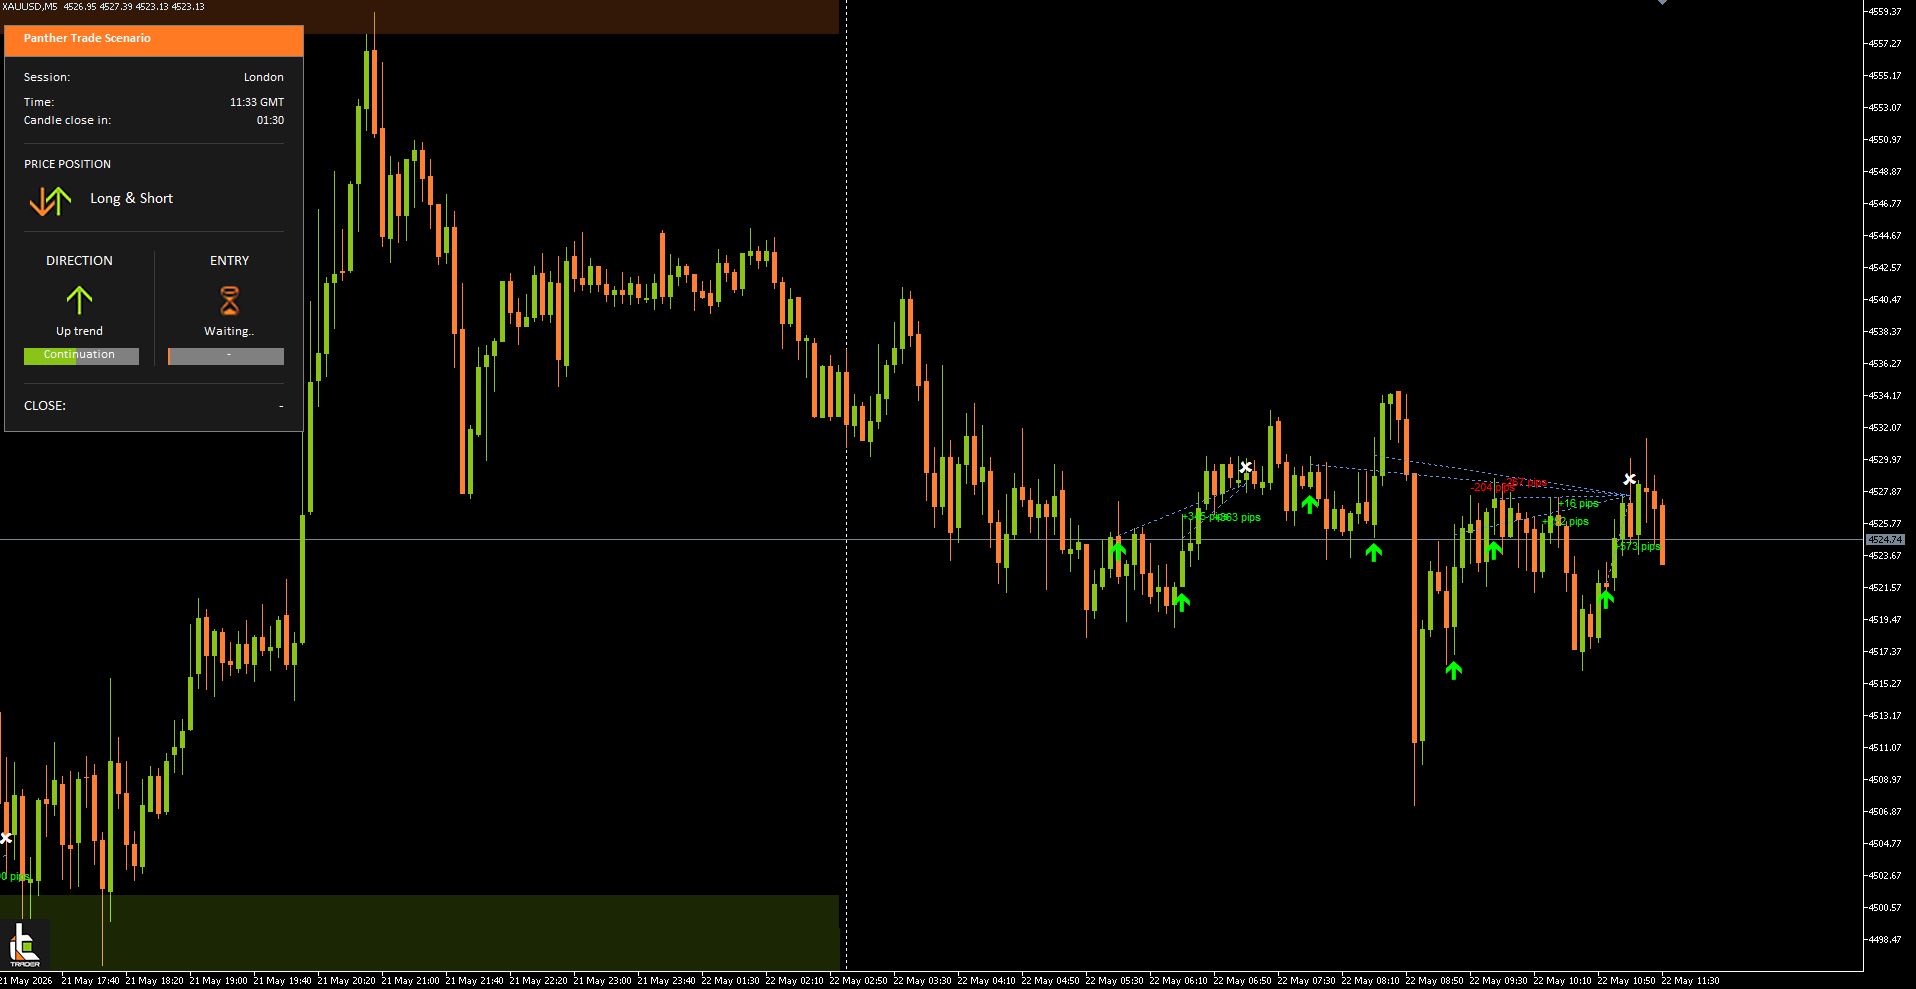
Fig. 8. Five trades were opened during trading hours: two positions closed with a loss, while three closed with profit. The total result was +370 pips
Once again, three more buy trades were opened consecutively on that day. The long scenario remained intact on the higher timeframe, therefore the Panther Trade Scenario indicator continued searching for entries in the direction of the upward movement.
The first position was opened after confirmation appeared on the lower timeframe. The price then made a local pullback, but the overall long scenario remained intact, therefore after a new confirmation appeared, a second trade was opened. Later, after another pullback and a repeated buy confirmation, the third position was opened.
After that, the price formed a strong upward move. When the movement started slowing down and the probability of a reversal appeared, all three trades were closed in the same area with a total positive result.
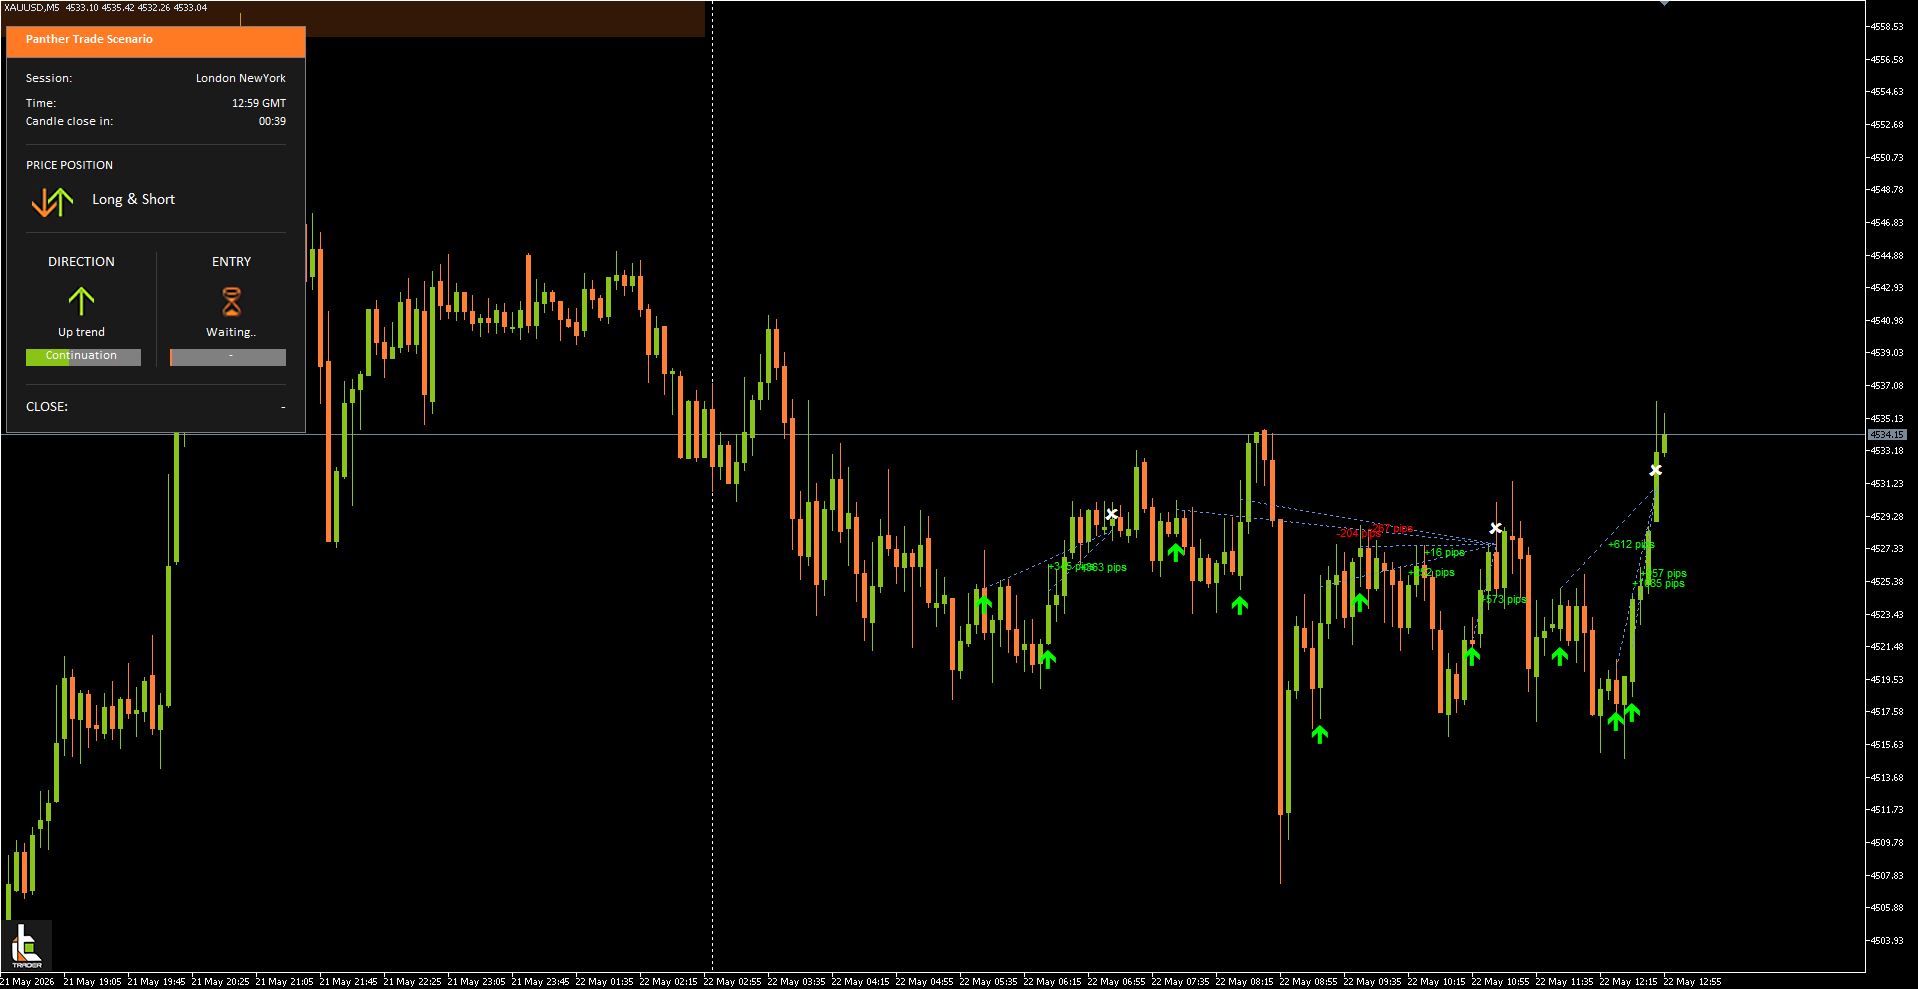
Fig. 9. Three trades were consecutively opened based on the Panther Trade Scenario long setup and were closed after the overall upward impulse movement ended. The total result was +2654 pips
Toward the end of the trading window, two more buy signals appeared on XAUUSD. Before that, the price showed an aggressive decline, after which the movement stopped and the Panther Trade Scenario indicator formed the first long scenario. Confirmation for an entry appeared on the lower timeframe, therefore the first buy position was opened.
After that, the price made a local correction, but the conditions for the long scenario remained intact. When repeated confirmation in the direction of the buy trade appeared on the lower timeframe, the second trade was opened. Both positions were opened within the same upward scenario after the bearish movement had stopped.
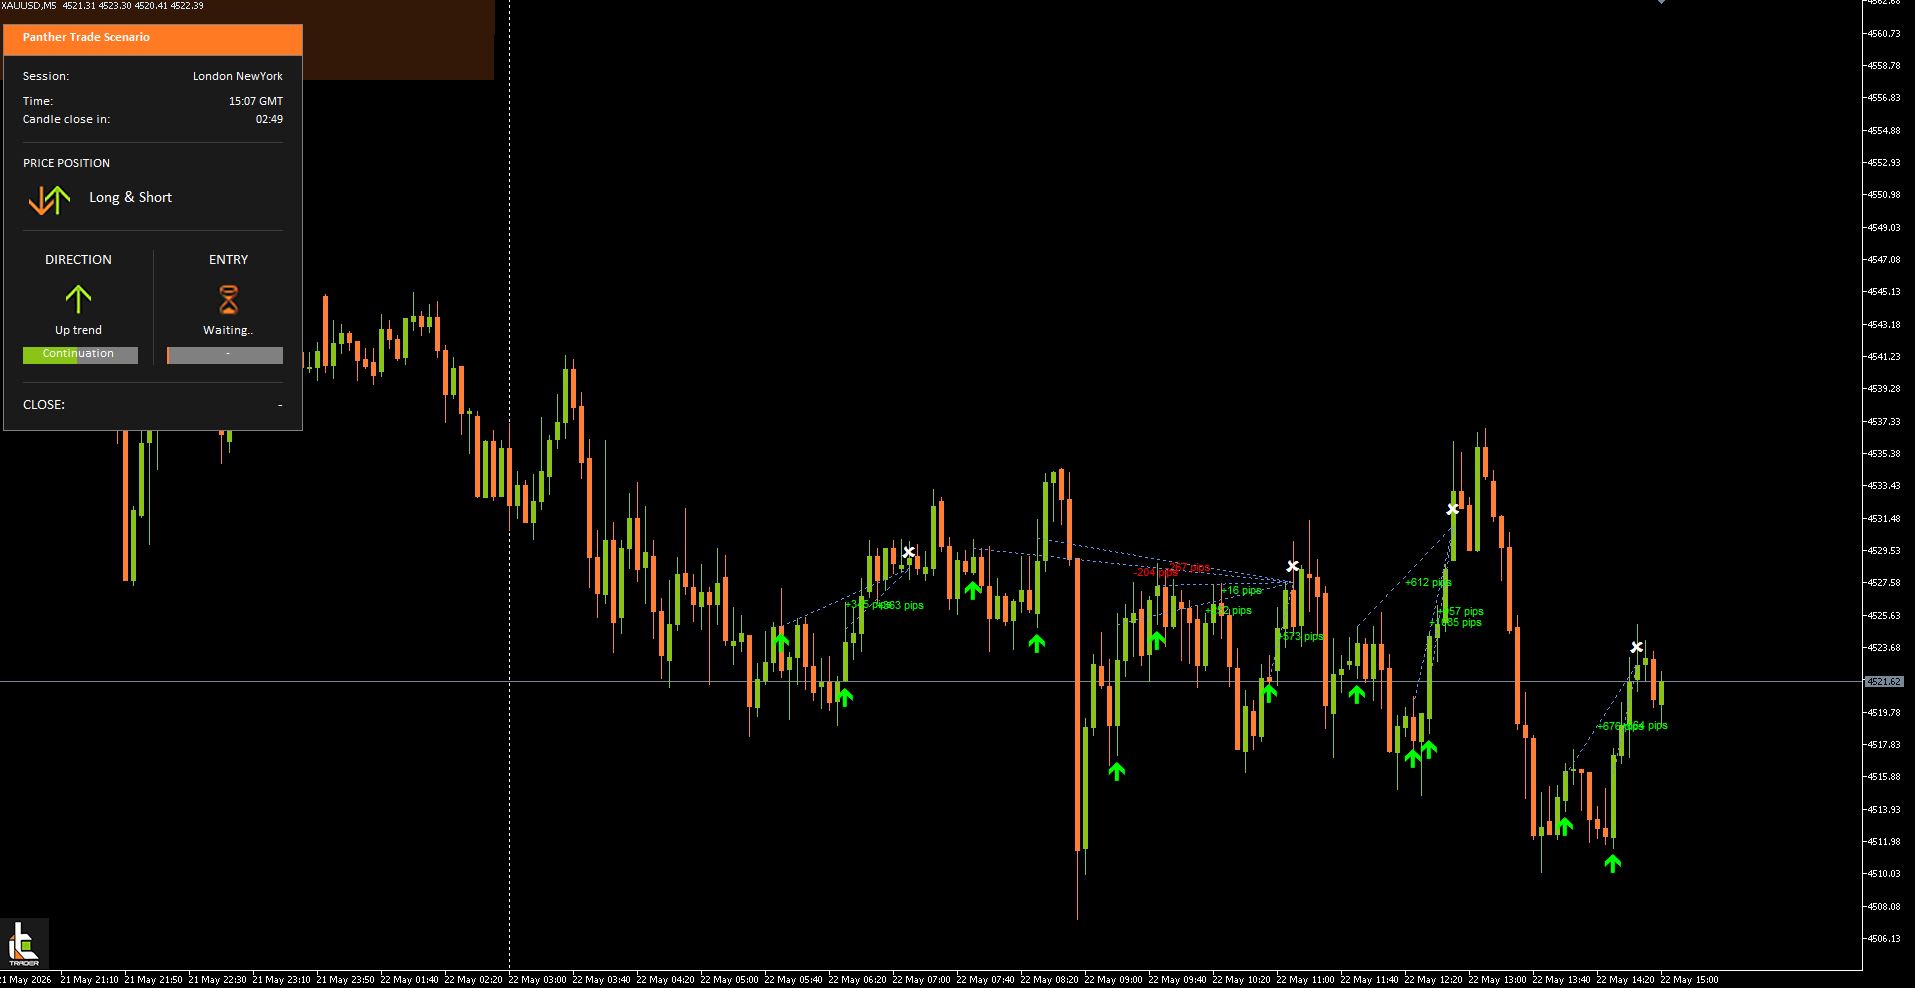
Fig. 10. Two trades were opened toward the end of the trading window based on the Panther Trade Scenario long setup and closed with a total profit of +1360 pips
Weekly results for XAUUSD:
During the the reviewed period, the Panther Trade Scenario indicator generated 21 trading signals on XAUUSD.
Out of these, 14 signals qualified for trading because they appeared during trading hours and matched the system conditions. Another 7 signals were deliberately skipped because they formed outside the 04:00–15:00 GMT trading window and were classified as weak.
The results for the opened trades are as follows:
Total trades opened: 14
Winning trades: 12
Losing trades: 2
Win Rate: 85.7%
Total result: +8102 pips

The weekly result clearly demonstrates the logic behind Panther Trade Scenario. Most profitable trades were opened not at random points, but after confirmation on the lower timeframe in the direction of the scenario forming on the chart. At the same time, weak signals appearing outside trading hours were not traded, which helped avoid overloading the statistics with late-night entries.
Despite having two losing positions, the overall weekly result remained strong: 12 profitable trades out of 14 and a final profit of +8102 pips. This shows that by following the trading window and signal selection rules, the indicator helps traders operate not on guesswork, but according to a predefined trade scenario.
🔍 Important
All signals can be verified in the MetaTrader strategy tester in visual mode — before purchase.
Panther Trade Scenario trading system
I'm Sergei Ermolov, follow me and don't miss more useful tools for profitable trading on the Forex market.


![[EURUSD]: Weekly Liquidity Activation Points (LAP), October 12-16, 2026](https://c.mql5.com/6/1035/splash-preview-777305.png "[EURUSD]: Weekly Liquidity Activation Points (LAP), October 12-16, 2026")
![[Nasdaq]: Weekly Liquidity Activation Points (LAP), October 12-16, 2026](https://c.mql5.com/6/1035/splash-preview-777311.png "[Nasdaq]: Weekly Liquidity Activation Points (LAP), October 12-16, 2026")
![[XAGUSD]: Weekly Liquidity Activation Points (LAP), October 12-16, 2026](https://c.mql5.com/6/1035/splash-preview-777308.png "[XAGUSD]: Weekly Liquidity Activation Points (LAP), October 12-16, 2026")