

💎 TL;DR
Gold Daily Range MT5 is a real-time dashboard that tells you exactly how much of the day's average range XAUUSD has already consumed - before you click buy or sell. It tracks the live day range against a 14-day ADR, shows where price sits within that range, flags extended conditions, and fires alerts when key thresholds are crossed. It does not generate signals or trade for you. It gives you the one piece of context most traders are missing right before they enter.

🔔 The Problem
You have seen the setup before. Clean structure. Price pulling back into a key level. Everything lines up. You hit buy.
Then nothing happens. Price creeps up a few dollars, stalls, and slowly grinds back down. You sit in a losing position wondering what broke - the structure, the timing, or you.
Most of the time, none of those things broke. The setup was fine. The problem was that gold had already moved $90 that day before you clicked. The average daily range for XAUUSD over the past two weeks was $107. The remaining average range above was roughly $17. That "clean pullback into structure" was actually a pullback from a level that was near the typical statistical limit for a normal session.
You were entering at 87% of the daily range consumed. On a day where much of the average movement had already been realised.
This is a surprisingly common reason otherwise reasonable trades underperform - not from bad structure reads, not from poor stop placement, but from entering a trade where the remaining average range offered relatively limited room for continuation compared to earlier in the session.
The painful part is that this information is not hidden. It is calculable. It is available on every bar. Most traders just do not have it organised in front of them in a format they can act on in real time.
🏆 The Real Engine
Gold Daily Range MT5 is built around one central concept: range consumed versus range remaining.
On each refresh cycle, the tool compares today's live range - the distance from the day low to the day high so far - against the 14-day Average Daily Range for XAUUSD. That comparison drives a percentage, the ADR Used figure, and from that percentage the tool derives a range state and a trading condition that update continuously on your chart.
The logic is layered rather than a raw percentage sitting in a corner. The tool translates that figure into human-readable guidance - ROOM AVAILABLE, TRADE WITH CAUTION, AVOID CHASING, EXHAUSTED DAY - so you can make a faster, cleaner decision without running the calculation yourself mid-session.
On top of that, it maps where price currently sits within today's range and projects where the 100% and 120% ADR extension levels fall from the day's low. These levels paint on the chart as horizontal lines with right-side labels, giving you an immediate visual picture of the range structure around current price. One glance tells you what page the day is on.
🚀 A Note on ADR as Context, Not a Ceiling
Before going further, it is worth being direct about something.
ADR is an average. It describes what a typical day has looked like over the past 14 sessions. It is not a hard limit. Gold regularly extends beyond 100% ADR on strong trend days, news-driven sessions, or high-volatility macro events - sometimes reaching 150% to 200% of the average range or more.
A reading of 90% or 100% ADR used does not mean price must reverse. It means the day's move has already exceeded or equalled its recent average and that continuation - if it happens - is occurring in statistically extended territory.
The tool is designed to flag that context, not to predict reversals. What you do with that information is your call.
🔎 What the Dashboard Shows
🏅 Live range panel
The panel shows today's live range in real dollar terms, the 14-period ADR value, and the ADR Used percentage alongside a colour-coded progress bar. At a glance: how much has moved today, how much the day typically moves, and how much of that typical range is already behind you.
🏅 Range state and condition labels
As ADR Used climbs through the day, the state label transitions through EARLY RANGE → HEALTHY RANGE → ACTIVE RANGE → EXTENDED RANGE → EXHAUSTED RANGE. Alongside it, the condition label shifts from ROOM AVAILABLE to TRADE WITH CAUTION to AVOID CHASING to EXHAUSTED DAY. These labels are colour-coded - green when conditions are open, amber when caution is warranted, red when the day is operating in extended territory relative to its recent average.
🏅 Price position within today's range
The panel shows two separate readings about where price sits. The first is the Position, which shows whether price is in the Lower Range (below 30% of today's candle), Middle Range (between 30–70%), or Upper Range (above 70%). The second is the Zone label, which reflects proximity to the intraday high or low - specifically whether price is near the day high, near the day low, or sitting in the middle of the current candle's range. These are two different measurements and it is worth understanding both: you can be in the Upper Range of today's candle (price is above the 70th percentile of today's high-low spread) while the Zone still reads MIDDLE RANGE if price is not yet within 15% of the day high. Both readings are visible at the same time in the panel.
🏅 ADR projection lines on the chart
Two sets of horizontal lines project forward: the 100% ADR target level, where a full average-range session would typically exhaust, and the 120% ADR extension level, which often becomes a useful reference during unusually volatile sessions - strong directional days, news-driven moves, or macro catalyst sessions where range expands beyond the recent norm. Both sets carry right-side price labels so you always have the exact number, not just the concept.
🏅 Previous day levels
PDH, PDL, and the previous day range all display on the panel. The prior day's high and low also paint as chart lines. These give your intraday structure context a second anchor - particularly useful during the Asian session and early London when today's range is still building.
🏅 Smart alerts
The tool fires popup, sound, push, or email alerts when ADR reaches 80%, 100%, and 120% consumed, on new day highs and lows, and when the day transitions to EXHAUSTED status. All alerts come with a configurable cooldown timer to prevent repeated triggers during choppy price action at a threshold level.
🏅 Screenshot mode
There is a dedicated Screenshot Mode input that optimises label offsets and font sizing for chart documentation. Traders who journal their sessions or use automated chart capture for performance review will find their captures cleaner and more readable with this mode enabled.
🏅 Minimise and compact display
A single click on the panel header collapses it to a title bar. The chart lines, ADR projections, and price labels stay visible. A compact mode input trims panel height during normal trading without collapsing it. Both options help keep the chart workspace clean during active sessions.
🌟 What This Looks Like in Real Trading
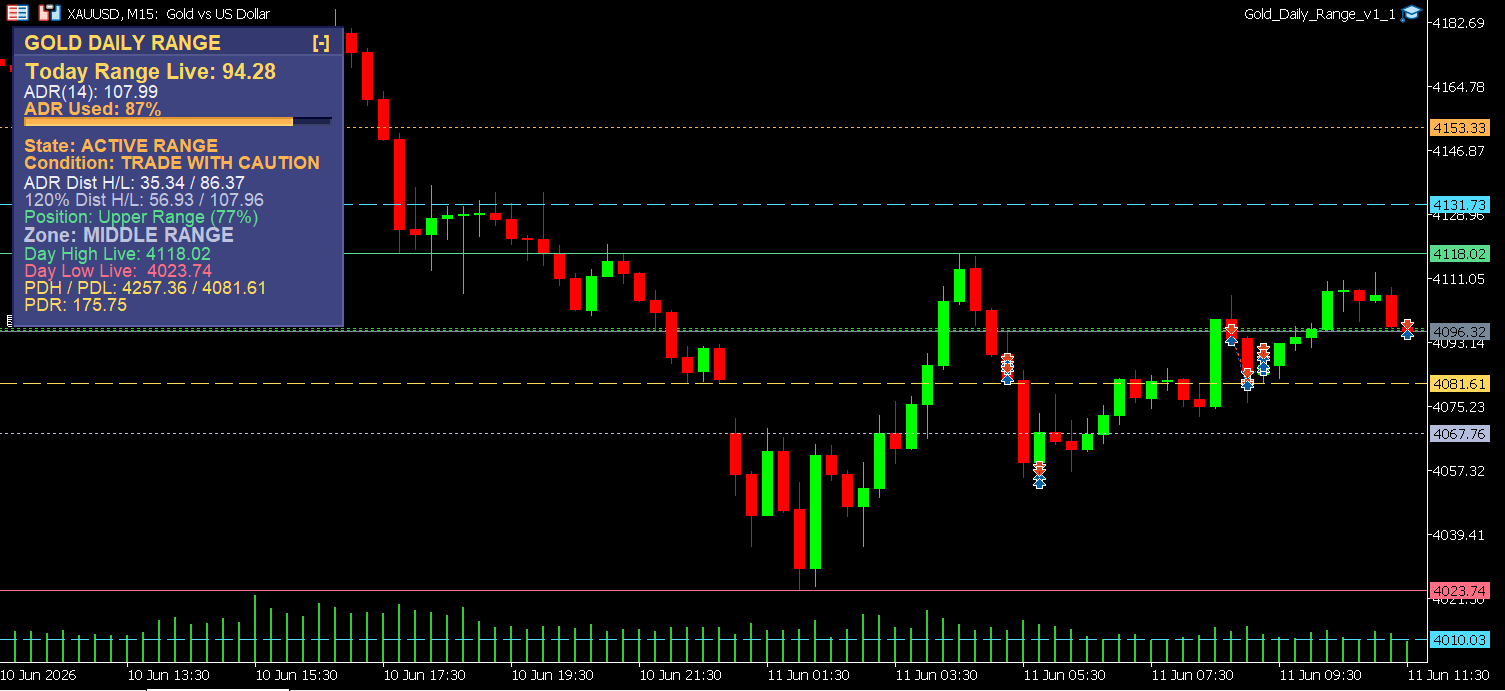
The screenshot attached to this post is taken from a live XAUUSD M15 chart - not a backtest render or a curated example constructed after the fact.
At the time of capture, the panel shows:
- Today Range Live: 94.28 dollars moved so far
- ADR(14): 107.99 dollars (the 14-day average)
- ADR Used: 87% - amber progress bar, well into the upper zone
- State: ACTIVE RANGE | Condition: TRADE WITH CAUTION
- Position: Upper Range (77%) - price is above the 70th percentile of today's candle
- Zone: MIDDLE RANGE - price is not yet within 15% of the day high, so it has not triggered the NEAR DAY HIGH zone label (two separate readings, as noted above)
- Distance to 100% ADR level: 35.34 up/86.37 down
- Distance to 120% extension: 56.93 up/107.96 down
- PDH/PDL: 4257.36/4081.61 | PDR: 175.75
What you are reading in one glance at this moment: gold has consumed 87% of its average daily range. Price is in the upper portion of today's candle. The remaining distance to the statistical 100% level is approximately $35 to the upside. Any breakout trade chasing higher at this point is operating where the reward-to-risk profile is often less attractive than it would have been earlier in the session - and where continuation, if it occurs, is moving into above-average territory.
That context sits permanently on the chart. Every time you look at a setup, it is already there, updated.
🔥 Practical Advantages Worth Noting
You stop second-guessing range context mid-analysis. When you are evaluating a setup, the range picture is already calculated and sitting in front of you. No second chart, no mental ADR calculation, no guessing whether the daily candle is small or large relative to recent history. One glance, done.
It changes how you size and filter. Once the day reaches AVOID CHASING status, many traders naturally start reducing position size or skipping trades entirely - not because the tool told them to, but because the context makes it obvious. That is risk management that does not require a rule, just awareness.
The previous day levels appear automatically. PDH and PDL are two of the most-traded reference points in intraday XAUUSD. Having them appear on the chart with labels every day without manually drawing them removes the friction and eliminates the possibility of mislocating them during fast market opens.
The 120% extension lines add a second reference tier. Most traders track the 100% ADR level. The 120% projection is less commonly pre-drawn but often becomes relevant during expansion sessions - strong directional moves, data releases, or geopolitical-driven runs where the average no longer defines the day's potential. Having it pre-calculated means you are not scrambling when price is already in motion.
Screenshot mode makes your journal cleaner. If you capture charts for daily review or use automated screenshot workflows, enabling Screenshot Mode ensures label offsets and font sizing are optimised for documentation. Small detail, real quality-of-life improvement.
Compact and minimise modes keep the chart clean. During active sessions when you need maximum chart space, the panel compresses or collapses entirely. The lines and labels remain. The panel comes back with one click.
🎁 Who This Is For - and Who It Is Not
🌟 This tool is genuinely useful if you:
- Trade XAUUSD manually on M5, M15, M30, or H1 timeframes
- Use price action, structure, or SMC-style analysis and want range context layered on top
- Have ever entered what looked like a clean setup only to find price stalled because the day's average had already been consumed
- Want to filter lower-probability trades more systematically without following signals
- Trade across multiple sessions and need a persistent, live reference for where the day stands
🌟 This tool is probably not for you if you:
- Trade fully automated systems with no manual chart reading
- Already have a robust range-tracking workflow and do not need a pre-built panel
- Trade primarily on higher timeframes - H4 and Daily - where intraday range context is less relevant to your decisions
- Are looking for entry signals, pattern detection, or anything that tells you when to trade
📝 What It Doesn't Do
Gold Daily Range MT5 does not produce buy or sell signals. It has no moving averages, no momentum calculations, no entry arrows, and no exit suggestions. It will not tell you where to place your stop loss or take profit.
It is not a strategy. It is context.
The tool shows you how much of today's statistical range has been consumed and where price sits within that range. Whether you trade, skip, reduce size, or wait for a better session - that is entirely your decision.
There is also no backtest replay mode. The tool runs in real time. It cannot display historical range states across past bars because those conditions do not exist in stored indicator buffers.
One more honest point: ADR is not predictive. The tool will show EXHAUSTED DAY at 120%+ consumed on a session that goes on to extend significantly further. On strong trend days or high-impact news, that happens. The tool flags statistical context, not certainty. If you treat it as absolute, you will be wrong on exactly the days when being wrong is most costly.
🎁 Get the Tool
👉 Gold Daily Range MT5 on MQL5 Market: https://www.mql5.com/en/market/product/169333
If you trade XAUUSD manually and you are not tracking how much of the daily range has already moved before you enter, this tool fixes that gap in about thirty seconds of setup.
🧰 Related Tools
✨ Gold Bias Regime Filter - Tells you whether the current session is in a trending, ranging, or no-trade regime. Pairs naturally with range context: knowing the day is in ACTIVE RANGE and the regime is choppy is a much stronger skip signal than either reading alone.
✨ Equity Protector Pro MT5 - Automatically enforces daily drawdown limits and locks out trading when the day's loss threshold is hit. If you are already filtering out late-session range trades using Gold Daily Range, this tool enforces that discipline mechanically so it holds even under pressure.
✨ Gold Trade Manager PRO - Handles position sizing, risk calculation, and trade placement in one panel. When Gold Daily Range shows ROOM AVAILABLE early in the session, Gold Trade Manager PRO makes it faster to size and execute correctly without switching between screens.
❓ FAQ
✅ Does this tool work on timeframes other than M15?
Yes. The panel works on any chart timeframe. The daily range calculations reference the D1 candle regardless of which chart you attach it to, so the ADR, day high, day low, PDH, and PDL data are consistent across M1, M5, M15, M30, H1, and H4. Most users run it on M15 or M30 for intraday trading context.
✅ What ADR period should I use?
The default is 14 days, covering roughly three weeks of recent market behaviour. During elevated volatility periods - strong macro themes, geopolitical events, sustained gold trend runs - shortening the period to 7–10 days captures the expanded range environment more accurately. During quiet, range-bound months, 20–21 days gives a more stable baseline. The right setting depends on the current market character rather than a fixed rule.
✅ Can I run this alongside my existing indicators and EAs?
Yes. The tool draws its panel and lines on the chart without interfering with other indicators, utilities, or Expert Advisors. A unique object prefix system ensures there are no naming conflicts with other tools attached to the same chart. You can run it alongside structure tools, trend indicators, volume tools, or session filters without issues.
✅ Will it alert me when the day reaches extended or exhausted status?
Yes. Alerts are configurable for ADR reaching 80%, 100%, and 120% consumed, for new intraday highs and lows, and for the EXHAUSTED DAY condition. All four alert channels are supported - popup, sound, push notification, and email. A cooldown timer prevents repeated triggers during choppy price action around a threshold level.
✅ Does it work on instruments other than XAUUSD?
The tool is designed primarily for XAUUSD. The default range state thresholds and ADR period are set with gold's volatility profile in mind. It will function on other instruments technically, but the threshold logic and condition labels may need retuning to reflect the different price behaviour of those markets.
✅ The panel shows both a Position (Upper Range 77%) and a Zone (MIDDLE RANGE) - are those contradictory?
No - they measure two different things. The Position reading (Upper Range, Middle Range, Lower Range) shows where the current price sits as a percentile within today's entire high-low candle. The Zone reading reflects proximity to the intraday high or low boundary: NEAR DAY HIGH, NEAR DAY LOW, or MIDDLE RANGE. You can be in the upper portion of today's candle (above the 70th percentile) without yet being within the NEAR DAY HIGH zone threshold, which defaults to within 15% of the day's high. Both readings together give a more complete picture than either alone.
🎁 New to Gold Algo Lab?
Start with the Gold Algo Lab Tool Map - a practical guide that organizes our MT5 tools into 6 connected stages: market context, setup selection, risk planning, trade execution, position management and account protection.
→ Gold Algo Lab Tool Map: Where to Actually Start With MT5 Tools for XAUUSD
https://www.mql5.com/en/blogs/post/771930
Do not choose a tool by its name alone. Start with the part of your trading process that needs the most control, then build your workflow one layer at a time.
Gold Algo Lab builds practical, risk-first MT5 tools for serious XAUUSD traders, shaped by 8 years of developing and trading real systems to help traders identify clearer setups, manage risk with greater confidence and execute with more discipline.




