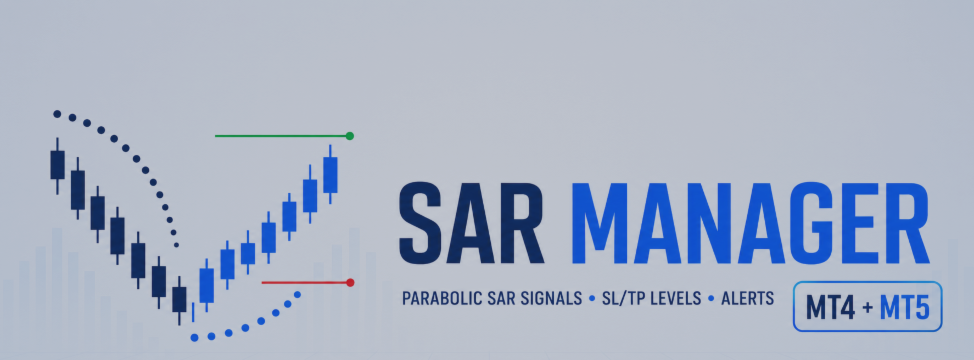
SAR Manager — When Parabolic SAR Dots Become a Complete Trading System

Parabolic SAR is familiar to almost every trader. Its dots are easy to recognize on a chart: when they are positioned below the price, the market is considered to be moving upward. When the dots move above the price, they indicate a possible downward movement.
However, the standard Parabolic SAR displays only dots. It does not calculate Stop Loss and Take Profit levels, mark a complete history of entries and exits, send detailed notifications, or provide signal statistics.
This is why SAR Manager was created — a visual signal indicator that transforms the classic Parabolic SAR into a clear and structured trading system.
The indicator is available in two separate versions:
-
SAR Manager for MetaTrader 4
-
SAR Manager for MetaTrader 5
Both versions are available without payment.
Familiar Logic in a New Format
SAR Manager is based on the classic Parabolic Stop and Reverse logic.
A BUY signal is generated when the SAR dots move from above the price to below it. A SELL signal appears when the dots move from below the price to above it.
However, the indicator does not react to every intrabar change. A reversal is confirmed only after the candle closes, and the virtual entry is calculated using the opening price of the next candle.
This is an important principle of SAR Manager. The current candle can still change, so using unfinished data may produce unstable signals. Confirmation on a closed candle creates a consistent signal history: once a signal has been confirmed, it does not disappear or change direction afterward.
More Than an Arrow — a Complete Signal Structure
When a new direction appears, SAR Manager displays more than just a BUY or SELL arrow.
For every virtual entry, the indicator calculates:
-
Entry price
-
Stop Loss level
-
Take Profit level
-
Position direction
-
Exit reason
-
Result of the closed signal in points
Stop Loss and Take Profit distances are configured in the input parameters. This allows the indicator to be adapted to different instruments, timeframes, and trading approaches.
One trader may use a smaller Stop Loss and a shorter target for intraday trading. Another trader may increase the distances to analyze longer market movements.
All distances are specified in MetaTrader points. For example, on a five-digit Forex symbol, 100 points are equal to 10 standard pips.
Complete Chart Visualization
One of the main purposes of SAR Manager is to make every signal easy to understand without constant calculations or analysis of multiple values.
The chart displays:
-
Parabolic SAR dots
-
Green BUY arrows
-
Red SELL arrows
-
Exit markers
-
Blue Entry line
-
Red Stop Loss line
-
Green Take Profit line
-
Price labels for all trading levels
The trader can immediately see the signal direction, potential risk, and target.
If necessary, the latest Entry, Stop Loss, and Take Profit levels can remain visible after the virtual position has been closed. This makes it possible to evaluate how the price behaved after the signal and whether the selected settings match the character of the instrument.
Advanced Exit Logic
A virtual position in SAR Manager can be closed for several reasons:
-
Stop Loss is reached
-
Take Profit is reached
-
An opposite SAR signal appears
-
The market opens beyond a level due to a price gap
If the market opens beyond the Stop Loss or Take Profit level, the indicator processes the gap and uses the actual candle opening price.
Special attention is given to situations where both Stop Loss and Take Profit are reached within the same historical candle. Standard OHLC data cannot show which level was reached first.
SAR Manager provides two calculation modes for this situation:
-
Stop Loss First — conservative calculation
-
Take Profit First — alternative calculation
The conservative Stop Loss First mode is used by default.
An Information Panel Instead of Manual Calculations
An information panel is displayed in the upper part of the chart. It combines the current indicator status with the results of previous signals.
The panel displays:
-
Trading symbol
-
Current timeframe
-
BUY or SELL signal
-
ACTIVE or WAIT status
-
Current SAR direction
-
Entry price
-
Stop Loss
-
Take Profit
-
Risk-to-reward ratio
-
Number of BUY entries
-
Number of SELL entries
-
Number of closed virtual positions
-
Winning, losing, and breakeven results
-
Total result in points
-
Reason and price of the latest exit
Color-coded information makes the panel easier to read. BUY, SELL, Entry, Stop Loss, and Take Profit use different colors, allowing the trader to understand the current situation with a quick glance.
The number of analyzed candles is controlled by the InpHistoryBars parameter. The user can select the historical depth used for signal generation and virtual statistics.
Entry and Exit Notifications
SAR Manager can monitor Parabolic SAR changes without requiring the trader to watch the chart continuously.
The indicator supports:
-
MetaTrader popup alerts
-
Mobile Push notifications
-
Email notifications
-
Sound alerts
Entry and exit notifications can be enabled separately.
A new entry notification contains the direction, symbol, timeframe, Entry price, Stop Loss, and Take Profit.
When a virtual position is closed, the indicator reports the position direction, exit reason, closing price, and result in points.
After installation, SAR Manager does not send messages for old historical events. Notifications are activated only for new events and are protected against repeated delivery on every tick.
Flexible Settings for Different Trading Styles
Parabolic SAR does not have universal settings that work equally well in every market. More sensitive parameters may be suitable for one instrument, while smoother settings may work better for another.
SAR Manager allows the user to adjust:
-
SAR acceleration step
-
Maximum SAR acceleration
-
Stop Loss in points
-
Take Profit in points
-
Arrow distance from the price
-
Number of analyzed candles
-
SL/TP same-candle calculation policy
-
Display of trading levels
-
Keeping the latest levels after an exit
-
Notification methods
-
Colors of dots, arrows, and lines
-
Information panel position
This allows the indicator to be used for analyzing currency pairs, metals, indices, cryptocurrencies, and other instruments available in MetaTrader.
Who Is SAR Manager Designed For?
The indicator may be useful for traders who:
-
Already use Parabolic SAR
-
Want clear entries and exits
-
Prefer to evaluate risk and target in advance
-
Analyze different Stop Loss and Take Profit settings
-
Work with multiple timeframes
-
Want to receive notifications about new events
-
Study signal history directly on the chart
-
Prefer clear visual trading tools
SAR Manager does not complicate the classic Parabolic SAR concept with dozens of hidden filters. Its purpose is to make a familiar system more informative, convenient, and transparent.
Two Versions: MetaTrader 4 and MetaTrader 5
SAR Manager has been developed for two popular trading platforms.
The MetaTrader 4 version uses the native Parabolic SAR calculation available in MT4. The MetaTrader 5 version works with the standard SAR indicator available in MT5.
Both versions use the same core logic:
-
Signal confirmation on closed candles
-
Entry at the opening of the next candle
-
Virtual SL and TP levels
-
Entry and exit visualization
-
Information panel
-
Statistics in points
-
Notifications
The MT4 and MT5 versions are available without payment.
Important Information
SAR Manager is an information and signal indicator. It does not open real orders or manage a trading account.
All positions, levels, and results displayed in the panel are virtual. The calculations do not include exact historical spreads, commissions, swaps, or possible slippage. Therefore, the displayed statistics should not be treated as a complete strategy backtest.
The indicator does not guarantee profitable trading. Its purpose is to help traders organize Parabolic SAR signals, view risk and target levels, analyze historical events, and receive timely notifications.
Before using the selected settings on a live account, test them on historical data and a demo account.
Conclusion
Parabolic SAR remains one of the most recognizable trend indicators. Its strength comes from a simple concept: the dots change their position relative to the price and indicate a possible change in direction.
SAR Manager preserves this simplicity while adding the features missing from the standard indicator: entries, exits, Stop Loss, Take Profit, notifications, statistics, and complete chart visualization.
Standard SAR dots now become more than simple chart marks — they form a clear system for monitoring market movement.
SAR Manager is available for MetaTrader 4 and MetaTrader 5. Both versions are available without payment.



![[iVISTscalp5]: XAUUSD. Forecast First. Market Reaction Afterwards](https://c.mql5.com/6/1035/splash-preview-777232.png "[iVISTscalp5]: XAUUSD. Forecast First. Market Reaction Afterwards")
