Category: Trading Systems · By: Nik Andersen · March 2026
If you develop Expert Advisors and run optimizations in MetaTrader 5, you know the feeling: thousands of parameter combinations, a wall of numbers, and no real clarity on which results are solid — and which are curve-fit illusions waiting to collapse in a live account.
This article introduces the Nika Quant Analyzer — a post-optimization analysis tool designed to replace guesswork with data-driven decisions. It does not generate signals. It does not promise profit. It helps you pick the right parameter sets before you deploy.
The Real Problem With MT5 Optimization
The MetaTrader 5 Strategy Tester is powerful. But after an optimization run, you are staring at a raw table: Profit, Profit Factor, Sharpe Ratio, Recovery Factor, Drawdown, Custom Metric — one row per pass, sometimes thousands of them.
| ⚠️ The common mistake: Sort by Profit Factor, pick the top row, and go live. This is how most traders find configurations that look perfect in history — and collapse immediately in forward trading. |
Single-metric optimization is a trap. A result with a Profit Factor of 4.2 but only 12 trades and 60% drawdown is not a robust strategy — it's a coincidence. You need to evaluate multiple dimensions at once, across hundreds or thousands of passes, without losing your mind.
Introducing the Nika Quant Analyzer
The Nika Quant Analyzer is an MQL5 indicator that reads your exported XML optimization files, ranks every pass using a composite scoring system, and presents the results in a clean, interactive panel directly on your MT5 chart. One tool. One panel. All the clarity you were missing.
📊 Dashboard Overview — All optimization passes ranked by QM+ Score with color-coded metrics and inline equity sparklines.
How the QM+ Score Works
The core engine is the QM+ Score — a single composite number that fuses six critical metrics into one decisive ranking value.
| QM+ Score Formula QM+ = (PF × 1.5) + (RF × 1.5) + (Sharpe × 2.0) + (1/MaxDD × 2.0) + (Trades × 1.0) + (RetDD × 1.5) |
Each weight is fully tunable via input parameters — meaning you can shift emphasis toward Sharpe if you prioritize risk-adjusted return, or toward drawdown if you are running a prop firm challenge. Instead of juggling six columns, every pass gets one score you can rank, compare, and filter instantly.
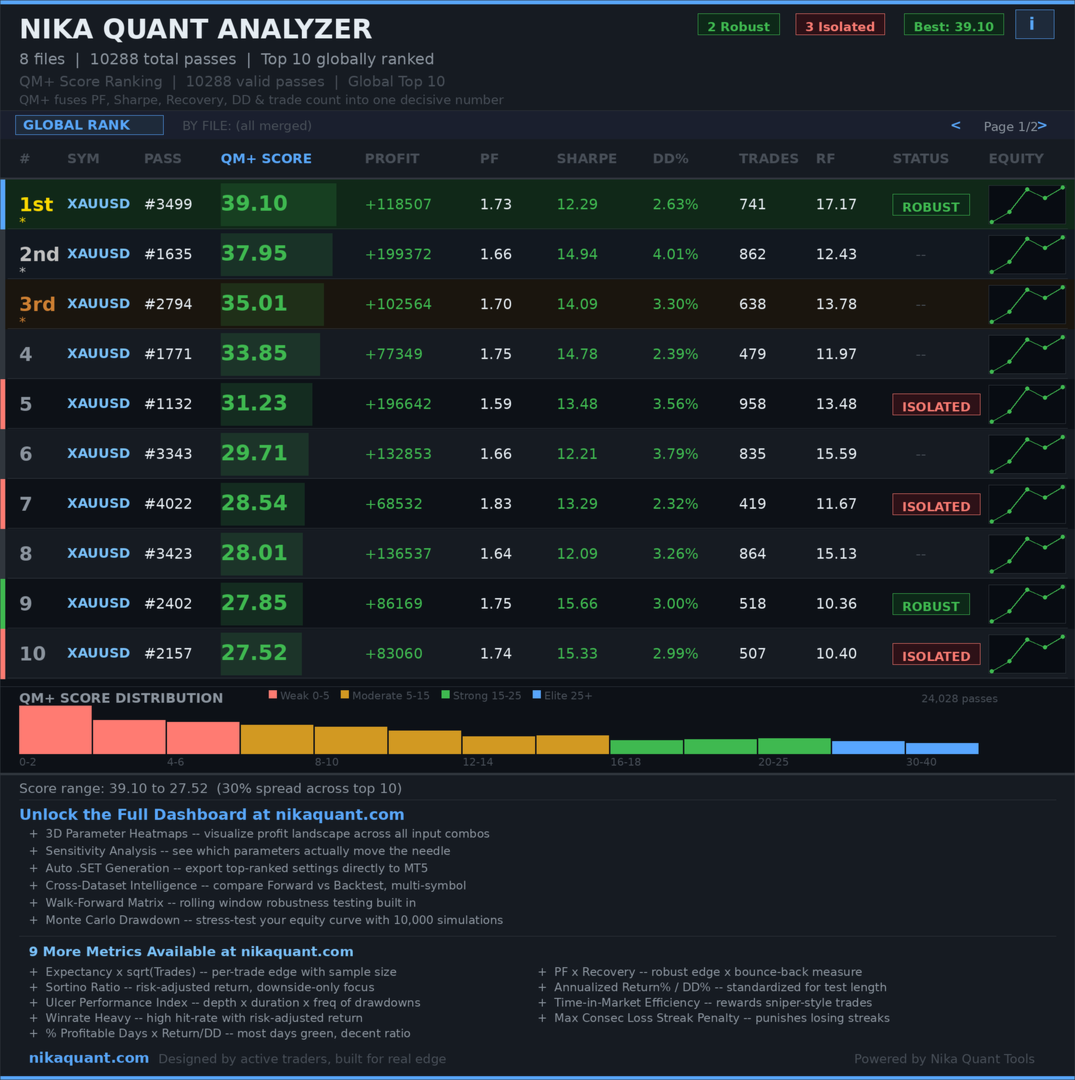
📉 QM+ Score Distribution Histogram — Passes tiered across Weak / Moderate / Strong / Elite bands. Notice how few passes reach the top tier.
Key Features
| ✦ | QM+ Composite Score — Fuses Profit Factor, Sharpe, Recovery Factor, Max Drawdown, Trade Count, and Return/DD into one number with fully tunable weights. |
| ✦ | Multi-File Global Ranking — Drop multiple XML files into MQL5/Files and the analyzer merges all passes into one unified leaderboard across symbols and timeframes. |
| ✦ | Equity Sparklines — Mini equity curves rendered inline per row so you instantly spot erratic or unstable behavior without opening individual reports. |
| ✦ | QM Score Distribution Histogram — Log-scale bar chart showing how passes distribute across quality tiers: Weak / Moderate / Strong / Elite. |
| ✦ | Page 2 Detailed Metrics — Click any row to open a second panel: Profit, Max DD, Trades, Sharpe, PF, RF, RetDD all in one view. |
| ✦ | Pattern Analysis — Identifies stable parameter value clusters among top performers to detect genuinely robust configurations. |
| ✦ | Forward vs Back Comparison — Automatically detects forward test data in your XML and flags the comparison for validation. |
| ✦ | Color-Coded Rankings — Green / Orange / Red visual coding across all metrics for instant scanning without reading every number. |
| ✦ | CSV Export — Export your full ranked results to CSV for external analysis or documentation. |
| ✦ | Auto-Detection — Automatically recognizes XML files placed in your MQL5/Files folder. No setup required. |
How to Use It — Step by Step
| 1 | Run your EA optimization inside the MT5 Strategy Tester as normal. |
| 2 | Right-click the results table and export to XML. |
| 3 | Place one or more XML files into your MQL5/Files folder. |
| 4 | Attach the Nika Quant Analyzer indicator to any chart. |
| 5 | The full analysis panel loads automatically — ranked leaderboard, histogram, sparklines, and color coding all visible immediately. |
| 6 | Click any row to open Page 2 and review the full metric breakdown for that pass. |
| 7 | Optionally export ranked results to CSV for documentation or further analysis. |
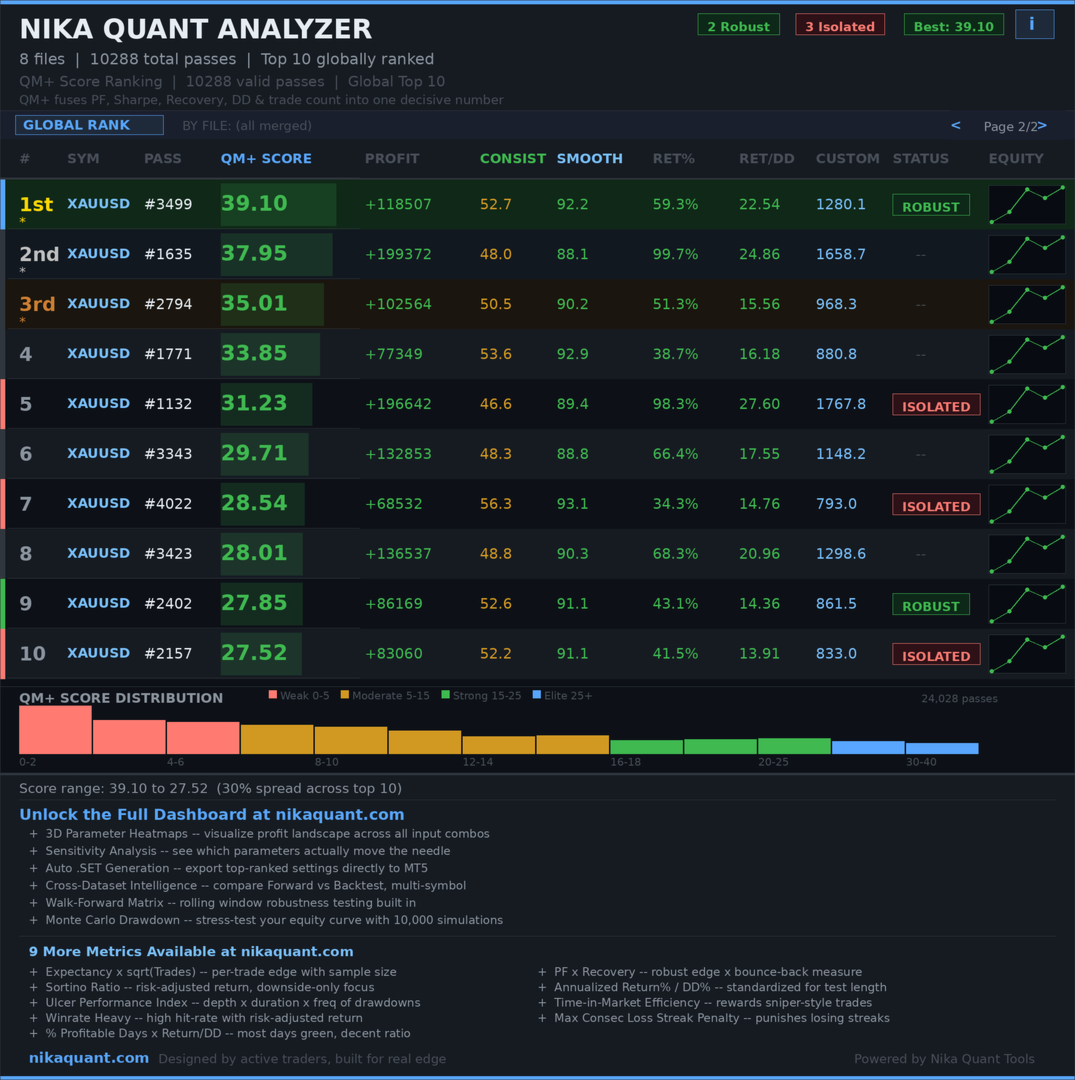
🔍 Page 2 — Detailed Metrics View — Full stat breakdown per pass: Profit, Max DD%, Trade Count, Sharpe, PF, RF, and Return/DD. Everything needed to make a confident deployment decision.
Practical Use Cases
Use Case 1 — Prop Firm Challenge Preparation
Before entering a prop firm evaluation, drawdown control is everything. Set the DD weight to 3.0 and the Trades weight to 1.5. The QM+ Score re-ranks every pass with drawdown as the dominant factor. Filter to a minimum of 30 trades and you get a shortlist built specifically for drawdown-sensitive environments — without touching a spreadsheet.
Use Case 2 — Cross-Asset EA Optimization
You ran the same EA on EURUSD, NASDAQ, and GBPJPY across three timeframes. Drop all six XML files into MQL5/Files. The global leaderboard merges them and ranks every pass together — you instantly see whether your EA performs better on EURUSD M15 or NASDAQ H1 without manually comparing six separate reports.
Use Case 3 — Robustness Filtering Before Live Deployment
Use Pattern Analysis to check whether your top-ranked passes cluster around similar parameter values. Scattered Elite-tier results across the parameter space = curve-fit warning. Tight clustering = genuine robustness worth deploying.
Why This Tool Is Different
| 💡 Most traders analyze optimization results manually — sorting by one column at a time, opening individual reports, making gut-feel decisions. The Nika Quant Analyzer replaces that entire workflow with a single, structured, data-driven panel. |
The key differentiator is the composite scoring approach. Rather than optimizing one metric, QM+ forces every pass to score well across six dimensions simultaneously. A result can't fake its way to the top by being great at one thing while hiding a critical weakness elsewhere.
The equity sparklines add a dimension that raw numbers cannot capture — the visual shape of an equity curve tells you whether a strategy is consistent or just lucky in a short burst. Combined with the histogram showing how rare Elite-tier results actually are, you develop a far more honest picture of your optimization landscape.
Who This Tool Is For
| 🤖 | EA Developers Building and iterating automated strategies that require rigorous parameter validation before live deployment. |
| 🏆 | Prop Firm Traders Need drawdown-focused ranking to survive evaluation phases and protect funded accounts under strict rules. |
| 📐 | Quant Researchers Conducting systematic multi-symbol, multi-timeframe backtesting campaigns producing large result sets. |
| ⚡ | Intraday & Scalpers Running high-frequency optimization passes generating thousands of rows needing fast, reliable filtering. |
Conclusion
Optimization without analysis is just expensive data generation. The Nika Quant Analyzer closes the gap between running thousands of backtests and actually knowing which ones are worth deploying. The QM+ composite score, cross-file global ranking, equity sparklines, and pattern analysis give you a complete framework for making parameter decisions based on evidence — not gut feeling.
This is not a shortcut to profits. It is a tool that makes your research more rigorous, your decisions more defensible, and your live deployments more likely to hold up outside the backtest window.
| Try the Nika Quant Analyzer Drop your XML files in, attach the indicator, and get your first ranked analysis in under two minutes. Visit NikaQuant.com → View on MQL5 Market → |


")
")