⚡ Pulse Mark Pro – See the Shift. Take the Trade | Non-Repainting Indicator
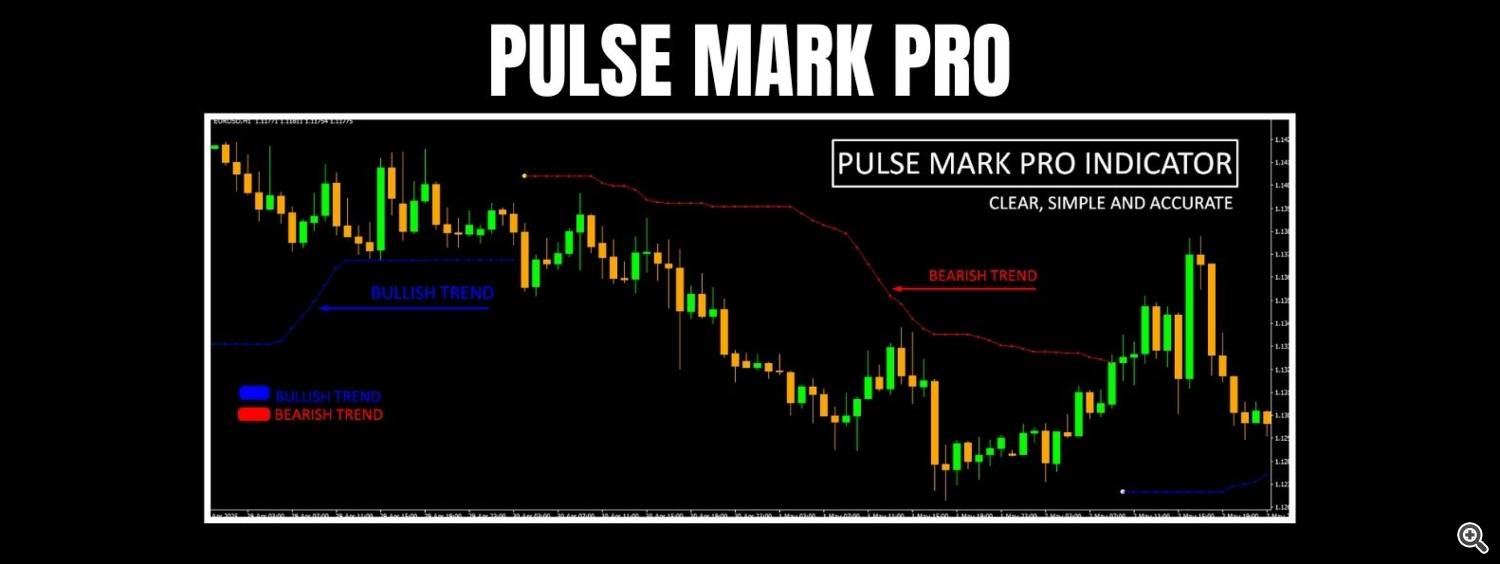
The PulseMark Pro indicator has been designed to identify early shifts in market direction. Unlike standard indicators that rely purely on the outcome of the most recent candle, PulseMark Pro applies a proprietary logic to detect the potential inception of a new trend—even when it appears counterintuitive in the short term. It offers a visual representation of momentum shifts through color-coded signals and dynamic dotted trend lines.
STAY UPDATED: Join the official channel for exclusive updates, upcoming releases, and advanced trading tools: https://www.mql5.com/en/channels/signalsandindicators
Trend Change Detection Logic
At the core of this tool lies a trend change detection point, which is displayed as a colored dot on the chart. This dot marks the moment when the algorithm detects a high-probability transition between bullish and bearish momentum.
What sets PulseMark Pro apart is that this point is not anchored to the color or direction of the last candle. Instead, it is based on a custom-built formula that considers volatility, past price action, and statistical deviation. As a result, users may notice that the dot appears before or after a clear directional move, depending on market noise and consolidation phases.
Dotted Line Guidance
In addition to the dot signals, the indicator plots a dotted dynamic line that acts as a visual guide for ongoing market structure:
- Blue dotted line: suggests a prevailing bullish context.
- Red dotted line: suggests a bearish market condition.
These lines adjust in real time, allowing the trader to align their directional bias with what the indicator is currently observing from price flow.
Operational Steps
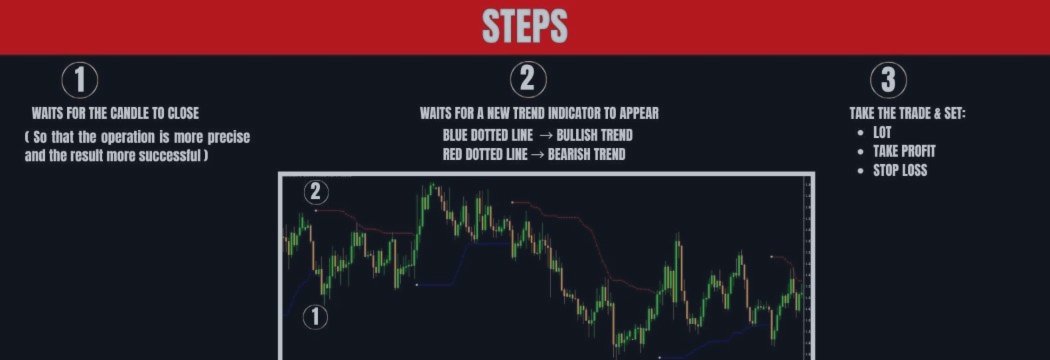
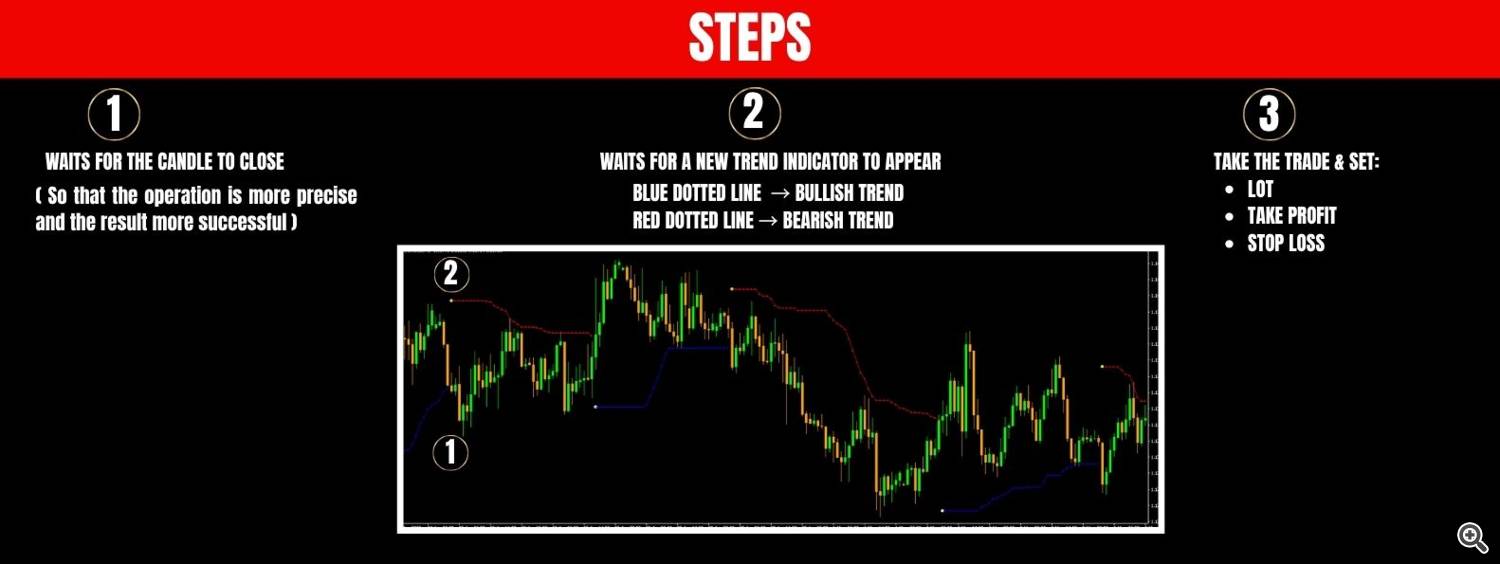
- Wait for Candle Close
The signal dot should only be interpreted after the corresponding candle has closed, ensuring that no false signal is acted upon prematurely. - Confirm New Trend Line Color
Once the dot appears, confirmation is sought through the emergence or continuation of the dotted line. This helps reduce overreaction during price spikes or short-lived pullbacks. - Execute the Trade Setup
Based on the identified direction, a trade can be initiated with trader-defined parameters for:- Lot size
- Take Profit
- Stop Loss
The indicator does not generate automatic trade levels but provides visual cues that can be incorporated into discretionary or rule-based systems.
Settings and Configuration
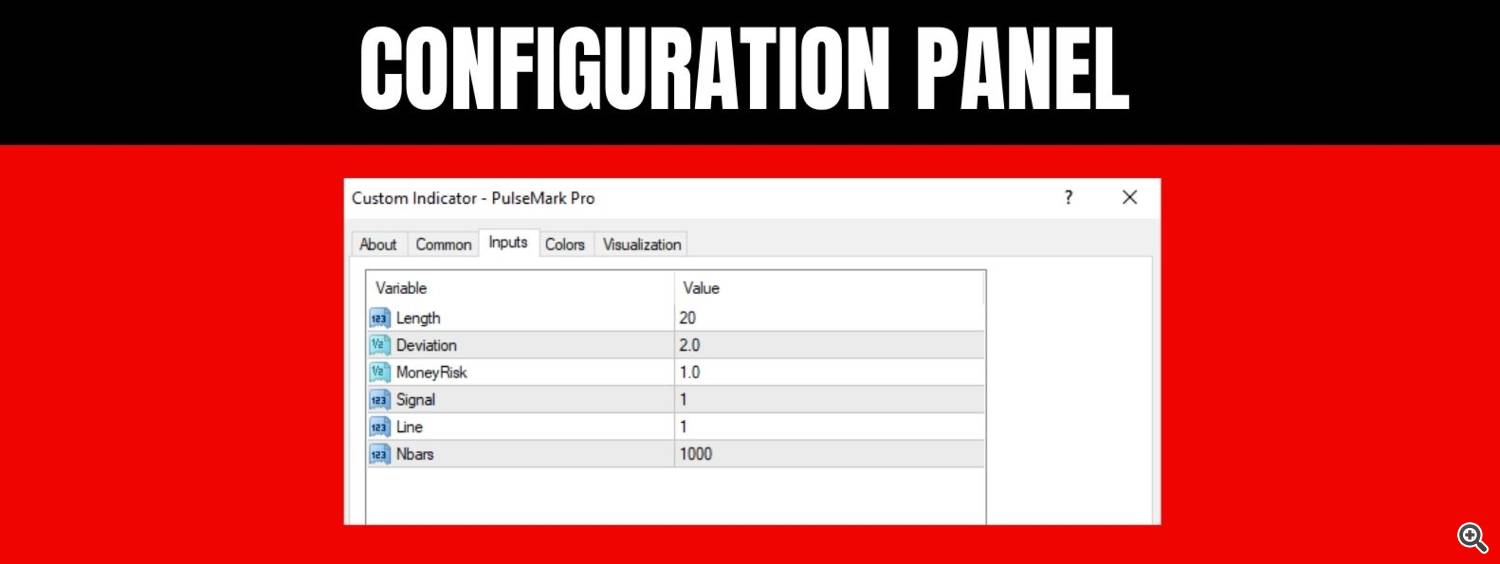
The PulseMark Pro input panel includes several tunable parameters:
- Length: Defines the lookback period used in internal calculations. A longer length provides smoother signals, while a shorter one is more sensitive to volatility.
- Deviation: A sensitivity multiplier affecting the tolerance of signal confirmation.
- MoneyRisk: Although not connected to auto-trading, this value can be used for visual scaling or internal calculation weights.
- Signal and Line: These toggles activate or deactivate the signal dot and the trend line display.
- Nbars: Sets the number of bars over which the indicator should perform its calculations and draw its visuals.
These options allow for moderate customization depending on the asset, timeframe, or risk preference of the trader.
PulseMark Pro does not repaint once a candle closes, and its logic is crafted to remain consistent across market conditions. While it does not attempt to predict tops or bottoms, it responds to price shifts based on measured structural behavior. It is best used in combination with proper risk management and a clearly defined trading plan.


