Deal with CHF/JPY.
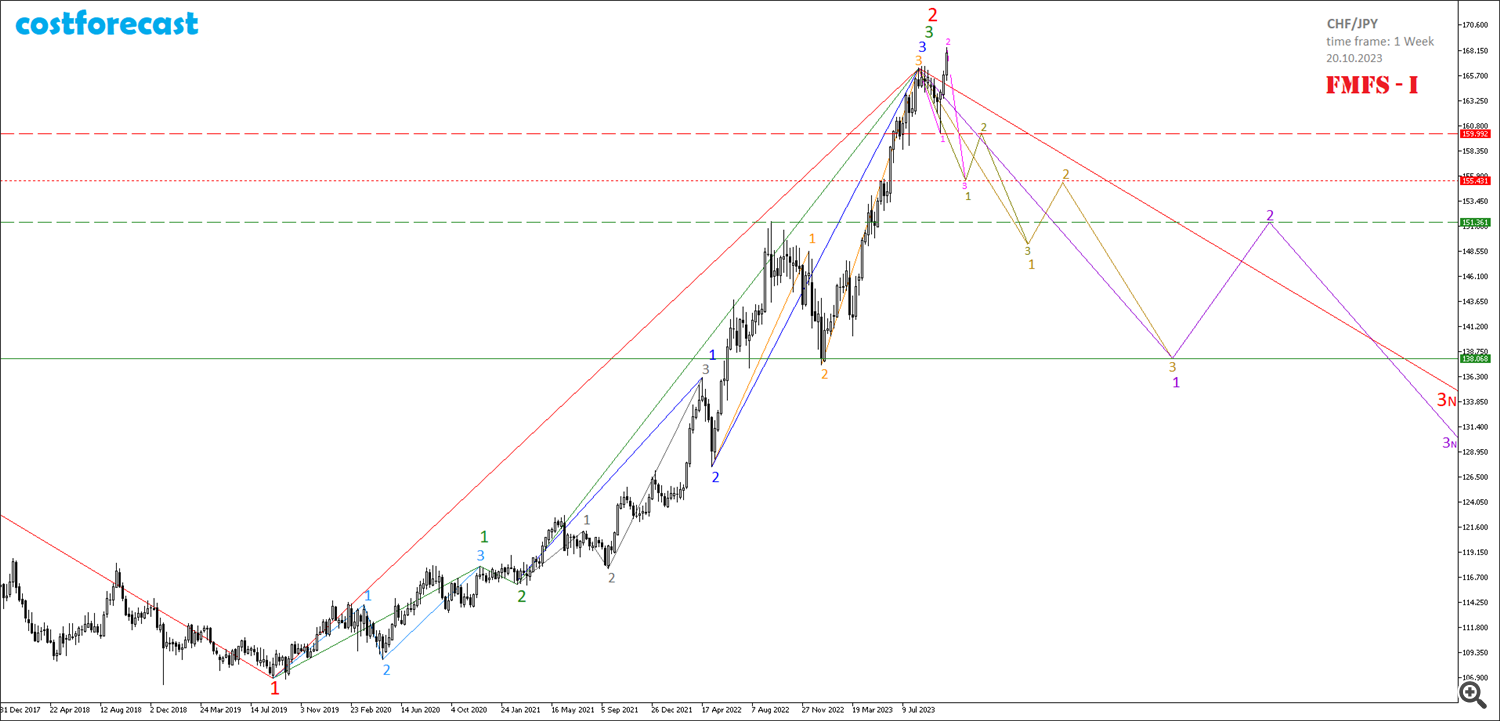
As of 10/20/2023, it can be assumed that on the chart of the dynamics of quotes of the CHF/JPY currency pair in the fractal structure on the time interval (09/03/2019; 08/17/2023), the 2nd fractal segment was formed, indicated in red in the form of fractal F№11 (from the Alphabet of Attractors) by a unit of lesser order, which is indicated in green. (Fig. 7-1).
The first segment of the green fractal is indicated by a fractal of one smaller order F№22 in blue on the time interval (09/03/2019; 12/10/2020). The 2nd segment of the green fractal was formed on the time interval (12/10/2020; 03/04/2021). And the green fractal ended with the formation of fractal F№12, which is indicated in blue, on the time interval (03/04/2021; 08/17/2023).
Taking these assumptions into account, we can say that the upward trend for the CHF/JPY instrument has ended and the future dynamics of quotes will be downward as part of the formation of the 3rd segment of the red fractal.
In this case, after August 17, 2023, a fractal is formed in the fractal structure of the chart, which is indicated in pink. Moreover, the 1st and 2nd segments of the pink fractal have already been formed.
Based on these reasoning, after October 20, 2023, there should be a decrease in quotes as part of the formation of the 3rd segment of this pink fractal as part of the formation of the 1st segment of the fractal by a unit of higher order, which is indicated in olive color.
Considering the extremely low probability of the upward trend continuing at a high pace, it was decided to open a short position on the CHF/JPY instrument at 167.876 with a volume of 0.01 lot on the “forexforecast” account (Fig. 7-2).


More to come.
You can learn about the modeling method in the article “Apophenia as an apologist for clairvoyance in capital markets”.
You can familiarize yourself with the alphabet for reading graphs by watching the short video “Alphabet of Niro Attractors”.
You can monitor transactions carried out on your accounts online by following the links posted on the costforecast website in the “trading signals” section: https://costforecast.bitrix24.site/tradingsignals-en/
Read all Diary entries on the costforecast website at the link: https://costforecast.bitrix24.site/blog1-2-en/


