

Product link:
https://www.mql5.com/en/market/product/97538
Introduction
Welcome to the Advanced CCI trading bot and tool, your all-in-one solution for studying and trading your preferred assets.
With this versatile tool, you have complete control over your strategy. By adjusting the various parameters, you can create a unique strategy based on the CCI indicator, including an MA filter, dynamic lot size, Kelly Criterion calculator, dynamic and trailing SL and TP levels, account protection specifically designed for those taking the FTMO or other prop firm trading challenges, analytics, stats, and basic symbol information.
Whether you're a scalper, breakout trader, mean reversion trader, trend follower, or any other type of trader, the Advanced CCI trading bot has got you covered. The ball is in your court, so take your trading to the next level with the Advanced CCI trading bot and tool.
At xignal-coding, we prioritize safe and responsible trading. That's why we never use any martingale or high-risk systems that could put your account in danger. You can trust that our robot is designed to help you achieve success in a sustainable and responsible manner.
Tabs

Inputs
Indicator Settings:
- CCI Period -> The Period of the CCI Indicator
- CCI Applied Price -> The Applied Price of the CCI Indicator
- ATR Period -> The Period of the ATR Indicator (if used for the SL and TP Levels)
Entry Settings:
- Level to send a Buy Order -> The CCI Level where we're gonna send a BUY order when crossed
- Cross type for Buy Order -> The crossing type of the above level. Above or Below (right after the bar is closed)
- Level to send a Sell Order -> The CCI Level where we're gonna send a SELL order when crossed
- Cross type for Sell Order -> The crossing type of the above level. Above or Below (right after the bar is closed)
Position Settings:
- Lot Mode -> You can select between Fixed Lot, Dynamic Lot per 1,000 or Risk in % (depending on the StopLoss)
- Lot Size -> The Lot size of your positions. It will be used if you have selected a Fixed Lot size, or it will be used to calculate the Lot size for the Dynamic Lot option (If the Dynamic Lot is selected, and you decide to trade 0.01 per 1,000, then the robot it will adjust the lot size on your account balance. 0.02 if AB = 2000, 0.1 if AB is 10,000 etc)
- Lot Risk in % -> The Risk you'd like to take if you select the third Lot Mode option. The Lot will be calculated using your StopLoss distnace, and in case of a loss, you will lose approximately this percentage of your Account Balance. (Due to the rounding of the calculations, the final result may vary a little, depending on the lot step)
- SL Method -> Three different ways to calculate the Stoploss. Using Points, using ATR or the recent Low (for Buy) or High (for Sell)
- TP Method -> Select between Points or ATR distance
- GAP in Points -> You can add an extra distance to the recent High or Low if this is the SL Method you have selected
- StopLoss distance in Points -> The distance in Points for the StopLoss
- TakeProfit distance in Points -> The distance in Points for the TakeProfit
- StopLoss distance in ATR -> The ATR multiplier for the StopLoss distance
- TakeProfit distance in ATR -> The ATR multiplier for the TakeProfit distance
Trailing Stoploss (Always calculated in Points):
- Use Trailing StopLoss -> Select whether you want to activate the Trailing SL or not
- Trailing Stop Trigger -> After how many points in profit you want to activate the TSL
- Trailing Stop Distance -> The distance in points you want to place the SL from the market price after the TSL is triggered
- Trailing Step -> The step of the TSL
General Settings:
- Close Open Positions at Opposite Signal -> Choose wheather you want to close your open positions when an opposite signal arrives (for example close all Buy postitions before sending a Sell and vice versa)
- Magic Number -> A unique identifier of the robot. Remember to change it if you want to have new stats or if you add the robot in more than one charts
- Position Comment -> You can have a custom comment for your positions
- Time Zone for Daily Balance -> It is used for the Manage tabe and the Daily drawdown. Some prop trading challenges like FTMO are using the GMT time to calculate your balance of the day. You can select between the GMT and the broker's time.
- Maximum Buy Positions -> How many Buy positions are allowed at the same time
- Maximum Sell Positions -> How many Sell positions are allowed at the same time
- Close a position after X bars (0 means deactivated) -> Here you have the option to close any position after a specific amount of bars, no matter if it is in profit or loss.
- Profits to exit mode -> Select if you want to use the "Profits to exit" functionality, and if you want to use it for any open position or use it when more than one postions are open at the same time*
- Profits to exit -> The total amount of the profit from the open positions in order to close them all and exit with a profit. If you have added this to 1, then if you have 2 open postions and the first is losing 4$ and the second is winning 5$, then both positions are gonna close and you will get the total profit of 1$.
Trading Window:
- Starting Hour -> The hour you'd like to start trading (Broker's time)
- Ending Hour -> The hour you'd like to stop trading (Broker's time) - Both values are set as integers in order to be used in the Optimization Process of the Strategy tester)
- Close all Open Positions at Ending Time -> Select wheather you'd like to close all your open positions at the ending time or not
- Maximum spread to open a position -> Open Positions only if the spread is below the selected value. 0 means disabled) If the spread is higher, we'll wait for the next signal.
MA Filter:
- Use MA Filter -> Choose wheather you'd like to use the MA Filter or not
- MA Period -> The period of the Moving Average
- MA Method -> The method of the Moving Average
- Buy only if Price is Above/Below MA -> Select between Above or Below. The robot is gonna send Buy orders only if the price is Above or Below the Market Price.
- Sell only if Price is Above/Below MA -> Select between Above or Below. The robot is gonna send Sell orders only if the price is Above or Below the Market Price.
- Close Positions if Price crosses MA -> You can use the MA as a dynamic exit level. So if you have selected to place orders only when the price is above the MA, the MA is gonna be used as a dynamic SL if this functionality is enabled. On the other hand, if you send Buy orders if the price is below the MA, the MA is gonna be used as a dynamic TP.
Strategies
Trading Overbought and Oversold CCI Levels
Check more profitable strategies here:
https://www.mql5.com/en/blogs/post/752777
Probably one of the most common ways to use the CCI is to wait until a specific level is crossed. In this example we're gonna see how the program behaved on the EURUSD H1 for the last year, when we place a Sell order right after the indicator crosses above the 110 level and a Buy order when it crosses below the -110.
Testing on "Every tick based on real ticks" as always.
Let's prepare the robot's inputs for this:

We are gonna use a period of 20 for our CCI Indicator. That is gonna make it more sensitive.
The ATR period is gonna be the default, 14.
Now as we want to backtest the strategy, we're gonna use the Fixed lot size mode. Later we can experiment by using the Percentage of risk or the Dynamic Lot per 1,000. And as we want to dream big, we're gonna use a high volume size, so we're gonna set it to 2. But is always recommended to use low lot size at the beginning.
For the other parameters, the Stoploss and the Takeprofit levels are gonna be calculated using the ATR Indicator. 3*ATR for the SL and 1*ATR for the TP. As we're trading oversold and overbought levels, it is very logical to leave some space to the market before reversing. And this is why the ratio in this case is 1:3.
Let's also activate the Trailing StopLoss. We're gonna activate it after 50 points in profit, we're gonna place the SL level at the entry price (aka break even) and we're gonna use a step of 20 points. That means that we're gonna change our stoploss every time we got 20 more points of profit.
Finally we're gonna close the open positions every time we get an opposite signal.
All the other parameters are not gonna be used in this example. It is very easy for anyone to get lost with all these different combinations of inputs, so we'd like to keep things as much simple as we can.
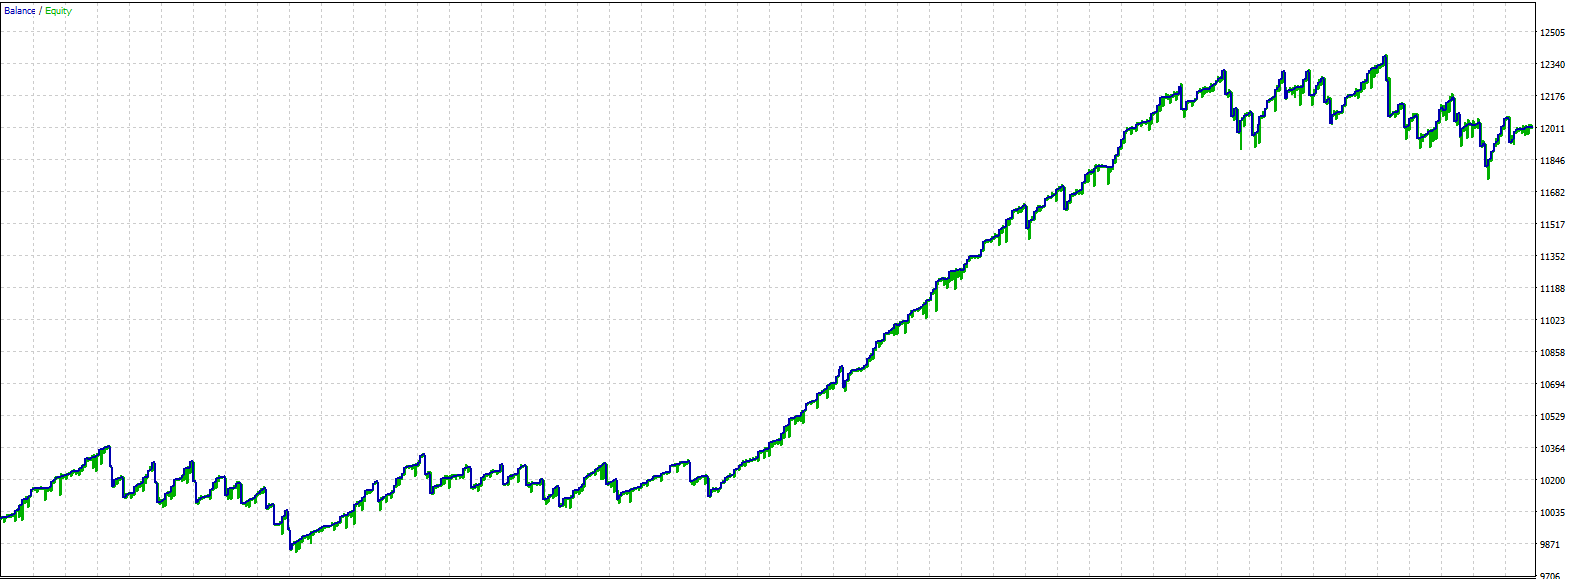
Let's see now what we got:

The result seems really good. Having the ups and downs, as every healthy strategy must have. It started with a 10,000 EUR account balance and it ended up with almost 30,000EUR. It's at 29,820.14EUR within a year. it is almost 300% profit.
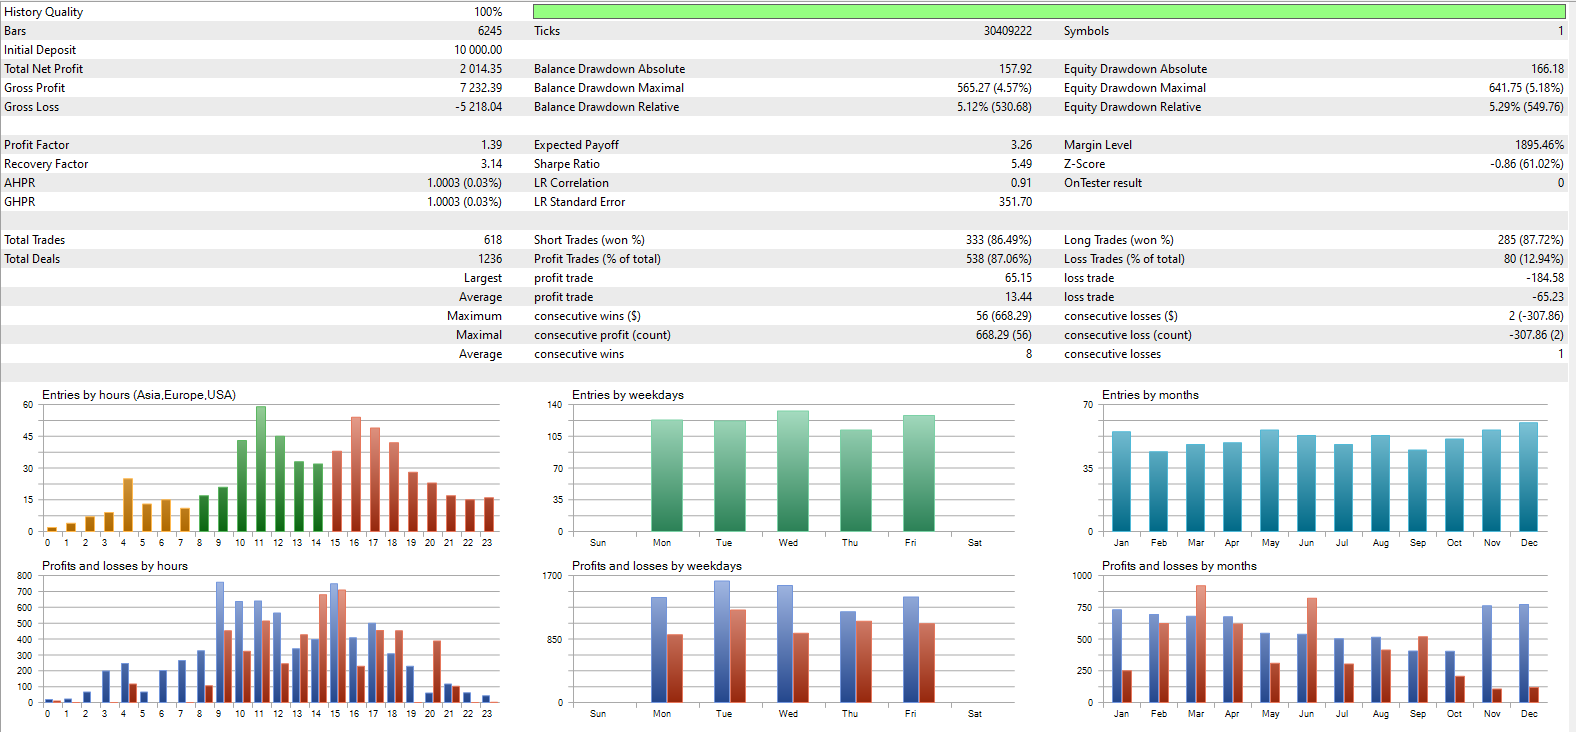
But wait a minute. isn't it risky? What is the drawdown? How can we be more safe?
As mentioned above in this example we used a high lot size. Let's take a look at the backtest:

What we can do about that?
How can we risk less?
Here we can use two different functionalities from the robot. The first one is the Account protection from the Manage tab of the dashboard. It is not available on the backtesing mode, so we're gonna focus on the second and probably the most important. The Risk in percentage.
We can select this method in order to know exactly how much of our account balance we risk in each trade. You can set this value as you wish, depending on the risk you'd like to take.
Let's explore a very safe scenario, where we risk only 1% of our account balance:

In this case, the Lot Size field is not used, and the Lot Risk in % takes its place.
As you can see now, the drawdown dropped dramatically, but so did the profit.
Conclusion
So it is up to you to find the best combination of risk and strategy no matter what your trading style is!
I hope you find this tool useful and help you succeed in the markets!


 & AMD Framework")
")